

Dr Shane Oliver – Head of Investment Strategy and Chief Economist, AMP Capital
Key points
-
Shares have had a good rebound but could still fall further in the short term as risks remain high around monetary tightening and geopolitical tensions.
-
However, a deep bear market is unlikely as US, global and Australian recessions are unlikely to be imminent.

Introduction
While shares have had a nice rebound from their January lows helped in part by some good earnings news – reversing around half of their 10% or so fall, concerns remain high around inflation, monetary tightening and the high risk of a Russian invasion of Ukraine. Our assessment remains that it’s too early to say we have seen the lows, but we remain of the view that January’s falls are not the start of major bear market.
The three bears – correction, gummy & grizzly
Very simply there are 3 types of significant share market falls:
-
corrections with falls around 10% – of course these aren’t really bear markets, but some might feel they are!;
-
“gummy” bear markets with falls around 20% meeting the technical definition many apply for a bear market but where a year after falling 20% the market is up (like 2018 & 2020 in the US and 2011, 2015-16 & 2020 for Australian shares); &
-
“grizzly” bear markets where falls are a lot deeper and usually longer lived and where a year after the initial first 20% fall the market is still down (like in 1973-74, US and global shares through the tech wreck or the GFC).
I first saw the terms “gummy bear” and “grizzly bear” applied by stockbroker Credit Suisse several years ago and find them to be a good way to conceptualise bear markets. Grizzly bears maul investors but gummy bears eventually leave a nicer taste (like the lollies). As we pointed out a couple of weeks ago in “Share market falls – seven things for investors to keep in mind”, corrections are quite normal and healthy as they enable the sharemarket to let off steam and not get too overheated. Excluding the present episode, since 2011 there have been roughly seven corrections and three gummy bear markets (2011, 2015-16 and 2020) in Australian shares.
The next table shows bear markets in Australian shares since 1900. The first column shows bear markets, the second shows the duration of their falls and the third shows the size of the falls. The fourth shows the percentage change in share prices 12 months after the initial 20% decline. The fifth shows whether they are associated with a recession in the US and/or Australia. The final column shows the 1-year rebound from the low.
Bear markets in Australian shares since 1900
|
Bear markets in Aust shares |
Mths |
% fall |
% chge 12 mths after -20% |
Recession Aust, US or both |
1 yr gain from low, % |
|
Jun 14-Dec 16 |
30 |
-22 |
11 |
Yes |
10 |
|
Jul 29-Aug 31 |
25 |
-46 |
-30 |
Yes |
33 |
|
Mar 37-Apr 42 |
61 |
-32 |
7 |
Yes |
30 |
|
May 51-Dec 52 |
19 |
-34 |
-13 |
No |
8 |
|
Sep 60-Nov 60 |
2 |
-23 |
5 |
Yes |
12 |
|
Feb 64-Jun 65 |
16 |
-20 |
8 |
No |
9 |
|
Jan 70-Nov 71 |
22 |
-39 |
-3 |
Yes |
52 |
|
Jan 73-Sep 74 |
20 |
-59 |
-38 |
Yes |
51 |
|
Aug 76-Nov 76 |
3 |
-23 |
8 |
No |
5 |
|
Nov 80-Jul 82 |
20 |
-41 |
-13 |
Yes |
39 |
|
Sep 87-Nov 87 |
2 |
-50 |
3 |
No |
35 |
|
Aug 89-Jan 91 |
17 |
-32 |
10 |
Yes |
39 |
|
Aug 91-Nov 92 |
15 |
-20 |
54 |
No |
54 |
|
Feb 94-Feb 95 |
12 |
-22 |
16 |
No |
25 |
|
Mar 02-Mar 03 |
12 |
-22 |
24 |
Yes |
27 |
|
Nov 07-Mar 09 |
16 |
-55 |
-38 |
Yes |
55 |
|
Apr 11-Sep 11 |
5 |
-22 |
10 |
No |
12 |
|
Apr 15-Feb 16 |
10 |
-20 |
19 |
No |
19 |
|
Feb 20-Mar 20 |
2 |
-37 |
20 |
Yes |
53 |
|
Avg from 1900 |
16 |
-33 |
3 |
NA |
30 |
|
Avg gummy bear |
14 |
-27 |
15 |
NA |
25 |
|
Avg grizzly bear |
20 |
-46 |
-23 |
NA |
40 |
Based on the All Ords, excepting the ASX 200 for 2015-16. I have defined a bear market as a 20% or greater fall in shares that is not fully reversed within 12 months. Source: ASX, Bloomberg, AMP
If a gummy bear market is defined by a 20% decline after which the market is higher 12 months later, whereas a grizzly bear market sees a continuing decline over the subsequent 12 months after the first 20% decline, then since 1900 there have been 13 gummy bears (highlighted in black). That leaves six grizzly bear markets (in red). Several points stand out:
-
First, the gummy bear markets tend to be a bit shorter and usually see much smaller declines averaging 27% compared to 46% for the grizzly bear markets.
-
Second, the average change over 12 months after the initial 20% fall is 15% for the gummy bear markets, but it’s a 23% decline for the grizzly bear markets.
-
Third, the grizzly bear markets invariably go with recessions, whereas the gummy bear markets tend not to be. Five of the six grizzly bear markets saw a US and/or Australian recession whereas less than half of the gummy bears did.
-
Fourth, after the low the share market rebounds sharply. This makes it hard to time, as by the time investors get back in the market is often above where they sold.
US share market falls are also much deeper and longer when there is a recession and, of course, moves in US shares have a significant influence on the Australian share market. The next table shows US share market falls greater than 10% since the 1970s. The first column shows the period of the fall, the second shows the decline in months, the third shows the percentage decline from top to bottom, the fourth shows whether the decline was associated with US recession or not and the fifth shows the gains in the share market one year after the low. Falls associated with recessions are highlighted in red.
Falls in US shares greater than 10% since the 1970s
|
Share mkt fall |
Mths |
% fall top to bottom |
Recession |
1 yr gain from low, % |
|
Nov 68-May 70 |
18 |
-36 |
Yes |
44 |
|
Apr 71-Nov 71 |
7 |
-14 |
No |
30 |
|
Jan 73-Oct 74 |
21 |
-48 |
Yes |
38 |
|
Sep 76-Mar 78 |
18 |
-19 |
No |
13 |
|
Sep 78-Nov 78 |
2 |
-14 |
No |
12 |
|
Oct 79-Nov 79 |
1 |
-10 |
No |
29 |
|
Feb 80-Mar 80 |
2 |
-17 |
Yes |
37 |
|
Nov 80-Aug 82 |
20 |
-27 |
Yes |
58 |
|
Oct 83-Jul 84 |
9 |
-14 |
No |
30 |
|
Aug 87-Dec 87 |
3 |
-34 |
No |
21 |
|
Sep 89-Jan 90 |
4 |
-10 |
No |
5 |
|
Jul 90-Oct 90 |
3 |
-20 |
Yes |
29 |
|
Oct 97-Oct 97 |
1 |
-11 |
No |
21 |
|
Jul 98-Aug 98 |
2 |
-19 |
No |
38 |
|
Jul 99-Oct 99 |
3 |
-12 |
No |
10 |
|
Mar 00-Oct 02 |
31 |
-49 |
Yes |
34 |
|
Oct 07-Mar 09 |
17 |
-57 |
Yes |
69 |
|
Apr 10-Jul 10 |
3 |
-16 |
No |
31 |
|
Apr 11-Oct 11 |
6 |
-19 |
No |
32 |
|
Apr 12-Jun 12 |
2 |
-10 |
No |
26 |
|
May 15-Feb 16 |
9 |
-14 |
No |
27 |
|
Jan 18-Feb 18 |
1 |
-10 |
No |
15 |
|
Sep 18-Dec 18 |
3 |
-20 |
No |
37 |
|
Feb 20-Mar 20 |
2 |
-34 |
Yes |
75 |
|
Average |
8 |
-22 |
NA |
32 |
|
Avg with recessions |
14 |
-36 |
NA |
48 |
Falls associated with recessions are in red. Source: Bloomberg, AMP
Again, several points stand out:
-
First, US share market falls associated with recessions tend to be longer and deeper than those without a recession.
-
Second, after the low the US share market rebounds sharply, particularly after falls associated with recession.
So, whether a recession is imminent, particularly in the US, is critical in terms of whether we will see a major bear market.
Is recession likely?
Our assessment is that, short of an external shock – a Russian invasion of Ukraine driving much higher European gas prices or a more deadly covid wave are the main risks here – a US, global and/or Australian recession is not imminent. Short term forecasting is fraught with difficulty, but right now, while inflation and worries about monetary tightening are concerning, it seems premature to expect a recession:
-
While new coronavirus cases exploded with Omicron, serious illness did not as vaccines and new treatments provided protection and the Omicron variants have been less harmful than prior variants. And the latest wave has had far less damaging economic impact. While the risk remains high, coronavirus could finally be moving from a pandemic to being endemic.
-
Excess savings of around $US2.3trn in the US and $250bn in Australia will provide an ongoing boost to spending.
-
While central banks will tighten monetary policy by more than previously expected, interest rates will still be very low.
-
It’s usually only when monetary policy is tight that it ends the economic cycle & the bull market and that’s a fair way off.
-
Rate hikes in Australia will cut into household spending power and home buyer demand but a hike to around 2% over the next 2-3 years will only push household housing debt interest payments as a share of household income back to around 2018 levels – but that’s 2-3 years away and is unlikely to push a significant number of households into debt problems as many are ahead on payments & given the 2.5% interest serviceability buffers banks apply.
Household housing interest payments v disposable income
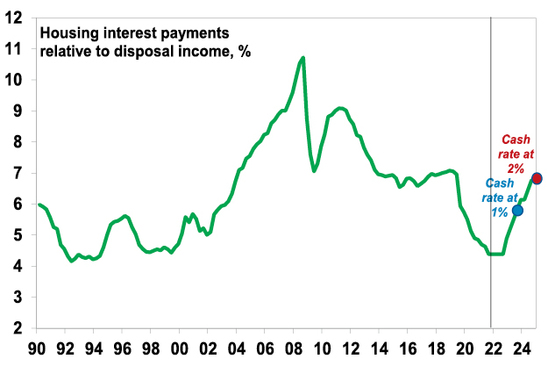
Source: RBA, Macrobond, AMP
-
While the surge in inflation is a major threat, we are likely to see some moderation in inflation this year as production increases and spending rotates from goods back to services, which may take some pressure off central banks.
-
Business surveys point to strong investment – but we are a long way from boomtime levels that precede US recessions.
No US investment boom -yet
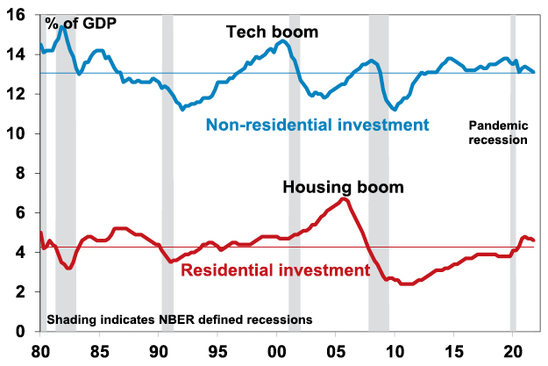
Source: NBER, Bloomberg, AMP
-
Inventories are low and will need to be rebuilt, which will provide a boost to production.
-
Positive wealth effects from the stronger than expected rise in share markets and home prices since early 2020 are still feeding through and will help boost consumer spending.
-
China is starting to ease policy, which will boost Chinese growth over the next 6 to 12 months.
Global growth is likely to slow this year but to a still strong 4.5%, with Australian growth also around 4.5%, despite the Omicron wave resulting in a brief set back in the March quarter. So, it’s unlikely the falls in shares in January are the start of a grizzly bear market. That said, shares could still fall further in the short term, before resuming the bull market.
Source: AMP Capital February 2022
Important note: While every care has been taken in the preparation of this document, AMP Capital Investors Limited (ABN 59 001 777 591, AFSL 232497) and AMP Capital Funds Management Limited (ABN 15 159 557 721, AFSL 426455) make no representations or warranties as to the accuracy or completeness of any statement in it including, without limitation, any forecasts. Past performance is not a reliable indicator of future performance. This document has been prepared for the purpose of providing general information, without taking account of any particular investor’s objectives, financial situation or needs. An investor should, before making any investment decisions, consider the appropriateness of the information in this document, and seek professional advice, having regard to the investor’s objectives, financial situation and needs. This document is solely for the use of the party to whom it is provided.
