Provision Newsletter
15 common sense tips to help manage your finances
Dr Shane Oliver – Head of Investment Strategy and Chief Economist, AMP
IntroductionA few years ago, I put together a list of key common-sense points that may be useful in terms of borrowing to finance a home along with broader personal finance and investment decisions we make. Given the surge in interest rates lately, I thought it was worth an update
Read MoreDr Shane Oliver – Head of Investment Strategy and Chief Economist, AMP
Introduction
A few years ago, I put together a list of key common-sense points that may be useful in terms of borrowing to finance a home along with broader personal finance and investment decisions we make. Given the surge in interest rates lately, I thought it was worth an update so here they are. Many Australians may know these, but unfortunately financial literacy is still not taught in schools and so many don’t. Otherwise, Australians would have far less trouble with their finances. I have deliberately kept it simple and in many cases this draws on personal experience. I won’t tell you to have a budget though because that’s like telling you to suck eggs!

1. Shop around
We often shop around to get the best deal when it comes to consumer items but the same should always apply to services we get. It’s a highly competitive world out there and service companies want to get and keep your business. So when getting a new service – whether it be for a power contract, phone plan, insurance or mortgage, or who to manage your super etc it makes sense to look around to find the best deal. And when it comes time to renew a service – say your home and contents insurance – and you find that the annual charge has risen sharply, it makes sense to call your provider to ask what gives. I have often done this to then be offered a better deal on the grounds that I am a long-term loyal customer.
2. Don’t take on too much debt
Debt is great, up to a point. It helps you have today what you would otherwise have to wait until tomorrow for. It enables you to spread the costs associated with long term assets like a home over the years you get the benefit of it, and it enables you to enhance your underlying investment returns. But as with everything you can have too much of a good thing – and that includes debt. Someone wise once said “it’s not what you own that will send you bust but what you owe.” So always make sure that you don’t take on so much debt that it may force you to sell all your investments just at the time you should be adding to them or worse still potentially send you bust. Or to sell your house when it has fallen in value. A rough guide may be that when debt servicing costs exceed 30% of your income then maybe you have too much debt – but it depends on the level of your income and expenses. A higher income person could manage a higher debt servicing to income ratio simply because living expenses take up less of their income.
3. Allow that interest rates go up and down
Of course, we have been given a rather rude reminder that interest rates can go up over the last year. But when things are going one way for a long time as interest rates did when they fell from 2011 to 2020, it’s easy to forget that the cycle could turn. So, when you take on debt the key is to make sure you can afford higher interest payments at some point. Fortunately, under guidance from the bank regulator, APRA, lenders these days have to allow that you can service your debt when interest rates are an extra 3% above the proposed borrowing rate. Of course, after 12 rate hikes in quick succession which has taken interest rates back to levels last seen in 2012 the odds are we are now getting close to the peak in interest rates so some relief may be on the way next year.
4. Contact your bank if struggling with a mortgage
After the biggest surge in interest rates since the late 1980s, it’s understandable many may be worried about servicing their mortgage. A survey by AMP Bank found that nearly 70% of those with a mortgage are worried about meeting repayments if rates continue to rise with 31% worried right now, but that most of those with small safety buffers had not sought help from their lender. However, homeowners struggling with a mortgage should not be shy in seeking assistance either to get a lower interest rate or maybe to switch to a different mortgage repayment arrangement. The home mortgage market is highly competitive and it’s not in banks’ interest to see people default on their loans.
5. Seek advice regarding fixed versus variable rates
Australians have long struggled regarding how best to use fixed rates – often locking in at the top of the rate cycle & then staying variable at the bottom. Thankfully this recent cycle was different with a record 40% of mortgages locking in record low fixed rates around 2% in 2020-21. But still many didn’t. Sure, the fixers were only protected for two or three years but still they would have done better than those who stayed variable. As a general principle locking in low fixed rates makes sense when the rate cycle has gone down but staying variable when rates have gone up. Of course, it’s still hard to time it – eg, locking in fixed rates around 4% in 2016 after five years of rate falls would have been premature and there is always a case to maintain some flexibility by keeping a portion of the loan variable to allow for windfalls (like say an inheritance or a big bonus) that enable you to pay down your loan faster. The key is to seek advice.
6. Allow for rainy days
Because the future is uncertain it always makes sense to have a financial buffer to cover us if things unexpectedly go badly. The rainy day could come as a result of higher interest rates, job loss or an unexpected expense. This basically means not taking all the debt offered to you, trying to stay ahead of your payments and making sure that when you draw down your loan you can withstand at least a 3% rise in interest rates.
7. Credit cards are great, but they deserve respect
I love my credit cards. They provide free credit for up to around 6 weeks and they attract points that really mount up. So, it makes sense to put as much of my expenses as I can on them. But they charge usurious interest rates of around 20% if I get a cash advance or don’t pay the full balance by the due date. So never get a cash advance unless it’s an emergency and always pay by the due date. Sure the 20% rate sounds like a rip-off but don’t forget that credit card debt is not secured by your house and at least the high rate provides that extra incentive to pay by the due date.
8. Use your mortgage for longer term debt
Credit cards are not for long term debt, but your mortgage is. And partly because it’s secured by your house, mortgage rates are low compared to other borrowing rates. So, if you have any debt that may take longer than the due date on your credit card to pay off then it should be included as part of your mortgage if you have one.
9. Start saving and investing early
If you want to build your wealth to get a deposit for a house or save for retirement the best way to do that is to take advantage of compound interest – where returns build on returns. Obviously, this works best with assets that provide high returns on average over long periods. But to make the most of it you have to start as early as possible. Which is why those piggy banks that banks periodically hand out to children have such merit in getting us into the habit of saving early. This gives me another opportunity to show my favourite chart on investing which tracks the value of $1 invested in Australian shares, bonds and cash since 1900 with dividends and interest reinvested along the way. Cash is safe but has low returns and that $1 will have only grown to $249. Shares are volatile (and so have rough periods highlighted by arrows) but if you can look through that they will grow your wealth and that $1 will have grown to $787,535.
Shares versus bonds & cash over very long term – Australia.jpg)
Source: ASX, Bloomberg, RBA, AMP
10. Plan for asset prices to go through rough patches
It’s well known that the share market goes through rough patches. The volatility seen in the share market is the price we pay for higher returns than most other asset classes over the long term. And while property prices will always be smoother than share prices because it’s not traded daily and so not as subject to very short-term sentiment swings, history tells us that home prices do go down as well as up. Japanese property prices fell for almost two decades after the 1980s bubble years, US and some European countries’ property values fell sharply in the GFC and the Australian residential property market has seen several episodes of falls over recent years. So, the key is to allow that asset prices don’t always go up – even when the population and the economy are growing.
11. See big financial events in their long-term context
Hearing that $70bn was wiped off the share market in a day or two sounds scary – but it tells you little about how much the market actually fell and you have only lost something if you sell out after the fall. Scarier was the roughly 35% fall in share markets in February-March 2020 due to the pandemic and scarier still the GFC that saw 50% falls. But such events happen every so often – the 1987 crash saw a 50% fall in a few months and Australian shares fell 59% over 1973-74. And after each the market has gone back up and resumed its long-term rising trend. The trick is to allow for periodic sharp falls in your investments and when they happen remind yourself that we have seen it all before and the market will most likely find a base and resume its long-term rising trend.
12. Know your risk tolerance
When embarking on your investing journey, it’s worth thinking about how you might respond if you found out that market movements had just wiped 20% off your investments. If your response is likely to be: “I don’t like it, but this sometimes happens in markets and history tells me that if I stick to my strategy, I will see a recovery in time” then no problem. But if your response might be: “I can’t sleep at night because of this, get me out of here” then maybe you should rethink your strategy as you will just end up selling at market bottoms and buying at tops. So, try and match your investment strategy to your risk tolerance.
13. Make the most of the Mum and Dad bank
The Australian housing boom that started in the mid-1990s has left housing very unaffordable for many. This has contributed to a big wealth transfer from Millennials to Baby Boomers and Gen Xers. For Millennials and Gen Z, if you can it makes sense to make the most of the “Mum and Dad bank”. There are two ways to do this. First stay at home with Mum and Dad as long as you can and use the cheap rent to get a foothold in the property market via a property investment and then use the benefits of being able to deduct interest costs from your income to reduce your tax bill to pay down your debt as quickly as you can so that you may be able to ultimately buy something you really want. Second consider leaning on your parents for help with a deposit. Just don’t tell my kids this!
14. Be wary of what you hear at parties
Back in 2021, Bitcoin was all the rage. But jumping in when it was near $US68,000 a coin at the point when everyone was talking about it back then would not have been wise – it’s now around $US30,000 but had a fall to below $US16,000 on the way and its yet to prove its use value, beyond something to speculate in. Often when the crowd is dead set on some investment it’s best to stay away, particularly if you don’t understand it.
15. There is no free lunch
When it comes to borrowing and investing there is no free lunch – if something looks too good to be true (whether it’s ultra-low fees or interest rates or investment products claiming ultra-high returns and low risk) then it probably is and it’s best to stay away.
Concluding comment
I have focussed here mainly on personal finance and investing at a very high level, as opposed to drilling into things like diversification and taking a long-term view to your investments. An earlier note entitled “Nine keys to successful investing” focussed in more detail on investing.
Source: AMP Capital July 2023
Important note: While every care has been taken in the preparation of this document, AMP Capital Investors Limited (ABN 59 001 777 591, AFSL 232497) and AMP Capital Funds Management Limited (ABN 15 159 557 721, AFSL 426455) make no representations or warranties as to the accuracy or completeness of any statement in it including, without limitation, any forecasts. Past performance is not a reliable indicator of future performance. This document has been prepared for the purpose of providing general information, without taking account of any particular investor’s objectives, financial situation or needs. An investor should, before making any investment decisions, consider the appropriateness of the information in this document, and seek professional advice, having regard to the investor’s objectives, financial situation and needs. This document is solely for the use of the party to whom it is provided.
2022-23 saw investment returns rebound – but is it sustainable?
Dr Shane Oliver – Head of Investment Strategy and Chief Economist, AMP
Introductionhe past financial year saw a solid rebound in investment returns, after the negative returns of the 2021-22 financial year. This note reviews the past 12 months in investment markets and looks at the outlook.
Inflation worries start to recedeJust as worries about inflation, recession and geopolitics drove poor returns
Read MoreDr Shane Oliver – Head of Investment Strategy and Chief Economist, AMP

Introduction
he past financial year saw a solid rebound in investment returns, after the negative returns of the 2021-22 financial year. This note reviews the past 12 months in investment markets and looks at the outlook.
Inflation worries start to recede
Just as worries about inflation, recession and geopolitics drove poor returns in 2021-22, a relaxation of worries about these things drove a strong rebound in returns over the last financial year:
-
While inflation rose to its highest in decades in 2022, it peaked in the US a year ago and has been trending down since with other countries following suit. Australia, which lagged on the way up, is doing the same on the way down. This reflects improved goods supply, lower commodity prices, lower transport costs and easing demand.
Global Inflation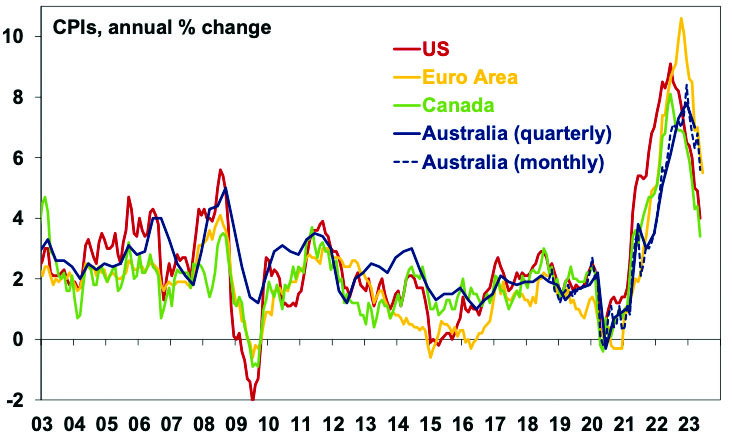
Source: Bloomberg, AMP
-
While central banks still worry about sticky services inflation in the face of stronger wages growth, signs of cooling economic growth and slowing job openings have started to ease concerns on this front.
-
This slowing in inflation has seen central banks slow the pace of rate hikes and provide confidence that they are near the top on rates.
-
While the Eurozone entered a mild recession, global growth generally has held up better than feared with recession expectations getting pushed out. This in turn has supported profits.
-
China reopened allowing its economy to bounce back – although so far, it’s been a bit weaker than expected in terms of manufacturing.
-
Worst case fears regarding the war in Ukraine have not come to pass – with no escalation to NATO countries and Europe/Germany managing to move on from its reliance on Russian gas.
-
Geopolitical tensions with China have got no worse with periodic talk of a thaw. This has occurred with China-Australian relations with the roll back by China of some restrictions on Australian exports.
-
Enthusiasm for AI and its potential to boost productivity following the release of ChatGPT in late 2022 provided a boost for tech stocks.
Returns rebound
The net result has been a rebound in investment returns over the last financial year for most listed assets as can be seen in the next chart.
2022-23 – major asset class returns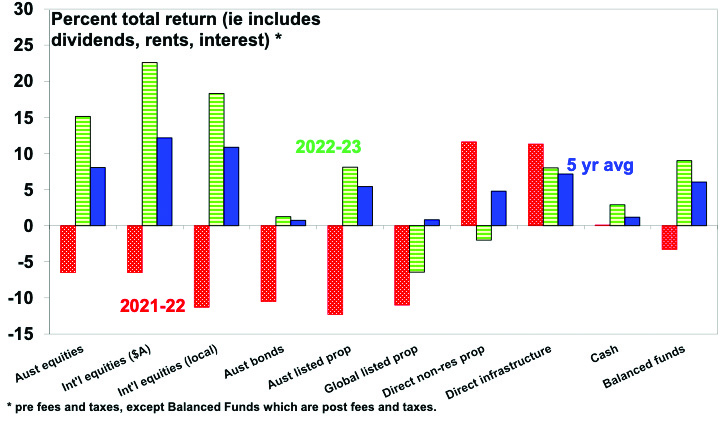
Source: Bloomberg, AMP
After seeing their worst loss in decades in 2021-22 as bond yields surged resulting in big capital losses, bond returns have stabilised over the last 12 months as bond yields stopped rising with higher yields helping.
Returns from Australian bonds over rolling 12 month periods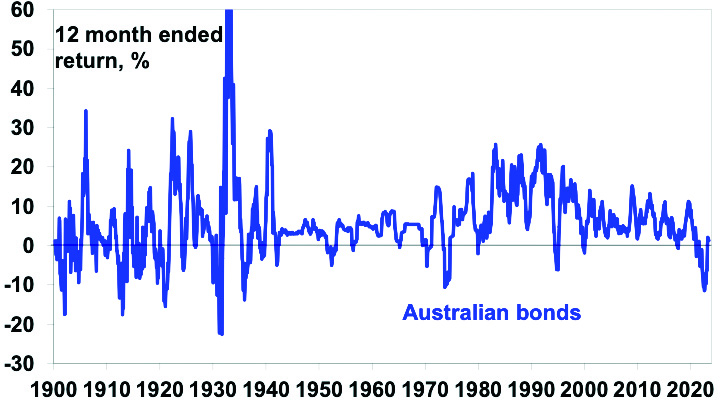
Source: Bloomberg, RBA, AMP
Global shares returned 18% in local currency terms over 2022-23, with a fall in the $A (with lower commodity prices) boosting this to 23% in $A terms. Japanese & Eurozone shares outperformed, US shares benefitted from a rebound in tech stocks (helped by AI) & Chinese shares fell.
Australian shares returned 15%, benefitting from the positive global lead but were relative underperformers over the last six months as the RBA turned relatively more hawkish than had been expected driving worries about an Australian recession and with concerns about the strength of China’s recovery weighing on commodity prices and resources stocks.
Australian real estate investment trusts benefitted from better valuations & a stabilisation in bond yields but global REITs remained under pressure.
Unlisted commercial property returns look to have been negative as the lagged negative impact of higher bond yields and reduced space demand for office and retail property weighed on capital values.
Australian residential property prices fell 5.3%, reflecting a sharp fall in the second half of 2022 as higher mortgage rates hit but saw some recovery in the last 4 months as immigration rebounded and supply fell.
Combined, this drove an estimated 9% return in balanced growth superannuation funds. This is a big turnaround from the 3.5% or so loss from such funds in the previous financial year.
Balanced/growth superannuation fund returns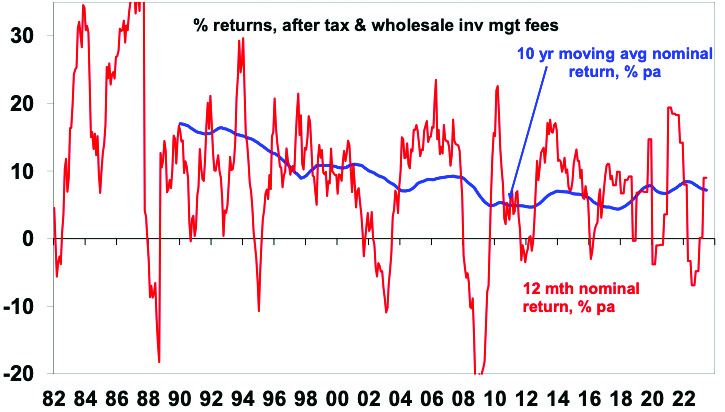
Source: AMP
The last few financial years has seen a bit of a zig-zag pattern in returns with average super funds seeing losses in 2019-20 (as the pandemic hit), very strong returns in 2020-21 (as markets rebounded), a loss in 2021-22 (as inflation and bond yields surged) and now a rebound. Given the volatility it’s best to focus on their longer-term average returns which have been 7.2% pa over the last decade or around 4.5% pa after inflation.
Some lessons from 2022-23
The big lesson of 2021-22 was that inflation was not dead, just resting, and can raise its head to cause mayhem when the circumstances are right. But there were two big lessons over the last year. The first was that just as easy money was a major contributor to inflation in 2021-22 the move to tight money looks to be working to bring inflation back under control again albeit there is a way to go yet. The second was yet another reminder of just how hard it is to time markets. Just when everyone was most gloomy about inflation and interest rates, share markets rebounded.
Shares at risk of a correction
The bad news is that the risk of a near correction in shares is high. Shares had strong gains in June and are now overbought technically. Leading economic indicators continue to point to a high risk of recession in the US and the risk of recession in Australia is now around 50%. China’s recovery is looking less robust than expected and policy stimulus there so far has been pretty modest. Central banks are probably close to the top, but they remain hawkish with a high risk of going too far. Risks also remain in relation to Ukraine – particularly with Putin looking to re-establish his authority after the Wagner mutiny in Russia. And while the month of July is often good for shares (particularly in Australian shares after June tax loss selling is reversed) the period to September-October is often rough.
Unlisted property returns are also likely to be negative over the year ahead as weak economic activity and the adjustment to working from home result in rising office property vacancy rates and more downwards pressure on property values.
The good news
Fortunately, inflation rates are already falling without recession and our US Pipeline Inflation Indicator points to a further fall in inflation ahead.
AMP Pipeline Inflation Indicator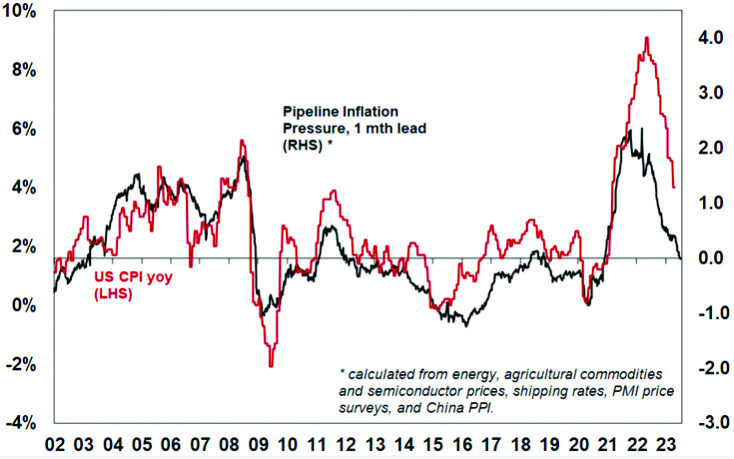
The Inflation Pipeline Indicator is based on commodity prices, shipping rates and PMI price components. Source: Bloomberg, AMP
This should enable central banks to start easing monetary policy through next year in order to at least avoid a deep recession. In Australia, we expect the RBA’s cash rate to peak around 4.6% with four rate cuts through 2024. Moreover, global economic conditions have proven more resilient than investors feared, the rebound in US shares from their lows last year has broadened out to include more cyclical stocks (which is a positive sign) and investor positioning is still relatively cautious (which is arguably positive from a contrarian perspective).
So, while shares are vulnerable to a near term correction, returns over the next 12 months should still be reasonable albeit slower than they have been over the last 12 months. At the same time bond returns should be positive as bond yields settle down with falling inflation.
Overall balanced growth super returns are likely to be reasonable – but more like 6 to 7% than the 9% or so seen over the last financial year.
Things for investors to keep in mind
Of course, short term forecasting and market timing is fraught with difficulty and it’s best to stick to sound long term investment principles. Several things are always worth keeping in mind: periodic and often sharp setbacks in shares are normal; selling shares or switching to a more conservative superannuation strategy after falls just turns a paper loss into a real loss; when shares and other investments fall in value they are cheaper and offer higher long term return prospects; Australian shares still offer an attractive dividend yield versus bank deposits; shares and other assets invariably bottom when most investors are bearish; and during periods of uncertainty, when negative news reaches fever pitch, it makes sense to turn down the noise around investment markets in order to stick to an appropriate long term investment strategy.
Source: AMP Capital July 2023
Important note: While every care has been taken in the preparation of this document, AMP Capital Investors Limited (ABN 59 001 777 591, AFSL 232497) and AMP Capital Funds Management Limited (ABN 15 159 557 721, AFSL 426455) make no representations or warranties as to the accuracy or completeness of any statement in it including, without limitation, any forecasts. Past performance is not a reliable indicator of future performance. This document has been prepared for the purpose of providing general information, without taking account of any particular investor’s objectives, financial situation or needs. An investor should, before making any investment decisions, consider the appropriateness of the information in this document, and seek professional advice, having regard to the investor’s objectives, financial situation and needs. This document is solely for the use of the party to whom it is provided.
Australian recession Q&A
Dr Shane Oliver – Head of Investment Strategy and Chief Economist, AMP
IntroductionThe past few weeks have seen lots of talk again about a recession – particularly in Australia. This has been a recurring theme over the last year or so but has intensified lately. But what’s driving it?
Read MoreWhy the worry? What’s the risk? And what would it mean for investors?
Dr Shane Oliver – Head of Investment Strategy and Chief Economist, AMP
Introduction
The past few weeks have seen lots of talk again about a recession – particularly in Australia. This has been a recurring theme over the last year or so but has intensified lately. But what’s driving it? How serious is the risk of recession? And what would it mean for Australians and investors?

But first what is a recession?
A recession is generally defined as a contraction in the level of economic activity. In some countries it’s technically defined as two or more quarters in a row of falling economic activity as measured by GDP but this measure can have its failings, e.g. if GDP falls 1% in one quarter, rises 0.1% the next next and then falls 1% it wouldn’t meet the technical definition of a recession but most would agree that it is. So, some like the US adopt a wider definition based around a period of contraction as measured by GDP and a range of other economic indicators including industrial production, income and employment.
Because Australia has strong population growth there been a focus on “per capita recession” which is where the economy still grows but at a lower rate than the population so GDP per person goes backwards. This is arguably more relevant for individual living standards. GDP per capita has already contracted in the March quarter and most, including the RBA and the Government, are forecasting at least a per capita recession.
Why the concern now?
The concern about recession has been rising with central bank interest rate hikes. The rise in interest rates is aimed at slowing inflation by slowing demand and hence economic activity. It does this by:
-
increasing debt servicing costs for households (particularly those with mortgages) and businesses with debt, which reduces spending power;
-
raising the cost of future borrowing which slows down how building and business investment;
-
lowering asset values – for say shares and property – which results in less spending as people feel poorer via the “wealth effect”; and
-
by pushing the currency higher than otherwise making it cheaper to bring in imports and reducing demand for exports.
Because central banks never know when they have raised interest rates enough to control inflation they often go too far – pushing the economy into recession. This was the case prior to recessions in Australia in the early 1980s and 1990s and in the US in the early 2000s and 2008.
We have been off the view that easing global inflationary pressures – as evident in improving supply and falling price pressures in various business surveys, etc – would have enabled central banks to have stopped raising interest rates by now. But central banks have gone further than we thought and remain hawkish. This includes the RBA which following signs of increasing upside risks to wages growth – particularly the higher than expected increase in minimum and award wages at a time of low productivity growth – appears to have become more hawkish and be giving less weight to keeping the economy on an “even keel”.
Why all the fuss about faster wages growth?
Everyone wants to see their wages grow faster than inflation. But when wages are simply chasing inflation higher as we saw in the 1970s it can lead to a wage price spiral which perpetuates high inflation as companies raise prices to maintain profits in response to stronger wages. As a result the second round response to the initial spike in inflation of catch up wage growth risks entrenching high inflation. Hence the more aggressive approach by central banks to guard against this. The Bank of England has gone down this path & the RBA appears to be doing the same.
But unemployment is low & shares are up 10% plus from 2022 lows so how can there be a recession?
It’s true the Australian economy has been remarkably resilient despite a 4%, or 400 basis points, rise in the official cash rate and a doubling or more in mortgage rates. The economy is still growing, the roads are congested, restaurants seem full, travel has surged and unemployment is just 3.6%. However, this provides little comfort.
-
Interest rate hikes normally impact with a lag of up to 12 months as its takes time for rate hikes to be passed through to borrowers, for borrowers to cut spending and for companies to cut their workforces.
-
This time around the lag is likely longer thanks to massive pandemic fiscal stimulus which left many households with much higher than normal savings balances, the release of pent-up demand with reopening, 40% of home borrowers at record low fixed mortgage rates (compared to a norm of 15%) and a highly competitive mortgage market that has blunted the flow through of rate hikes.
This lag was evident in the late 1980s and early 1990s. Despite the RBA progressively hiking rates to 18% over 1988 and 1989 the unemployment rate kept falling prompting many to argue the economy was impervious. But then in late 1989 and early 1990 the lagged impact of rate hikes hit and the economy went into deep recession with the RBA having to rapidly reverse course. It was a classic case of the economy being ok until it’s not!
RBA rate hikes & unemployment in the late 1990s/early 1990s
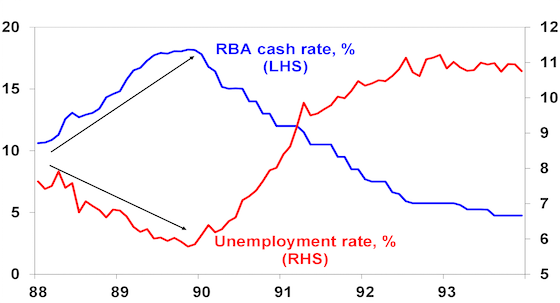
Source: AMP, ABS
Of course, things were different back then with household debt to income ratios being one third current levels and very high inflation expectations resulting in much higher interest rates – but the lags are still relevant.
The protection provided households by fixed rates is now ending with borrowers seeing rates reset to levels two or three times what they were and at some point the saving buffers and the reopening boost will have been exhausted. And we are now seeing increasing evidence rate hikes are biting with falling real retail sales, falling building approvals, slowing business investment, slowing GDP growth, more negative corporate commentary, rising insolvencies and indications of a slowing jobs market.
So what’s the risk of recession?
We have already revised our Australian GDP growth forecast down to just 0.7% for this financial year (compared to the RBA’s forecast for growth of 1.4%). But as a result of ongoing rate hikes, we see the risk of recession starting around late this year as now very high at about 50%. Consumer spending is almost certain to start going backwards later this year as the 4% plus cash rate will push debt servicing costs into record territory as a share of household income and on the RBA’s analysis 15% of households with a variable rate mortgage (about 1 million people) will be cash flow negative by year end at a 3.75% cash rate & we are now well beyond this.
The US Leading Index – which is comprised of economic indicators like building approvals that normally lead the economic cycle – has already fallen to levels normally associated with recession. In Australia through the Westpac/Melbourne Institute’s Leading Index has fallen but is not yet decisively at levels associated with recession. Which partly explains why we have put the risk of recession at 50% as opposed to more.
Australia Melbourne Institute Leading Index
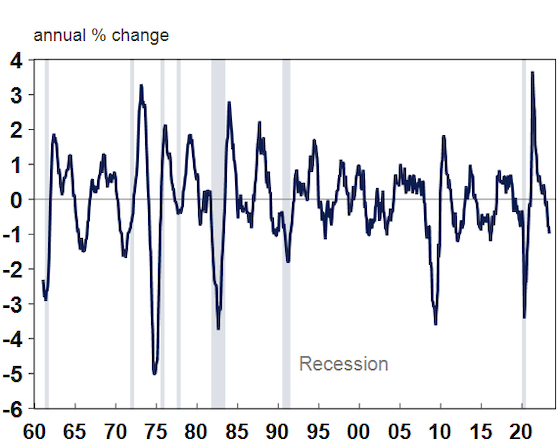
Source: Macrobond, AMP
What will recession mean for Australians?
Many Australians have had no experience of recession as the last real recession ended over 30 years ago. The pandemic slump in 2020 was due to a mandated shutdown and incomes were protected by programs like Job Keeper so it’s not much guide to any future recession. A recession normally sees higher unemployment – the early 1980s and 1990s recessions saw a roughly 5 percentage point increase, less job security, a contraction in living standards and low levels of confidence. Most will still keep their jobs but they would experience less job security and wages bargaining power and lower levels of confidence. However, recessions eventually also mean lower inflation which would help alleviate cost of living pressures. Recessions often also lead to lower levels of immigration and less household formation which could take pressure off rents and home prices although declining home building won’t help.
What would be the impact on shares?
Historically recessions in Australia and the US have tended to be associated with bear markets in shares, ie, 20% or more falls, as recessions drive a slump in company profits. The next chart shows the Australian share market and falls in it against US recessions. A modifying factor is that share markets are still 8% or so down from their 2021/early 2022 highs so the risk of recession is arguably partly still factored into markets which may limit the extent of falls if a recession does eventuate.
Equity Bear Markets and Recessions
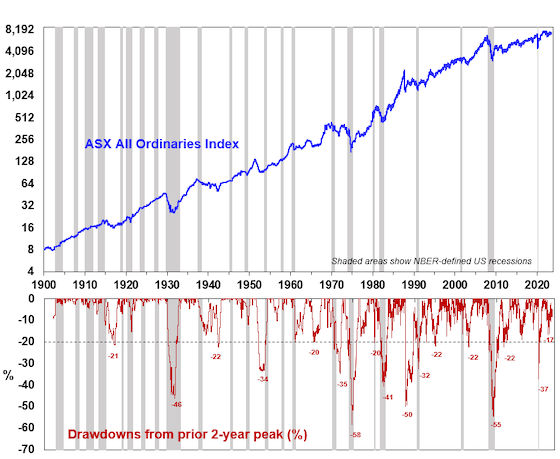
Source: ASX, Bloomberg, AMP
What would be the impact on residential property?
Australian home prices have rebounded from their lows as a severe supply shortfall has dominated rising rates. However, a recession could drive another leg down in home prices as buyers back of, higher rates and higher unemployment push up distressed selling and recession drives reduced household formation. CoreLogic data shows a 9% fall in capital city property prices in the early 1980s recession with a 25% fall in Sydney, and a 6% fall in the early 1990s recession with a 10% fall in Sydney.
What about interest rates?
Recessions invariably drive sharp falls in interest rates as the RBA will cut rates in response to falling inflation and rising unemployment. While we are allowing for two more 0.25% rate hikes from the RBA in the next few months, we expect it to cut rates four times next year.
Implications for investors
While times like these can be stressful, for superannuation members and most investors the best approach is to stick to an appropriate long term investment strategy to take advantage of the rising long-term trend in share markets given the difficulty in trying to time short term swings.
Source: AMP Capital June 2023
Important note: While every care has been taken in the preparation of this document, AMP Capital Investors Limited (ABN 59 001 777 591, AFSL 232497) and AMP Capital Funds Management Limited (ABN 15 159 557 721, AFSL 426455) make no representations or warranties as to the accuracy or completeness of any statement in it including, without limitation, any forecasts. Past performance is not a reliable indicator of future performance. This document has been prepared for the purpose of providing general information, without taking account of any particular investor’s objectives, financial situation or needs. An investor should, before making any investment decisions, consider the appropriateness of the information in this document, and seek professional advice, having regard to the investor’s objectives, financial situation and needs. This document is solely for the use of the party to whom it is provided.
Sell in May and go away? The worry list for shares (and the good news!)
Dr Shane Oliver – Head of Investment Strategy and Chief Economist, AMP
IntroductionFrom their lows last year, global and US shares are up 17% and Australian shares are up 13% as investors have been buoyed by evidence of peaking inflation, anticipation that central banks are near the top, resilient growth and profits and enthusiasm for Artificial Intelligence (AI) following the launch
Read MoreDr Shane Oliver – Head of Investment Strategy and Chief Economist, AMP
Introduction
From their lows last year, global and US shares are up 17% and Australian shares are up 13% as investors have been buoyed by evidence of peaking inflation, anticipation that central banks are near the top, resilient growth and profits and enthusiasm for Artificial Intelligence (AI) following the launch of ChatGPT late last year pushing up related stocks. This has resulted in solid year to date returns. But is it sustainable?

The worry list for shares
Recent weeks have partly been dominated by the political soap opera around the US debt ceiling. A deal has now been reached suspending the ceiling out to January 2025 with caps on spending. There is still room for setbacks in terms of getting it passed by Congress ahead of Treasury’s 5 June deadline, but odds are it will pass providing a short-term boost for shares (which looks to have been factored in) allowing shares to focus on other things. However, right now there is a still a large worry list for shares:
-
First, share market gains from last year’s lows have so far been more narrowly based favouring defensive or growth sectors (like tech) relative to cyclicals and value than would be normal at this point. In fact, so far this year AI related stocks have accounted for all of the rise in the S&P 500 with the Dow Jones index actually flat year to date.
-
Second, leading economic indicators are continuing to point to a high risk of recession in the US and elsewhere. This can be seen in yield curves and the US leading economic index is also signalling recession.
US Leading Economic Index
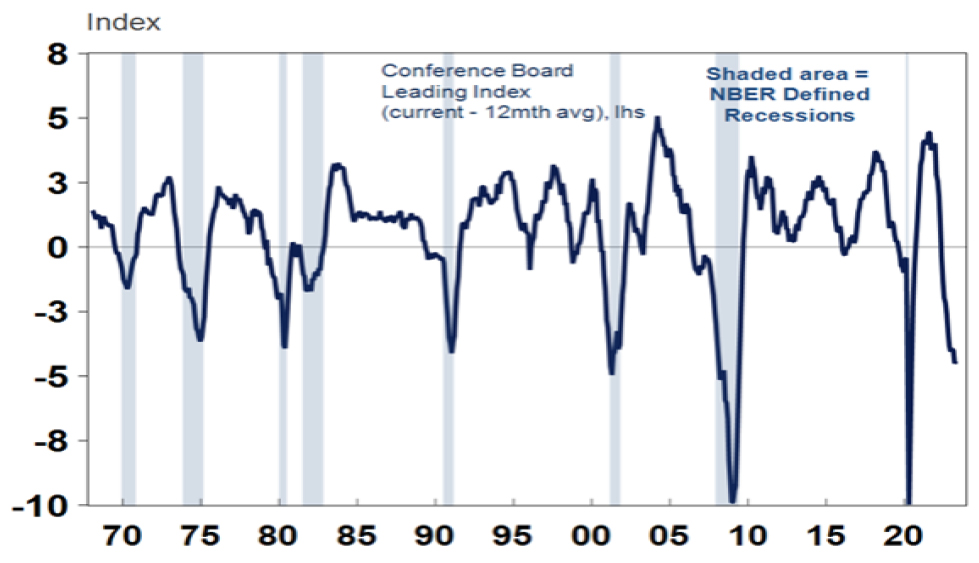
Source: Macrobond, AMP
-
Third, a recession would mean a sharp decline in company profits which is not currently expected by the consensus.
-
Fourth, the Chinese economic recovery has started to disappoint. In particular, it’s concentrated in services as opposed to manufacturing. This may mean less of an impetus for global growth.
Chinese manufacturing and services PMIs
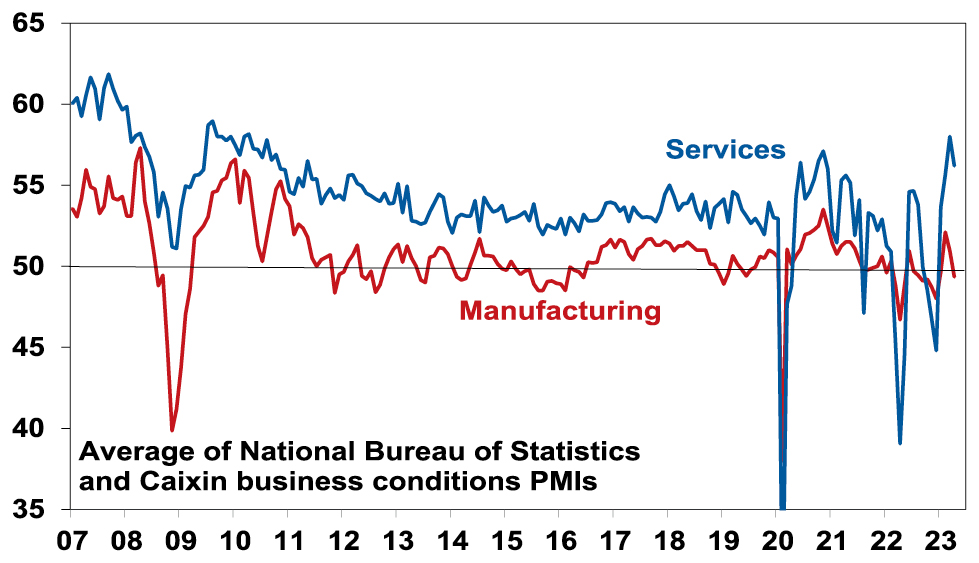
Source: Bloomberg, AMP
-
Fifth, weakness in copper, oil (despite OPEC production cuts) and other industrial commodities suggests weakening demand and this is also being reflected in the growth sensitive Australian dollar which recently broke below support at $US0.66. This is in part related to the relative weakness in manufacturing in China and partly explains the relative underperformance of the Australian share market so far this year – its up 2.5% compared to a 9% rise in global shares.
-
Sixth, US banking stress is continuing resulting in additional tightening in lending standards as other banks seek to avoid a Federal takeover.
-
Seventh, while the debt ceiling is close to resolution it will entail less spending than would otherwise have been the case (around 0.2-0.3% of GDP less) and the withdrawal of the liquidity boost the Treasury has been providing investment markets.
-
Eighth, while central banks are probably at or close to the top, they remain hawkish and risk doing more – potentially overtightening. The RBNZ (with a cash rate of 5.5%) and Bank of Canada (at 4.5%) look to have peaked. However, the ECB (3.25%) and Bank of England (4.5%) look to have further to go. Both the Fed (at 5.13% and the RBA (3.85%) are concerned about sticky inflation. We think they have done enough but their bias is towards further tightening. At this stage, the Fed is likely to pause at its June meeting but may still do more at its July meeting. In Australia, continuing hawkish commentary from the RBA with risks around wages, poor productivity growth and rising home prices (which are reversing the negative wealth effect). On wages, watch the June minimum wage decision as a 7% minimum wage rise would add around 0.45% to wages growth directly plus more indirectly due to its influencing effect and along with the 15% rise in wages for aged care workers with potential to flow on others in the hospitality industry and an acceleration public sector wages growth would likely take wages growth beyond the level consistent with the inflation target. All this means that the risk of further RBA rate hikes is very high. Further rate hikes will exacerbate the economic downswing and add to the already high risk of recession.
-
Ninth, investor sentiment leans slightly on the optimistic side which is bearish from a contrarian perspective – albeit there is no sign of euphoria and investor positioning in shares looks underweight which is positive from a contrarian perspective.
-
Finally, the period from May to September is often rough for shares albeit with a bounce along the way in July (particularly in Australia).
The seasonal pattern in US and Australian shares
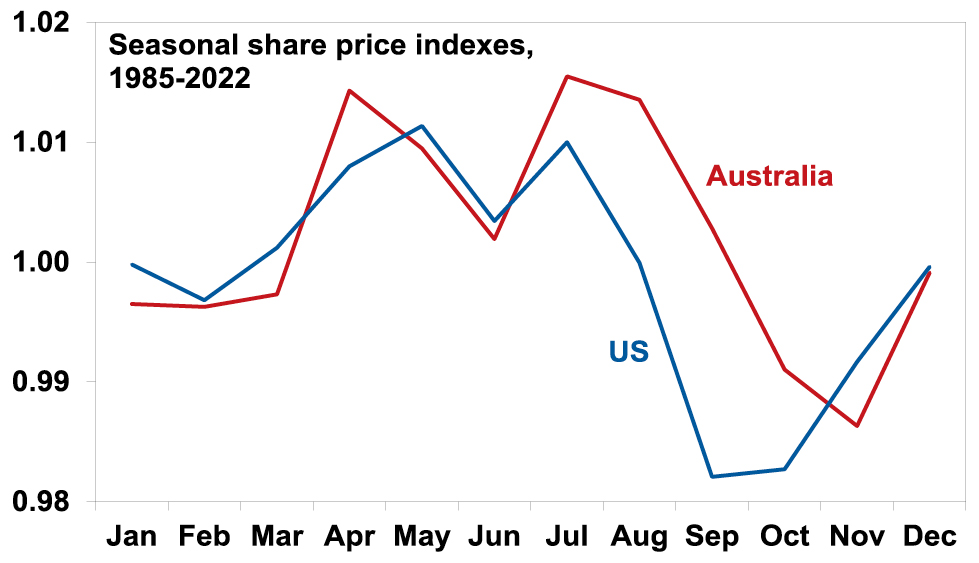
Source: Bloomberg, AMP
But it’s not all negative
However, while the worry list is long there are some positives for shares.
-
First, US and global shares are still tracing out a pattern of rising lows and highs from last October, which technically is still consistent with a bull market. (This is not the case in Australian shares though.)
-
Second, so far global economic conditions have held up far better than feared. In fact, business conditions according to purchasing manager surveys (PMIs) have improved since late last year suggesting growth will surprise on the upside. Related to this so far company profits globally have held up better than expected. The complication is that the strength may be exaggerating things as it’s being driven by services but manufacturing is weak and its normally a better guide to cyclical conditions and is warning of weaker conditions ahead.
Global Composite PMI vs World GDP
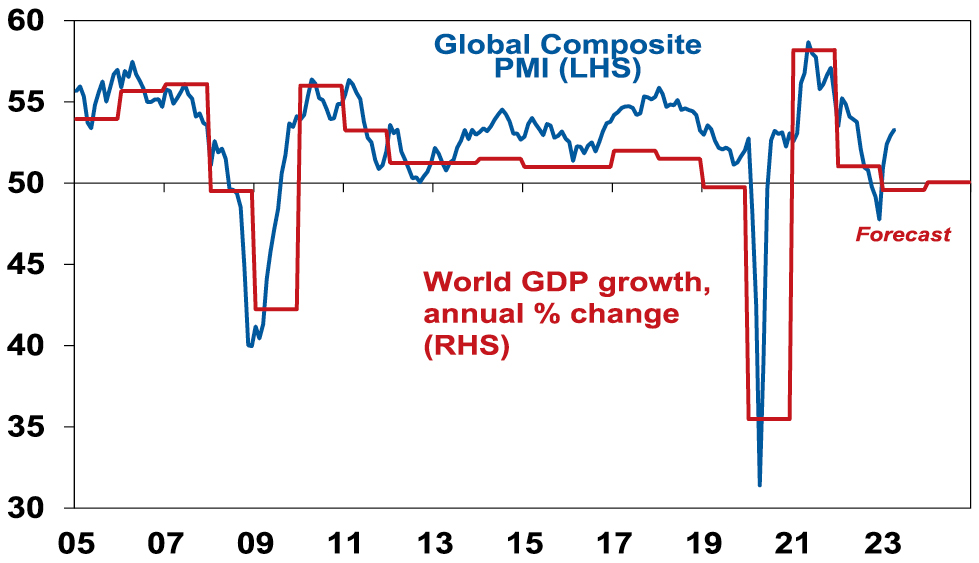
Source: Bloomberg, AMP
-
Third, inflationary pressures look to have peaked and are receding. Business conditions PMI surveys show a continuing downtrend in input and output prices (for manufacturing and services), order backlogs are well down from their 2021-22 highs and delivery times are much improved. At the same time, labour markets are gradually becoming less tight with slowing job openings.
G3 Composite PMI – Price Pressures
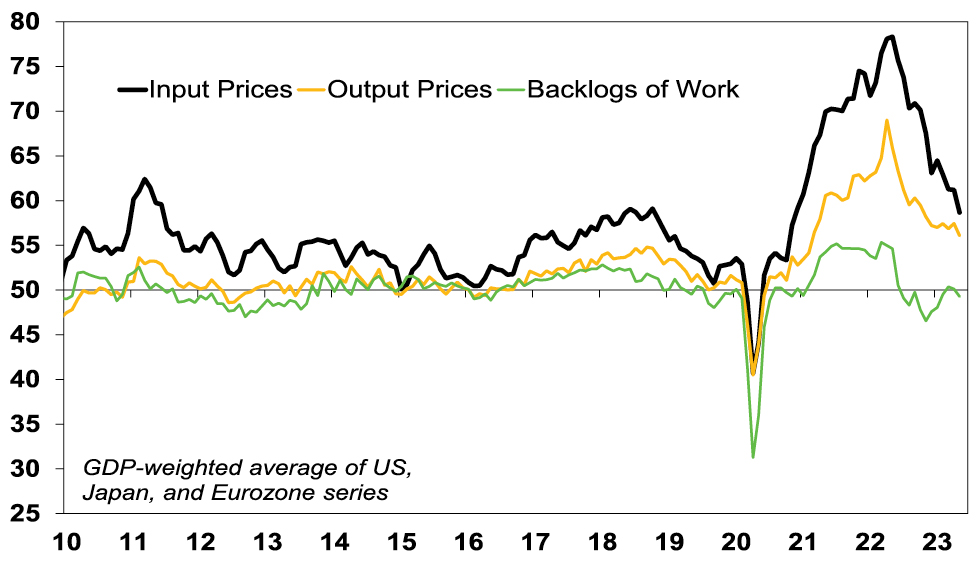
Source: Bloomberg, AMP
Reflecting this along with other indicators our Pipeline Inflation Indicators for the US and Australia have continued to fall pointing to a further decline inflation ahead. If correct this will provide scope for central banks to ease monetary policy later this year or early next.
Australia Pipeline Inflation Indicator
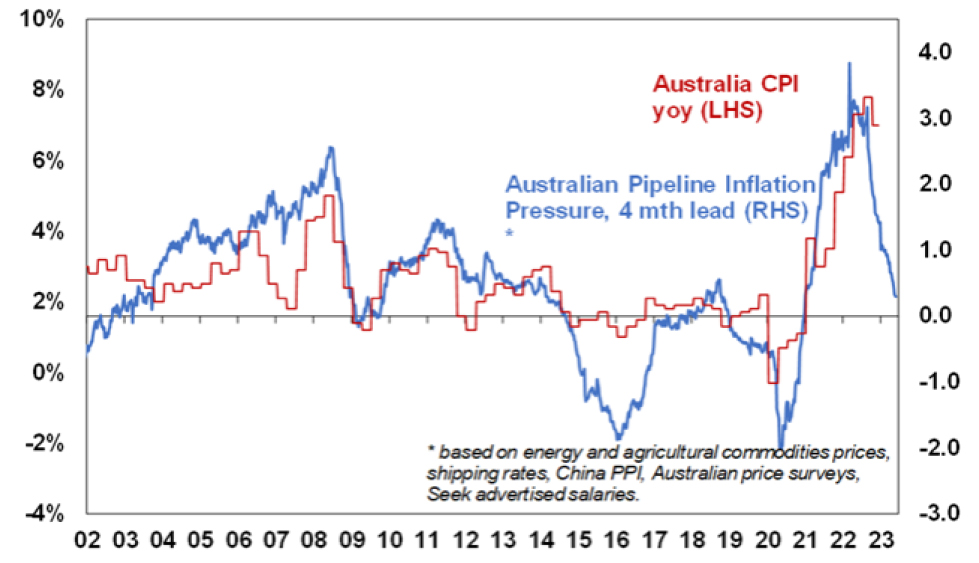
Source: Bloomberg, AMP
-
Fourth, enthusiasm for AI has the potential to push share markets higher directly in terms of IT stocks that will benefit from related demand associated with an upgrade to AI, but also via a productivity boost to high labour industries that will boost growth and profits and lower wages. Of course, as we saw with the late 1990s tech boom the benefits could take time to materialise and investor interest could get frothy setting up a short term pullback.
Implications for investors
We remain of the view that shares will do okay on a 12-month view as central banks ease as inflation cools. But given the long list of negatives, global and Australian shares are vulnerable over the next few months to a correction. There are several implications for investors:
-
Unlike last year, government bonds should provide protection for investors as bond yields have potential to fall if recession worries rise.
-
For short term investors it’s a time to be cautious.
-
However, while times like these can be stressful, for superannuation members and most investors the best approach is to stick to basic investment principles. This may sound repetitive, but these things are always worth keeping in mind:
-
Share market pullbacks are healthy and normal – their volatility is the price we pay for the higher returns they provide over the long term;
-
It’s very hard to time market moves so the key is to stick to an appropriate long-term investment strategy;
-
Selling shares after a fall locks in a loss;
-
Share pullbacks provide opportunities for investors to invest cheaply;
-
Shares invariably bottom with maximum bearishness;
-
Australian shares still offer attractive income versus bank deposits; and
-
To avoid getting thrown off a good long-term strategy, it’s best to turn down the noise around all the negative news flow.
Source: AMP Capital May 2023
Important note: While every care has been taken in the preparation of this document, AMP Capital Investors Limited (ABN 59 001 777 591, AFSL 232497) and AMP Capital Funds Management Limited (ABN 15 159 557 721, AFSL 426455) make no representations or warranties as to the accuracy or completeness of any statement in it including, without limitation, any forecasts. Past performance is not a reliable indicator of future performance. This document has been prepared for the purpose of providing general information, without taking account of any particular investor’s objectives, financial situation or needs. An investor should, before making any investment decisions, consider the appropriateness of the information in this document, and seek professional advice, having regard to the investor’s objectives, financial situation and needs. This document is solely for the use of the party to whom it is provided.
Peak Australian home ownership
Dr Shane Oliver – Head of Investment Strategy and Chief Economist, AMP
Australia’s property fascinationAustralians have long had a fascination with property. It’s evident in waves of speculative booms and busts that periodically grip our cities. For example, this was observed over four decades ago in relation to Sydney and documented by M.T.
Read More– rising prosperity (and smashed avocado) versus housing affordability
Dr Shane Oliver – Head of Investment Strategy and Chief Economist, AMP

Australia’s property fascination
Australians have long had a fascination with property. It’s evident in waves of speculative booms and busts that periodically grip our cities. For example, this was observed over four decades ago in relation to Sydney and documented by M.T. Daly in his book ‘Sydney Boom Sydney Bust’ which was published way back in 1982:
“City land booms have always been a snare of the people of the Australian colonies” and “despite various efforts of governments, the [Sydney real estate] system seems to have run out of control and the inflated values have become institutionalised”.
Since then, of course the fascination has arguably grown more intense facilitated by more ready access to data on the property market. But it’s also historically evident in relatively high levels of home ownership in Australia, particularly in the post-World War Two period. Since the mid-1960s, though, the home ownership rate has declined as documented in a fascinating report by the well-known demographer Bernard Salt together with AMP entitled ‘What wealthy means to Australians in 2023’.
Peak home ownership
In my view, the most interesting chart in the report is that of home ownership based on ABS Census data dating back to 1911 that Bernard Salt and his team discovered peaked around 1966. Just before World War One, Australia’s home ownership rate was just below 50%, but from even this relatively high rate it surged in the post-World War Two years to reach a peak of 73% in 1966 as home ownership was seen as delivering financial security after the malaise of the Great Depression and World War Two. As the report notes, at the time it was all about “getting married, having kids, buying a house and holding a steady job”. Retirement planning was rarely on the radar with life expectancy at around 70 in the late 1950s and early 1960s. In the aftermath of the Depression and World War Two, the concept of wealth was seen as tied up to owning a home. However, from the peak in 1966, housing affordability has trended down to now being around 63%. The question is whether this decline reflects deteriorating housing affordability flowing from years of property booms, leading to a fading in the “Aussie dream” which is centred on home ownership or whether it’s something deeper.
Australian home ownership rate, 1911-2021
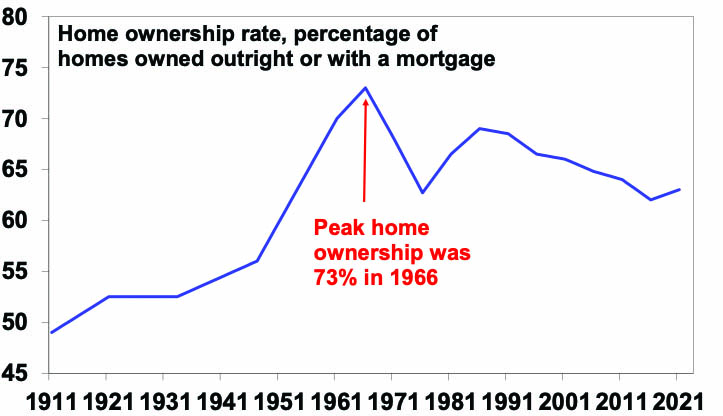
Source: ABS Censuses, Bernard Salt/The Demographics Group, AMP
A lot has happened since 1966
The natural inclination is to think that the fall in the home ownership rate is all due to worsening affordability. However, the Australia of today is radically different to that of 1966 and this has surely had a big impact as the report points out.
-
More years spent in education, people starting work further into their twenties, the increasing importance of career, rising female participation in the workforce, and a desire for more experiences and travel have all seen family formation pushed into the late twenties.
-
Starting with the baby boomers, subsequent generations have not felt the same need for the security offered by home ownership that their forebears felt in the mid-1960s. This partly flowed from dimming memories of the travails of the Great Depression and World War Two, rising levels of economic prosperity, greater choices for spending with the growth of travel and the café culture (Bernard Salt’s “smashed avocado on five grain toast”) and a perception, based on seeing their parents experience, that owning a home is not necessarily the way to happiness.
-
Related to this, there is an element of Maslow’s “hierarchy of needs” at work here. In Maslow’s hierarchy the first set of needs is physiological (eg, food and shelter), then safety and security (eg, health, employment and property), followed by love and belonging (eg, friendship and family), self-esteem (eg, confidence and achievement) and finally self-actualisation (eg, morality, meaning and inner potential). In the post war years, the focus for many Australians was on physical needs including shelter and a perception that this will provide safety and security. Today many still struggle with this but arguably the prosperity seen over the last 50 years has seen many more move on to focussing on self-actualisation. Witness the growth of books and material directed to this in book shops and online. In 1966 it was only just starting to become a thing with hippies trying to seek enlightenment. For some, individual freedom may not be seen as consistent with the financial commitment required by a mortgage.
-
Increased life expectancy – such that a retiree today may spend 25 years in retirement but maybe only 5 in the 1950s – and the growth of Superannuation from the early 1990s meant increased focus on retirement and wealth beyond the home.
-
Increased diversity in terms of cultures & sexual orientations may have reduced the perceived importance of home ownership for some.
The combination of these considerations has likely contributed to some diminution in the importance of home ownership as a measure of wealth and an underpinning of security in contrast to the ‘make do/Depression generation’ and to a lesser degree their baby boomer children. And demographics and starting careers later in life have pushed the desire for home ownership out from the early twenties to late twenties or thirties.
But what about housing affordability?
However, at the same time it’s hard to see housing affordability not impacting too. Trying to define housing affordability is always a bit of a challenge given the influence of house prices, income, interest rates and beneath that whether allowance is made for the rise of two income households and the increased availability of debt. But to keep things simple, it’s pretty clear that housing affordability has deteriorated massively since the 1990s. The first chart below shows the home ownership rate against two measures of housing affordability: the ratio of average home prices to average annual wages (in red); and the ratio of home prices to median household disposable income (green). The latter takes account of the rise in two income households, but data is not available before the 1980s. But the message from both is that since the 1990s there has been significant rise in the ratio home prices relative to incomes. Prior to the mid 1990s average home prices ranged around two to six times annual wages but since then it’s steadily increased to around 14 times. Similarly, the ratio of home prices to median household disposable income has blown out from around four times to eight times.
Home ownership versus home prices relative to incomes
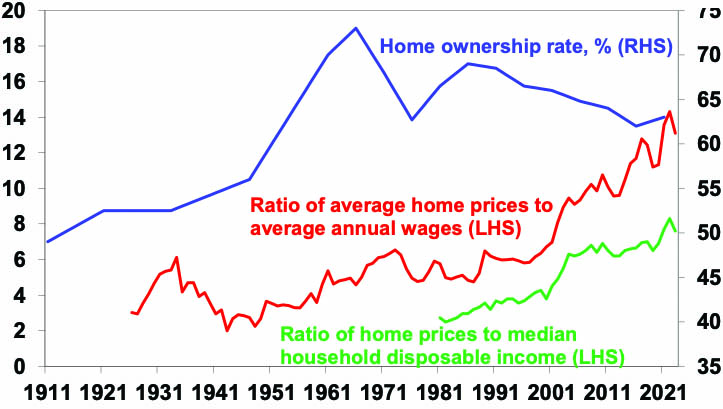
Source: ABS, Bernard Salt/The Demographics Group, CoreLogic, AMP
Yes, interest rates are still lower than was the case in the 1980s and 1990s, but this has been reflected in higher price to income ratios. Another measure related to housing affordability is how long it takes to save for a deposit to enter the property market. For someone on average full-time earnings it now takes around 10 years to save a 20% deposit to buy an average property compared to around five years thirty years ago.
Years it takes to save for a 20% deposit
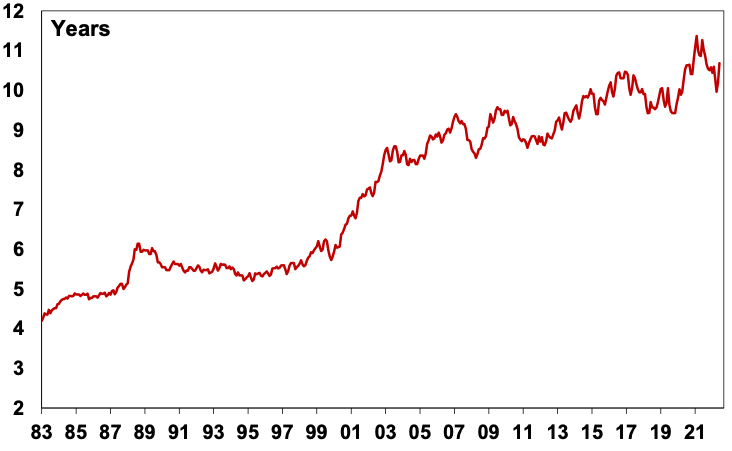
Source: CoreLogic, AMP
The downtrend in home ownership over the last three decades has correlated with the deterioration in housing affordability as measured by home price to income ratios and the increasing time it takes to save for a deposit. So, housing affordability has likely contributed to the decline in home ownership along with the factors mentioned in the previous section. Disentangling their relative importance will be hard. The increase in the time it takes to save a deposit may also have accentuated the demographic factors referred to earlier – notably starting a family later in life – in delaying home ownership. Maybe the modest rise in home ownership in the last Census reflected the delayed start to family life.
Should we worry about falling home ownership?
To the extent that falling home ownership reflects understandable choices around demographic trends, prosperity and diversity we shouldn’t be too concerned. But it likely also partly reflects the impact of deteriorating housing affordability and this is something we should be concerned about as it is driving increasing inequality including across generations and if it persists it could threaten social cohesion.
What can be done to boost housing affordability?
So, what can be done to boost housing affordability? Much has been written on this over the years without much progress. And despite some efforts by governments (echoing M.T. Daly’s comments two generations ago) they have clearly not been successful although I suspect this is because they have not been comprehensive or forceful enough. Ideally government policy should involve a multi-year plan encompassing local, state and federal governments. My shopping list on this front includes:
-
Build more homes – relaxing land use rules, releasing land faster and speeding up approval processes, encourage build to rent affordable housing and greater public involvement in provision of social housing.
-
Matching the level of immigration to the ability of the property market to supply housing. We have clearly failed to do this following reopening from the pandemic, and this is now evident in severe supply shortfalls.
-
Encouraging greater decentralisation to regional Australia – the work from home phenomenon shows this is possible but it should be helped along with appropriate infrastructure and of course measures to boost regional housing supply.
-
Tax reform including replacing stamp duty with land tax (to make it easier for empty nesters to downsize) and reducing the capital gains tax discount (to remove a distortion in favour of speculation).
Policies that are less likely to be successful include: grants and concessions for first home buyers (as they just add to higher prices); and abolishing negative gearing which would just inject another distortion in the tax system and could adversely affect supply – although there is a case to cap excessive use of negative gearing tax benefits.
Source: AMP Capital May 2023
Important note: While every care has been taken in the preparation of this document, AMP Capital Investors Limited (ABN 59 001 777 591, AFSL 232497) and AMP Capital Funds Management Limited (ABN 15 159 557 721, AFSL 426455) make no representations or warranties as to the accuracy or completeness of any statement in it including, without limitation, any forecasts. Past performance is not a reliable indicator of future performance. This document has been prepared for the purpose of providing general information, without taking account of any particular investor’s objectives, financial situation or needs. An investor should, before making any investment decisions, consider the appropriateness of the information in this document, and seek professional advice, having regard to the investor’s objectives, financial situation and needs. This document is solely for the use of the party to whom it is provided.
Commercial property returns under threat
Dr Shane Oliver – Head of Investment Strategy and Chief Economist, AMP Capital
IntroductionOver the last 10 and 20 years, returns from Australian unlisted commercial property have averaged 9% pa. This in part reflected the search for decent income bearing investments by investors in response to falling interest rates & bond yields that pushed up property values faster than justified by
Read MoreDr Shane Oliver – Head of Investment Strategy and Chief Economist, AMP Capital
Introduction
Over the last 10 and 20 years, returns from Australian unlisted commercial property have averaged 9% pa. This in part reflected the search for decent income bearing investments by investors in response to falling interest rates & bond yields that pushed up property values faster than justified by rents. However, it’s now vulnerable from the rise in bond yields over the last two years and reduced space demand flowing from “work from home” for office property and online retail for retail property.

Commercial property and the investment cycle
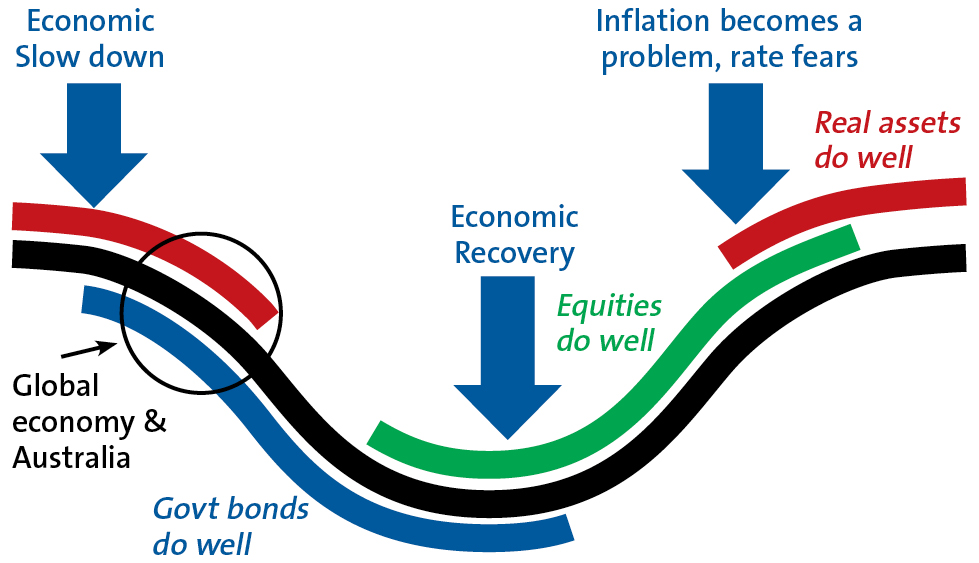
Just as shares lead in the investment cycle, unlisted assets like commercial property, being more connected to the real economy, tend to lag. The next chart is a stylised version of the investment cycle – the thick grey line is the economic cycle. (Note that residential property has become more interest sensitive and now tends to move ahead of commercial property.)
The investment cycle
Source: AMP
Bonds do well in the economic downturn phase as interest rates fall and when inflation is still falling. Shares tend to lead the economic recovery as they respond first to easy money and as far-sighted investors sniff out recovery and continue doing well as profits rise before coming under pressure from eventual interest rate hikes & fears of a new downturn. Real assets tend to do relatively well later in the cycle as: it takes longer for easy money to flow into them; the valuation process results in a lag; & they tend to move more with current economic conditions which drives rents. This benefitted unlisted commercial property returns in 2021-22. However, the investment cycle is now turning against commercial property with interest rates up sharply and economic growth slowing. The slump last year and ongoing volatility in share markets has at least partly anticipated this with commercial property starting to follow with a lag.
A-REITs show the way… with a lot of noise!
This cyclical relationship can also be seen by comparing the returns from Australian Real Estate Investment Trusts (A-REITs) and directly held (ie, unlisted) non-residential property returns. The former are correlated with the share market. This makes them highly volatile but means they often provide a good lead for unlisted commercial property. Their weakness since January last year signals rougher times ahead for unlisted commercial property and returns have started to slow to reflect this.
Listed v unlisted property returns
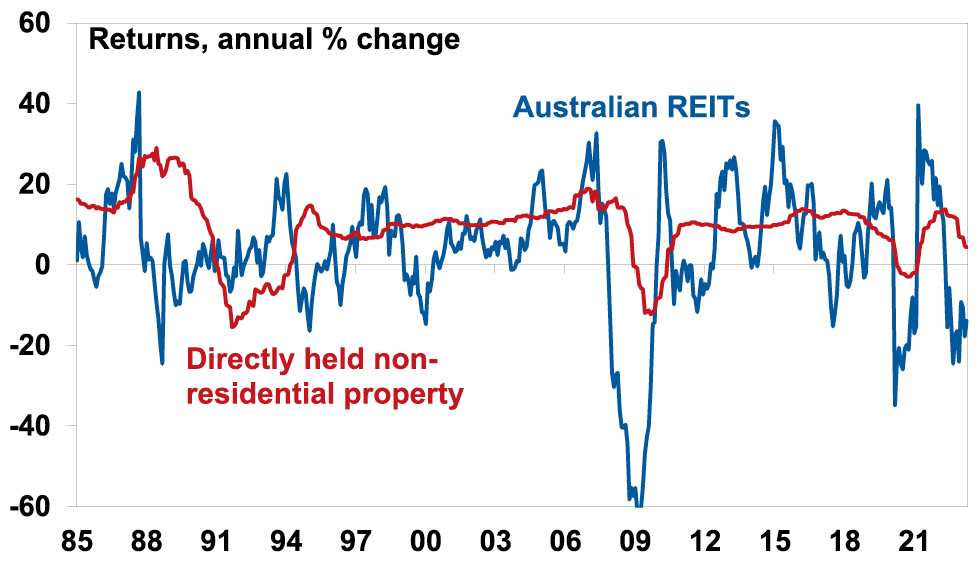
Source: Bloomberg, Mercer/IPD, AMP
The “search for yield”
Commercial property is arguably more vulnerable now because it benefitted from the decades long downtrend in interest rates and bond yields that may now have come to an end or be reversing. As interest rates and bond yields fell it drove a search by investors for decent income bearing investments – the “search for yield” – that pushed property values up faster than growth in rents and hence pushed property yields to record lows. The next chart shows yields for unlisted commercial property. With each 0.25% fall in property yields translating to a roughly 4% capital gain and with average commercial property yields having fallen from 7.3% to 4.89% between December 2009 to December 2019 this provided a huge boost to returns, averaging roughly 4.3% pa and pushing values nearly 50% higher over ten years. This is now starting to go in reverse.
Commercial property yields
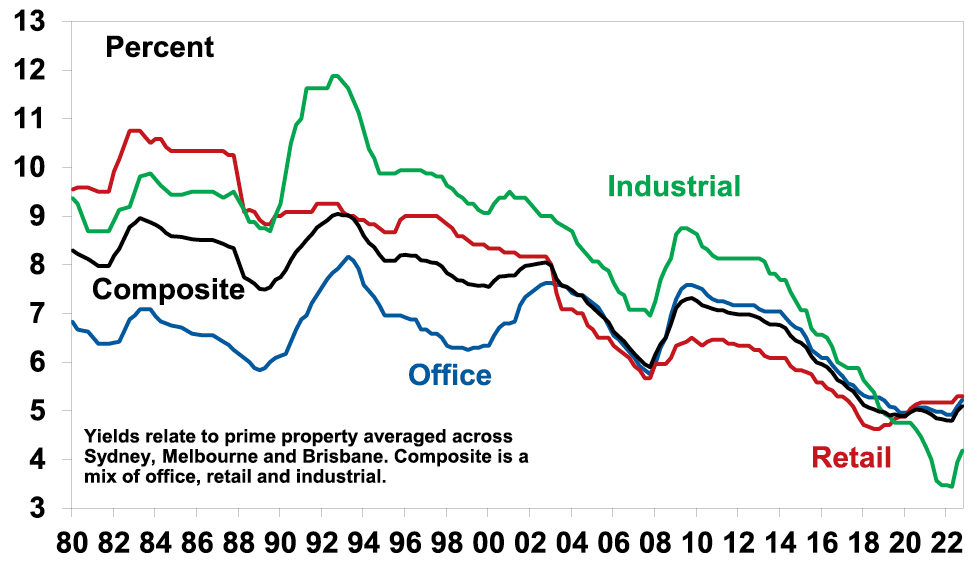
Source: JLL, AMP
Of course, while the decline in yields since the 1980s was big, unlisted non-residential property was not alone. In fact, while the grossed-up dividend yield from shares has been range bound over the last 40 years, yields on bonds, residential property and listed property have fallen more than unlisted commercial property yields. See the next chart. 10-year bond yields have fallen from well above commercial property yields in the 1980s to well below. And in the 1980s the rental yield on residential and commercial property was similar, but today the former is far lower.
Australian investment yields
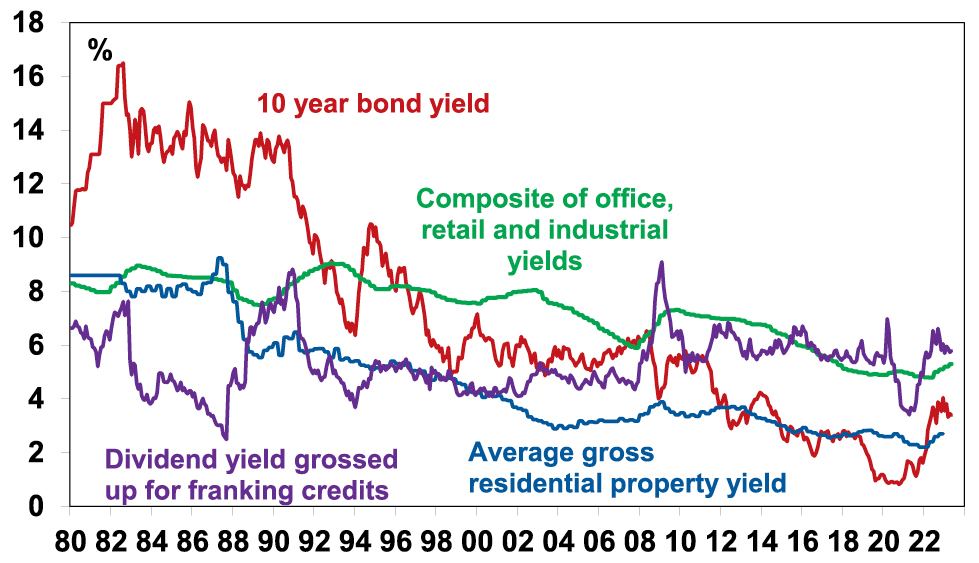
Source: JLL, REIA, Bloomberg, AMP
The commercial property risk premium – is it enough?
This suggests that while unlisted commercial property is vulnerable to an ongoing back up in yields other assets are arguably even more vulnerable. But there is a catch as commercial property is facing an oversupply problem in office and retail whereas the other asset classes are not, eg, Australian housing is facing chronic shortages as immigration surges.
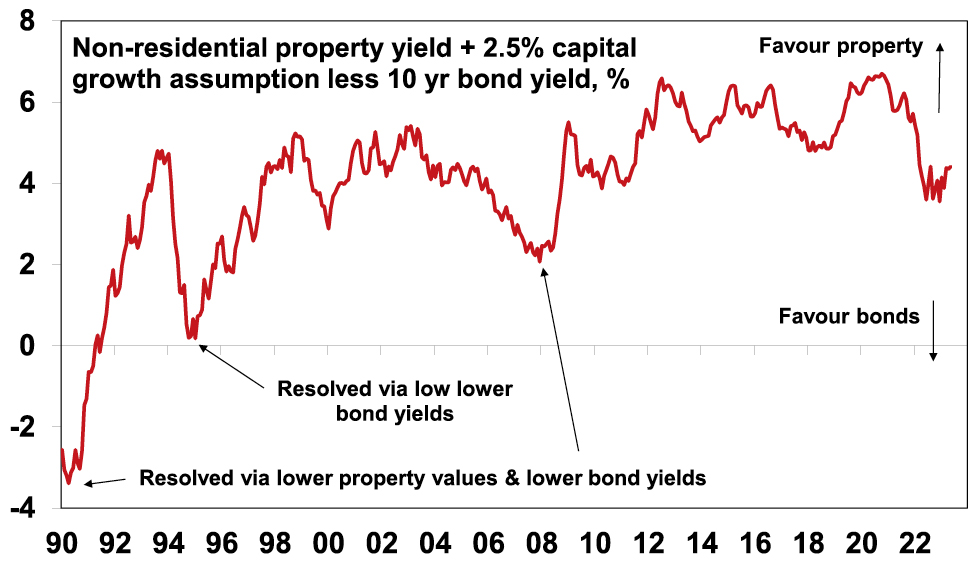
But first to get a better handle on the relative attractiveness of unlisted commercial property compared to bonds we calculate a property risk premium. Comparing the bond yield with the average property yield is not strictly correct as the former is a nominal yield while the latter is a real yield. So, a better comparison is to look at the risk premium offered by commercial property over bonds. The next chart shows a proxy for this.
Commercial property risk premium is well down from its high
Source: JLL, Bloomberg, AMP
It assumes that rental and capital growth will average 2.5% pa over time (ie, in line with targeted inflation) and adds this to the average unlisted non-residential property yield to give a guide to potential total returns. The 10-year bond yield has been subtracted to show a property risk premium. Despite the collapse in property yields in late 2020 it reached a record high of more than 6.7% thanks to plunging bond yields at the time below 1%. Since then, the rise in bond yields has seen the risk premium plunge to levels not seen since the 2000s, but at around 4% it’s still relatively high. But there are two threats here. The first is if bond yields continue to rise reversing the yield chasing investor flows that commercial property has benefitted from over many years. And even if bond yields don’t rise further there is a risk that the reduced property risk premium may not be enough to keep investors happy given the outlook for deteriorating leasing conditions ahead.
Work from home and space demand
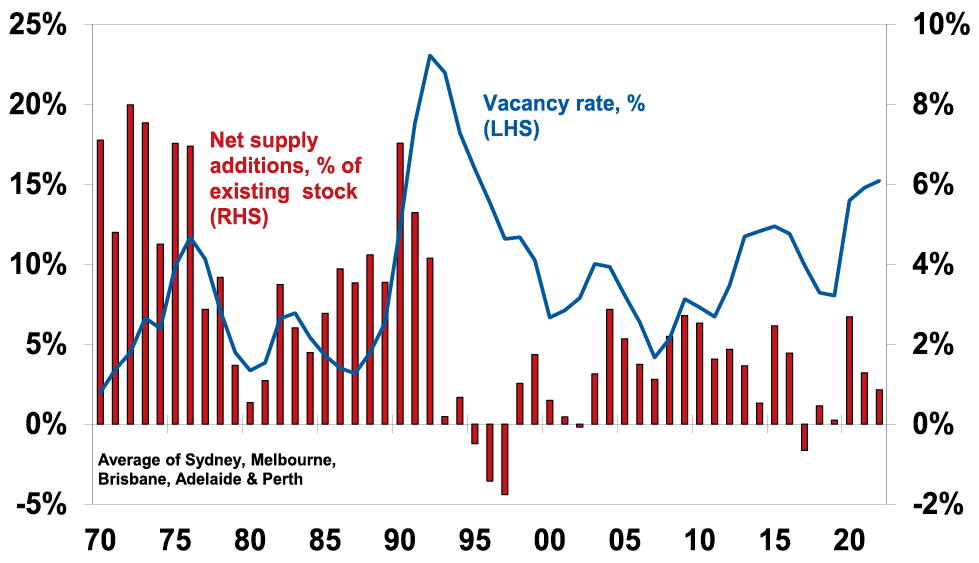
Leasing conditions typically deteriorate when the economic cycle turns down as companies lay off workers & cut hiring, retail spending slows and economic activity slows generally impacting industrial property. This time around it could be made worse by structural considerations in the case of retail and particularly office property. Retail property has been adjusting for years to the rising proportion of activity which is transacted online. The share of retail sales online has gone from around 7% pre-pandemic to around 11% now and this is acting to constrain retail space demand and rents. While there has been a return to the office post the pandemic lockdowns, many office employees are averaging two days a week in the office with Mondays and Fridays often near deserted. There are huge benefits to working together physically around culture, collaboration, idea generation and learning from others but there are also benefits to working from home in terms of no wasted commute time, more focussed work, less damage to the environment, better family flexibility and life balance. Once the pandemic revealed these benefits, they can’t then be unseen. And cost focussed companies with hot desking, laptops and work anywhere IT have pushed their staff in that direction anyway. The ideal for most is probably somewhere in between the extremes at say 2-3 days a week in the office but a return to the pre-pandemic norm of 4-5 days is most unlikely. This means that many companies will likely give up space when their leases expire, as they accept that balanced work from home is here to stay and they use it as a way to save rental costs. Over time this could mean a 30-40% reduction in leased office space demand. Average Australian capital city office vacancy rates are at 15% – their highest since the mid-1990s. But because this measures leased space, significant upside is possible if companies bite the bullet and cut leasing requirements. And rising vacancy rates mean lower office rents and falling values.
Average Australian CBD office vacancy rates and new supply
Source: AMP
Return outlook and what to watch?
The combination of the back up in bond yields resulting in a stalling if not reversal of “search for yield” demand for commercial property, slowing economic activity and structural threats to office and retail space demand leaves unlisted commercial property at risk of significant capital loss (15% plus) ahead. Industrial property has benefitted more from the plunge in bond yields but not does face the same structural threats to space demand as office and retail do so is better placed.
This risks a flow on to banks. Particularly in the US where commercial property loans make up about 40% of smaller banks lending and 13% of bigger banks lending at a time when property owners will be finding it harder to borrow with recent banking stress. In Australia, commercial property loans are only 6% of bank assets and lending is far more prudent suggesting less risk of a re-r un of the damage to banks seen in the early 1990s property collapse. Key to watch will be bond yields, whether the economy avoids recession and where “work from home” settles.
Source: AMP Capital May 2023
Important note: While every care has been taken in the preparation of this document, AMP Capital Investors Limited (ABN 59 001 777 591, AFSL 232497) and AMP Capital Funds Management Limited (ABN 15 159 557 721, AFSL 426455) make no representations or warranties as to the accuracy or completeness of any statement in it including, without limitation, any forecasts. Past performance is not a reliable indicator of future performance. This document has been prepared for the purpose of providing general information, without taking account of any particular investor’s objectives, financial situation or needs. An investor should, before making any investment decisions, consider the appropriateness of the information in this document, and seek professional advice, having regard to the investor’s objectives, financial situation and needs. This document is solely for the use of the party to whom it is provided.