

Dr Shane Oliver – Head of Investment Strategy and Chief Economist, AMP Capital
Key points
-
Starting point valuations – like yields and price to earnings multiples – are a key driver of potential medium term investment returns.
-
For growth assets it’s often more complicated with, eg, the level of interest rates playing a big role.
-
At present valuation starting points for term deposits and bonds suggest low medium-term returns. For shares they suggest better but still constrained returns.

Introduction
It makes sense that the cheaper you buy an asset the higher its prospective return will be. However, this is frequently forgotten with investors often tempted to project recent returns into the future regardless of valuations. A valuation measure for an asset is basically a guide to whether it’s expensive or cheap. This note looks at the main issues.
It’s relatively easy for cash and bonds
An obvious example of where the starting point valuation matters critically is cash. If the interest rate on offer from a term deposit rate is relatively high, then that is good because that is precisely the return you will get. For example, 10 years ago average term deposit rates in Australia were over 6%. This was pretty good given inflation was around 2%, so the starting point for term deposits then was attractive. Now term deposit rates are averaging below 0.5% so they are not such good value!
Ultra low bank term deposit rates
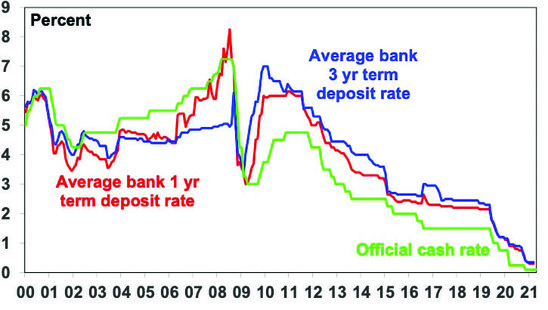
Source: RBA, AMP Capital
For government bonds (where in advanced countries default risk is next to zero) the yield is similarly a good guide to starting point value and hence medium-term return potential. Over short-term periods bond prices can move up and down and so influence short term returns, but over the medium term the return a bond investor will get is what bond yields were when they invested. If the yield on a 10-year bond is 5%, and you hold the bond to maturity, your return will be 5%. Of course, a portfolio of bonds reflects a range of maturities, so the relationship is not perfect but it’s a good guide. This can be seen in the next chart which shows a scatter plot of Australian 10-year bond yields since 1950 (horizontal axis) against subsequent 10 year returns from Australian bonds based on the Composite All Maturities Bond index (vertical axis).
Australian bonds – the higher the bond yield the better the return
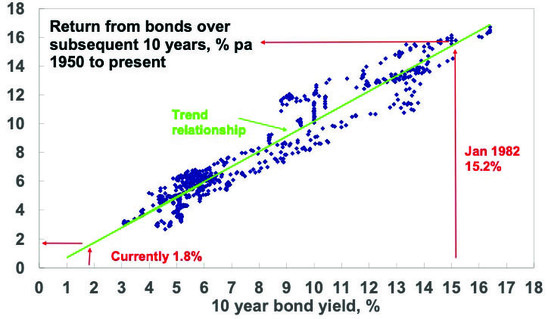
Source: Bloomberg, AMP Capital
When bond yields are high, they set up high bond returns over the medium term and vice versa. For example, Australian 10-year bond yields in January 1982 were 15.2% and it’s not surprising that bond returns over the next 10 years were 15.4%. Right now, they’re just 1.8%, pointing to pretty low bond returns.
For shares a similar relationship holds. The following chart shows a scatter plot of the price to trailing 12 months earnings ratio for US shares since 1900 (along the horizontal axis) against subsequent 10-year total returns (ie, dividends plus capital growth) from US shares. While the relationship is not as smooth as that for bonds as there is much more involved in share returns, it can be seen that it is a negative relationship, ie, when share prices are relatively high compared to earnings, subsequent returns tend to be relatively low and vice versa. The best time for shares is after PEs have fallen to single digits.
US shares – the lower the PE the better the medium term return
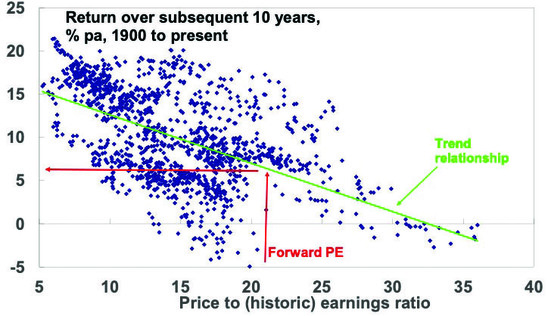
Source: Bloomberg, AMP Capital
The next chart shows the same for Australian shares but only back to 1962 as an Australian PE series is not available prior to the 1960s. Again, there is the expected negative relationship between the level of the PE and subsequent total returns (based on the All Ords Accumulation Index) with the best returns coming after periods of low PEs. For example, at the end of the mid-1970s bear market in September 1974 the PE was just 5.4 times which was a great time to buy shares as over the next 10 years Australian shares returned 21.8% pa.
Australian shares – the lower the PE the better
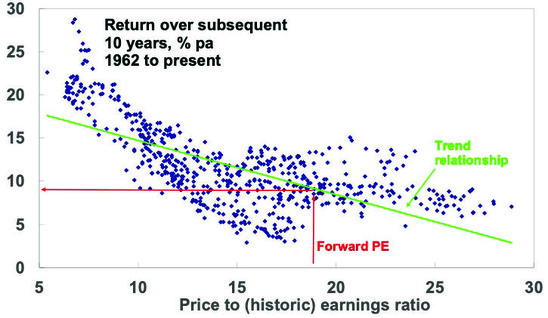
Source: RBA, ASX, AMP Capital
There is a dividend yield series for Australian shares back to 1900 and as would be expected the rough relationship indicates the higher it is the better the subsequent return.
The key is that the starting point matters – put simply the higher the yield and the lower the price to earnings ratio (for shares) relative to their history the better for an asset’s return potential.
“It don’t come easy” – pitfalls with valuation
But the importance of starting point valuations is often forgotten. Behavioural finance tells us that its natural for investors to pay too much attention to recent performance, so after a run of strong years investors expect it will continue. This leads many to buy only after good times, only to find they have bought when shares are overvalued and therefore find themselves locked into poor returns. And vice versa after a run of poor returns. So when valuations matter the most, they often get ignored.
But beyond this there are several complications that at times can erase confidence in using valuation measures.
First, you need to allow for risk and sometimes assets are cheap for a reason (value traps). This is more often an issue with individual shares, eg, a tobacco company subject to an impending lawsuits even though current earnings are fine. These traps can only be picked up by thorough research.
Second, valuation measures are a poor guide to market timing, often being out by years. To paraphrase John Maynard Keynes, the market can remain expensive (or cheap) for longer than you can remain solvent, eg, former Fed Chair Alan Greenspan’s and economist Robert Shiller’s call that US shares were exhibiting “irrational exuberance” in 1996 came four years early & shorting them in the interim could have sent an investor bust.
Third, there is a huge array of valuation measures when it comes to shares. For example, the “earnings” in the PE can be actual historic earnings as reported for the last 12 months, consensus earnings for the year ahead or earnings that have been smoothed to remove cyclical distortions. All have pros and cons. For example, the historic PE is based on actual data with no forecasting or manipulation, but it can give the wrong signal during or after of a recession as earnings may be depressed making shares look far more expensive than they actually are. This is likely still the case now with the PE calculated on historical earnings for US and Australian shares being very high (33 times and 59 times on some measures respectively!) pointing to very low returns in the years ahead based on the relationships in the charts above, but forward PEs based on still rapidly recovering consensus forecasts for year ahead earnings (at around 21 times and 18 times respectively) pointing to constrained but still okay returns (see the PE charts earlier).
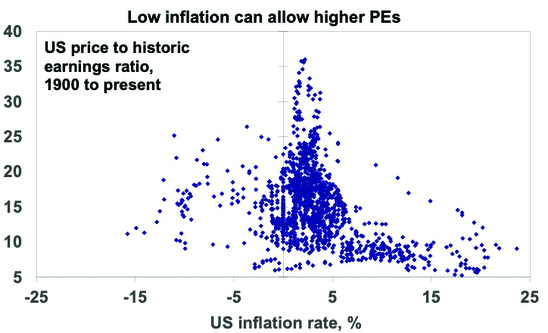
Finally, the appropriate level of valuation will vary with inflation and interest rates. In a period of low inflation, assets can trade on lower yields as the interest rate/yield structure in the economy falls. This means higher PEs. So low inflation, say down to around 2%, can be good for shares via higher PEs as seen in the next chart. But if inflation becomes deflation it can be bad as it tends to be associated with economic contraction.
Low inflation can allow higher PEs
Source: Bloomberg, AMP Capital
To get technical: share prices in theory should equal the present value of future dividends discounted by the required rate of return which equals the risk-free interest rate (usually seen as government bond yields) plus a return premium to cover the higher volatility of shares. It follows from this that shares should trade on higher price to earnings ratios when interest rates fall and vice versa when they rise all other things equal. So, interest rates can’t be ignored when valuing shares.
Current valuation signals
Right now, starting valuation signals are as follows:
Cash – cash rates at 0.1% and bank term deposits at less than 0.5% mean ultra-low returns from cash, until rates rise a lot. Bonds – bond yields may be up from their lows but they’re still very low at 1.8% for Australian 10-year bonds and less globally pointing to low medium term returns from government bonds.
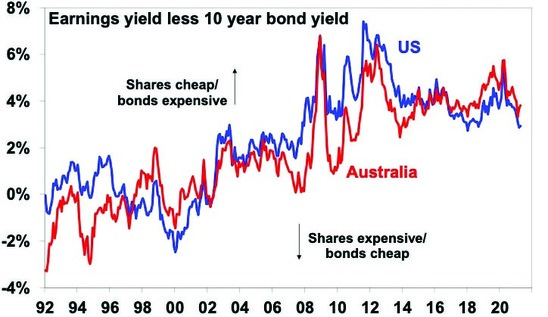
Shares – PE ratios for shares are relatively high particularly using earnings reported for over the last 12 months but less so when using forward earnings to adjust for currently depressed earnings from the pandemic. Allowing for still low bond yields – by subtracting 10-year bond yields from the earnings yields (using forward earnings) – shows that US and Australian shares still offer a decent risk premium over bonds of around 2.9% in the US and 3.8% in Australia. See the next chart. This may change if bond yields rise further. But at present shares continue to offer a decent return premium relative to bonds.
Shares still offer a decent yield pick up v bonds
Source: Bloomberg, AMP Capital
Notwithstanding this, the sting in the tale is that while shares offer much better medium-term return prospects than cash and bonds their relatively high price to earnings multiples point to relatively constrained medium-term returns by past standards.
Source: AMP Capital 14 April 2021
Important note: While every care has been taken in the preparation of this document, AMP Capital Investors Limited (ABN 59 001 777 591, AFSL 232497) and AMP Capital Funds Management Limited (ABN 15 159 557 721, AFSL 426455) make no representations or warranties as to the accuracy or completeness of any statement in it including, without limitation, any forecasts. Past performance is not a reliable indicator of future performance. This document has been prepared for the purpose of providing general information, without taking account of any particular investor’s objectives, financial situation or needs. An investor should, before making any investment decisions, consider the appropriateness of the information in this document, and seek professional advice, having regard to the investor’s objectives, financial situation and needs. This document is solely for the use of the party to whom it is provided.
