

Olivers Insights
The $A still has more downside, but a lot of the weakness is behind us
While some have expressed surprise at the recent resilience in the value of the Australian dollar around the $US0.69-0.70 level despite weak Australian growth and Reserve Bank rate cuts, from a big picture sense it has already fallen a long way. It’s down 37% from a multi-decade high of $US1.10 in 2011 and it’s down 15% from a high in
Read MoreWhile some have expressed surprise at the recent resilience in the value of the Australian dollar around the $US0.69-0.70 level despite weak Australian growth and Reserve Bank rate cuts, from a big picture sense it has already fallen a long way. It’s down 37% from a multi-decade high of $US1.10 in 2011 and it’s down 15% from a high in January last year of $US0.81. So, having met our long-held expectation for a fall to around or just below $US0.70 and given its recent resilience now is an appropriate time to take a look at its outlook.

The $A is slightly undervalued long term
The first thing to note is that from a very long-term perspective the Australian dollar is around or just below fair value. This contrasts to the situation back in 2011 when it was well above long-term fair value. The best guide to this is what is called purchasing power parity (PPP) according to which exchange rates should equilibrate the price of a basket of goods and services across countries – see the next chart.

Source: RBA, ABS, AMP Capital
If over time Australian inflation and costs rise relative to the US, then the value of the $A should fall to maintain its real purchasing power and competitiveness. And vice versa if Australian inflation falls relative to the US. Consistent with this the Australian dollar tends to move in line with relative price differentials – or its purchasing power parity implied level – over the long term. And right now, it’s around or just below fair value.
But as can be seen in the last chart, it rarely spends much time at the purchasing power parity level. Cyclical swings in the $A are largely driven by swings in the prices of Australia’s key commodity exports and relative interest rates, such that a fall in Australian rates relative to US rates makes it more attractive to park money in the US and hence pushes the $A down. “Investor” sentiment and positioning also impacts – such that if the $A is over-loved with a lot of long positions then it becomes vulnerable to a fall and vice versa if it’s under-loved.
The negatives for the $A…
For some time, our view has been that the $A would fall into the high $US0.60s and this has happened. But notwithstanding this and that the $A has already fallen a long way from its 2011 high, it could still face a bit more downside over the next six to 12 months. The main reason is that Australian growth is weaker than US growth and spare capacity is much higher in Australia. For example, labour market underutilisation is 13.7% in Australia versus just 7.1% in the US, growth in Australia is running at 1.8% year on year compared to 3.2% in the US and the drag on growth from the housing downturn is likely to keep growth relatively weak in Australia for the next year or so.

Source: Bloomberg, AMP Capital
This will keep inflation lower in Australia than in the US and so we see the RBA cutting rates more than the Fed. And the RBA is much closer to having to do quantitative easing or some variant of it (ie using printed money to boost growth) than the Fed. This will continue to make it relatively less attractive to park money in Australia. As can be seen in the next chart, periods of a low and falling interest rate differential between Australia and the US usually see a low and falling $A.

Source: Bloomberg, AMP Capital
So this all points to more downside for the Australian dollar.
…and the positives
Against this there are a bunch of forces acting to support the $A, and this has been evident in its relative resilience despite bad news in recent weeks. Firstly, global sentiment towards the Australian dollar has been negative for some time and this has been reflected in short or underweight positions in the $A being at extreme levels – see the next chart. In other words, many of those who want to sell the $A have already done so and this leaves it vulnerable to a rally if there is any good news.

Source: Bloomberg, AMP Capital
Secondly, there has been good news with the iron ore price pushing above $US100 a tonne and this combined with solid growth in export volumes has pushed the trade balance into a record surplus which has shrunk the current account deficit as a share of GDP to its lowest since the 1970s. Of course, the iron ore price will likely fall back somewhat when Vale gets production back to normal after its dam disaster, but Chinese economic stimulus may help keep it and other commodity prices supported. The smaller current account surplus means Australia has become less dependent on foreign capital inflows.

Source: ABS, AMP Capital
Finally, in response to the threat to growth from President Trump’s trade wars, mixed economic data and weak inflation, investors have moved to price in rate cuts from the Fed over the next year. And this is negative for the $US generally after a multi-year bull market since 2008.
So where to from here?
Overall, we expect that the weaker growth outlook in Australia relative to the US and the likely continuing decline in the interest rate differential versus the US will dominate and push the $A still lower. But with the $A having already had a big fall, short $A positions running high, the current account deficit having shrunk and the US dollar looking toppy we see the $A falling to around $US0.65 on a six to 12 month horizon as opposed to crashing down to say the 2001 low of $US0.48. Of course, if the global economy falls apart, causing a surge in unemployment in Australia as export demand and confidence collapses and another big leg down in house prices then all bets are off and the Aussie will fall a lot more…but that’s not our base case.
What does it mean for investors?
With the risks skewed towards more downside in the value of the $A, albeit less so than say a year ago, there are several implications for investors.
First, there remains a case – albeit not as strong as it was when the Australia dollar was much higher – to maintain a decent exposure to offshore assets that are not hedged back to Australian dollars. A decline in the value of the $A will boost the value of an investment in offshore assets denominated in foreign currency one for one. Meanwhile, the fall in Australian interest rates relative to global interest rates has reduced the incentive to hedge because when Australian rates are above global rates investors are “paid” to hedge.
Second, if the global outlook turns sour due to say Trump’s trade wars, having an exposure to foreign currency provides protection for Australian investors as the $A usually falls in response to threats to global growth. As can be seen in the next chart there is a rough positive correlation between changes in global shares in their local currency terms and the $A. Major falls in global shares associated with the emerging market/LTCM crisis in 1998, the tech wreck into 2001, the GFC, the Eurozone crises and the 2015-16 global growth scare saw sharp falls in the $A. So being short the $A and long foreign exchange provides good protection against threats to the global outlook.

Source: Bloomberg, AMP Capital
Finally, continuing softness in the $A will be positive for Australian industry sectors that compete internationally like tourism, higher education, manufacturing, agriculture and mining and this will benefit shares exposed to these areas.
If you would like to discuss any of the issues raised by Dr Oliver, please call on |PHONE| or email |STAFFEMAIL|.
Source: AMP Capital 14 June 2019
Important notes: While every care has been taken in the preparation of this article, AMP Capital Investors Limited (ABN 59 001 777 591, AFSL 232497) and AMP Capital Funds Management Limited (ABN 15 159 557 721, AFSL 426455) (AMP Capital) makes no representations or warranties as to the accuracy or completeness of any statement in it including, without limitation, any forecasts. Past performance is not a reliable indicator of future performance. This article has been prepared for the purpose of providing general information, without taking account of any particular investor’s objectives, financial situation or needs. An investor should, before making any investment decisions, consider the appropriateness of the information in this article, and seek professional advice, having regard to the investor’s objectives, financial situation and needs. This article is solely for the use of the party to whom it is provided and must not be provided to any other person or entity without the express written consent of AMP Capital.
The nine most important things I have learnt about investing over the past 35 years
I have been working in and around investment markets for 35 years now. A lot has happened over that time. The 1987 crash, the recession Australia had to have, the Asian crisis, the tech boom/tech wreck, the mining boom, the Global Financial Crisis, the Eurozone crisis. Financial deregulation, financial reregulation. The end of the cold war, US domination, the rise
Read MoreI have been working in and around investment markets for 35 years now. A lot has happened over that time. The 1987 crash, the recession Australia had to have, the Asian crisis, the tech boom/tech wreck, the mining boom, the Global Financial Crisis, the Eurozone crisis. Financial deregulation, financial reregulation. The end of the cold war, US domination, the rise of Asia and then China. And so on. But as someone once observed the more things change the more they stay the same. And this is particularly true in relation to investing. So, what I have done here is put some thought into the nine most important things I have learned over the past 35 years.

# 1 There is always a cycle
Droll as it sounds, the one big thing I have seen over and over in the past 35 years is that investment markets constantly go through cyclical phases of good times and bad. Some are short term, such as those that relate to the 3 to 5 year business cycle. Some are longer, such as the secular swings seen over 10 to 20 year periods in shares. Some get stuck in certain phases for long periods. Debate is endless about what drives cycles, but they continue. But all eventually contain the seeds of their own reversal. Ultimately there is no such thing as new eras, new paradigms and new normal as all things must pass. What’s more share markets often lead economic cycles, so economic data is often of no use in timing turning points in shares.
# 2 The crowd gets it wrong at extremes
What’s more is that these cycles in markets get magnified by bouts of investor irrationality that take them well away from fundamentally justified levels. This is rooted in investor psychology and flows from a range of behavioural biases investors suffer from. These include the tendency to project the current state of the world into the future, the tendency to look for evidence that confirms your views, overconfidence and a lower tolerance for losses than gains. So, while fundamentals may be at the core of cyclical swings in markets, they are often magnified by investor psychology if enough people suffer from the same irrational biases at the same time. From this it follows that what the investor crowd is doing is often not good for you to do too. We often feel safest when investing in an asset when neighbours and friends are doing the same and media commentary is reinforcing the message that it’s the right thing to do. This “safety in numbers” approach is often doomed to failure. Whether its investors piling into Japanese shares at the end of the 1980s, Asian shares into the mid 1990s, IT stocks in the late 1990s, US housing and dodgy credit in the mid 2000s or Bitcoin in 2017. The problem is that when everyone is bullish and has bought into an asset in euphoria there is no one left to buy but lots of people who can sell on bad news. So, the point of maximum opportunity is when the crowd is pessimistic, and the point of maximum risk is when the crowd is euphoric.
# 3 What you pay for an investment matters a lot
The cheaper you buy an asset the higher its prospective return. Guides to this are price to earnings ratios for share markets (the lower the better – see the next chart) and yields, ie the ratio of dividends, rents or interest payments to the value of the asset (the higher the better). Flowing from this it follows that yesterdays winners are often tomorrows losers – because they became overvalued and over loved and vice versa. But while this seems obvious, the reality is that many find it easier to buy after shares have had a strong run because confidence is high and sell when they have had a big fall because confidence is low. But the key point is that the more you pay for an asset the lower its potential return and vice versa.

Source: Global Financial Data, AMP Capital
# 4 Getting markets right is not as easy as you think
In hindsight it all looks easy. Looking back, it always looks obvious that a particular boom would go bust when it did. But that’s just Harry hindsight talking! Looking forward no-one has a perfect crystal ball. As JK Galbraith observed “there are two kinds of forecasters: those who don’t know, and those who don’t know they don’t know.” Usually the grander the forecast – calls for “great booms” or “great crashes ahead” – the greater the need for scepticism as such calls invariably get the timing wrong (in which case you lose before it comes right) or are dead wrong. Market prognosticators suffer from the same psychological biases as everyone else. If getting markets right were easy, then the prognosticators would be mega rich and would have stopped doing it long ago. Related to this many get it wrong by letting blind faith – “there is too much debt”, “house prices are too high and are guaranteed to crash”, “the Eurozone will break up” – get in the way of good investment decisions. They may be right one day, but an investor can lose a lot of money in the interim. The problem for ordinary investors is that it’s not getting easier as the world is getting noisier as the flow of information and opinion has turned from a trickle to a flood and the prognosticators have had to get shriller to get heard.
# 5 Investment markets don’t learn
A key lesson from the history of investment markets is that they don’t seem to learn. The same mistakes are repeated over and over as markets lurch from one extreme to another. This is even though after each bust many say it will never happen again and the regulators move in to try and make sure it doesn’t. But it does! Often just somewhere else. Sure, the details change but the pattern doesn’t. As Mark Twain is said to have said: “history doesn’t repeat, but it rhymes.” Sure, individuals learn and the bigger the blow up the longer the learning lasts. But there’s always a fresh stream of newcomers to markets and in time collective memory dims.
# 6 Compound interest is like magic
This one goes way back to my good friend Dr Don Stammer. One dollar invested in Australian cash in 1900 would today be worth $240 and if it had been invested in bonds it would be worth $950, but if it was allocated to Australian shares it would be worth $593,169. Although the average annual return on Australian shares (11.8% pa) is just double that on Australian bonds (5.9% pa) over the last 119 years, the magic of compounding higher returns leads to a substantially higher balance over long periods. Yes, there were lots of rough periods along the way for shares as highlighted by arrows on the chart, but the impact of compounding at a higher long-term return is huge over long periods of time. The same applies to other growth-related assets such as property.

Source: Global Financial Data, AMP Capital
# 7 It pays to be optimistic
The well-known advocate of value investing Benjamin Graham observed that “To be an investor you must be a believer in a better tomorrow.” If you don’t believe the bank will look after your deposits, that most borrowers will pay their debts, that most companies will grow their profits, that properties will earn rents, etc then you should not invest. Since 1900 the Australian share market has had a positive return in roughly eight years out of ten and for the US share market it’s roughly seven years out of 10. So getting too hung up worrying about the next two or three years in 10 that the market will fall risks missing out on the seven or eight years out of 10 when it rises.
# 8 Keep it simple stupid
Investing should be simple, but we have a knack for overcomplicating it. And it’s getting worse with more options, more information, more apps and platforms, more opportunities for gearing and more rules & regulations around investing. But when we overcomplicate investments we can’t see the wood for the trees. You spend too much time on second order issues like this share versus that share or this fund manager versus that fund manager, so you end up ignoring the key driver of your portfolio’s performance – which is its high-level asset allocation across shares, bonds, property, etc. Or you have investments you don’t understand or get too highly geared. So, it’s best to keep it simple, don’t fret the small stuff, keep the gearing manageable and don’t invest in products you don’t understand.
# 9 You need to know yourself to succeed at investing
We all suffer from the psychological weaknesses referred to earlier. But smart investors are aware of them and seek to manage them. One way to do this is to take a long-term approach to investing. But this is also about knowing what you want to do. If you want to take a day to day role in managing your investments then regular trading and/or a self managed super fund (SMSF) may work, but you need to recognise that will require a lot of effort to get right and will need a rigorous process. If you don’t have the time and would rather do other things like sailing, working at your day job, or having fun with the kids then it may be best to use managed funds. It’s also about knowing how you would react if your investment suddenly dropped 20% in value. If your reaction were to be to want to get out then you will either have to find a way to avoid that as you would just be selling low and locking in a loss or if you can’t then you may have to consider an investment strategy offering greater stability over time (which would probably mean accepting lower returns).
So what does all this mean for investors?
All of this underpins what I call the Nine Keys to Successful Investing which are:
-
Make the most of the power of compound interest. This is one of the best ways to build wealth and this means making sure you have the right asset mix.
-
Don’t get thrown off by the cycle. The trouble is that cycles can throw investors out of a well thought out investment strategy. But they also create opportunities.
-
Invest for the long term. Given the difficulty in getting market and stock moves right in the short-term, for most it’s best to get a long-term plan that suits your level of wealth, age, tolerance of volatility, etc, and stick to it.
-
Diversify. Don’t put all your eggs in one basket. But also, don’t over diversify as this will just complicate for no benefit.
-
Turn down the noise. After having worked out a strategy thats right for you, it’s important to turn down the noise on the information flow and prognosticating babble now surrounding investment markets and stay focussed. In the digital world we now live in this is getting harder.
-
Buy low, sell high. The cheaper you buy an asset, the higher its prospective return will likely be and vice versa.
-
Beware the crowd at extremes. Don’t get sucked into the euphoria or doom and gloom around an asset.
-
Focus on investments that you understand and that offer sustainable cash flow. If it looks dodgy, hard to understand or has to be based on odd valuation measures or lots of debt to stack up then it’s best to stay away.
-
Seek advice. Given the psychological traps we are all susceptible too and the fact that investing is not easy, a good approach is to seek advice.
Source: AMP Capital 6 June 2019
Important notes: While every care has been taken in the preparation of this article, AMP Capital Investors Limited (ABN 59 001 777 591, AFSL 232497) and AMP Capital Funds Management Limited (ABN 15 159 557 721, AFSL 426455) (AMP Capital) makes no representations or warranties as to the accuracy or completeness of any statement in it including, without limitation, any forecasts. Past performance is not a reliable indicator of future performance. This article has been prepared for the purpose of providing general information, without taking account of any particular investor’s objectives, financial situation or needs. An investor should, before making any investment decisions, consider the appropriateness of the information in this article, and seek professional advice, having regard to the investor’s objectives, financial situation and needs. This article is solely for the use of the party to whom it is provided and must not be provided to any other person or entity without the express written consent of AMP Capital.
RBA cuts rates to a new record low – why?
As had become widely expected in the past two weeks the Reserve Bank of Australia has cut the official cash rate by 0.25% which takes it to 1.25%.
This is the first move in official interest rates since August 2016 but is the 13th rate cut in this rate cutting cycle that started back in November 2011 when rates were 4.75%.
Read MoreAs had become widely expected in the past two weeks the Reserve Bank of Australia has cut the official cash rate by 0.25% which takes it to 1.25%.

This is the first move in official interest rates since August 2016 but is the 13th rate cut in this rate cutting cycle that started back in November 2011 when rates were 4.75%. (It’s not a new rate cutting cycle as rates have not been raised since they started to fall in 2011.) This takes the cash rate to a record low 1.25% in the longest easing cycle on record. Assuming banks cut their rates by 0.25% it will take deposit rates to their lowest since the mid-1950s and headline mortgage rates to their lowest since the early 1950s, although some mortgage rates are already at record lows.

The cash rate line shows authorised dealers’ rates & 90-day bill rates up until the early 1980s. The chart assumes all rates fall 0.25% in May. Source: RBA
So what’s driven this? Will it help the economy? How low might rates go? And what does it mean for investors?
What drove the rate cut?
Put simply economic growth has slowed sharply below its long-term potential reflecting the housing downturn, but other factors from drought to the threat to global growth from the US trade wars cloud the outlook. This in turn has seen the outlook for unemployment deteriorate – at a time when there is still a high combined level of unemployed and underemployed (at 13.7% of the workforce). Which in turn threatens to keep wages growth low and inflation below the RBA’s 2-3% inflation target for even longer. Reflecting this the RBA has revised down sharply its growth and inflation forecasts over the past six months and now doesn’t see inflation rising above 2% out to 2021 even with the technical assumption of two rate cuts. The RBA has concluded that it needs much lower unemployment than the 5% or so recently seen to get inflation back to target. But recent indicators point to rising unemployment. Hence the RBA has returned to cutting the cash rate to help boost growth.
What’s driving low inflation?
Inflation was just 1.3% over the year to the March quarter. Abstracting from volatile items, underlying inflation is just 1.4%. This reflects a combination of weak demand, high levels of spare capacity & underutilised workers, intense competition, technological innovation & softish commodity prices. The problem is that inflation has been undershooting RBA forecasts and the inflation target for some time, threatening its credibility.

Source: RBA, Bloomberg, AMP Capital
What’s wrong with low inflation anyway?
Surely low price rises or falling prices are good. So, many have suggested the RBA should just lower its inflation target. Such arguments are nonsense. First, the whole point of having an inflation target is to anchor inflation expectations. If the target is just moved each time it’s breached then those expectations will blow around. There would be no point having an inflation target.
Second, there are problems with allowing too-low inflation. Statistical measures of inflation tend to overstate actual inflation by 1-2% because statisticians have trouble adjusting for quality improvements. And targeting too low an inflation rate could mean we are knocked into deflation in an economic downturn.
Third, deflation is not good if its associated with falling wages, rising unemployment, falling asset prices and rising real debt burdens – particularly when debt levels are high. It risks a debt deflation spiral of falling asset prices & incomes leading to rising debt burdens and defaults, and more falls in asset prices, etc.
Finally, targeting very low inflation gives central bankers less flexibility to achieve easy monetary policy in downturns as they have limited ability to achieve negative real interest rates.
More simply, low inflation is synonymous with low wages growth and this is contributing to a sense of dissatisfaction in the community. Getting both up to more normal levels is desirable.
It’s global not just local
While its natural to assess the RBA in isolation it’s clear that it is being caught up in global forces. The weakness in inflation is evident globally and reflects the same drivers as in Australia. Combine this ongoing softness in inflation with the latest threat to global growth – from Trump’s trade wars – and bond yields have pushed to new record lows globally. Reflecting this Australia bond yields have also been pushed to a new record low. So, the RBA is really just ratifying global market forces!

Source: Global Financial Data, AMP Capital
How far will the RBA cut rates?
Rate cuts are a bit like cockroaches. If you see one there is normally another nearby. We expect another 0.25% rate cut in July or August and two more rate cuts by mid next year taking the cash rate to 0.5%. We had thought 1% would mark the low and positive signs regarding residential property prices are helpful in this regard. But the flow of weak economic data and increasing risks to the global outlook with Trump’s trade wars and the slowing jobs market pointing to unemployment rising to 5.5% by year end make it hard to see just two rates cuts being enough, given that the RBA really needs to see unemployment fall to 4% or below to get inflation back to target.
But will the banks pass on RBA rate cuts?
With the recent reduction in bank funding costs meaning that last year’s 0.1-0.15% mortgage rate hikes should now be reversed and nearly 90% of bank deposits on interest rates above 0.5% (and hence able to be cut) we expect most banks to pass on all or the bulk of the RBA’s cut to customers. Short of a funding cost blow out, the interest rate structure on deposits should allow the bulk of subsequent cuts to be passed through but this may diminish as the cash rate reaches 0.5%.
But will more rate cuts help anyway?
Various arguments have been put up against RBA rate cuts: it should “preserve its fire power till it’s really needed”; “rate cuts haven’t helped so far so why should more cuts help”; “low rates won’t help as they cut the spending power of retirees and many of those with a mortgage just maintain their payments when rates fall”. However, looking at these in turn:
First, waiting till rate cuts are “really needed” risks leaving it too late as by then the economy will be in recession – monetary policy needs to be forward looking.
Second, rate cuts have helped the economy rebalance after the end of the mining investment boom by supporting non-mining spending. If the cash rate was still 4.75% and mortgage rates 7.5% the economy would have long ago gone into recession.
Finally, the level of household debt is more than double that of household deposits, so the household sector is a net beneficiary of lower interest rates. The responsiveness to changes in spending power for a family with a mortgage is far greater than for retirees. And, even if many with a mortgage just let their debt get paid off faster in response to falling rates this provides an offset to the negative wealth effect of the fall in house prices, reducing pressure to cut spending. And RBA rate cuts help keep the $A lower. So, while rate cuts may not be as potent with higher household debt levels and tighter lending standards, they should provide some help for households with a mortgage and for businesses that compete internationally.
Should the RBA do quantitative easing?
As the cash rate falls, we are likely to see an increasing debate around whether the RBA will use quantitative easing – ie using printed money to buy bonds to inject cash into the economy. QE is not our base – as we don’t think things are that bad – but as has been the case at other major central banks the RBA is likely to prefer exhausting cash rate cuts before considering QE and this is unlikely until it gets the cash rate down to 0.5% (beyond which lower rates will be a negative for the banks). QE is an option but to the extent that it lowers 10-year bond yields it may not help much in Australia as most household borrowing is on short term rates. It’s also debatable as to whether QE was the best approach globally. A more efficient and fairer option may be for the RBA to work with the Federal Government to provide direct financing of government spending or “cheques in the mail” to households with use by dates. This is often referred to as “helicopter money”. Such stimulus would be guaranteed to boost inflation! Hopefully, it won’t come that, and we don’t think it will but it’s an option. In the meantime, more fiscal stimulus could take some pressure off the RBA.
Implications for investors?
There are a number of implications for investors from the continuing fall in interest rates. First, low interest rates will remain in place for some time keeping bank deposit rates unattractive so it’s important for investors in bank deposits to assess alternative options. Second, the low interest rate environment means the chase for yield is likely to continue supporting commercial property, infrastructure and shares offering sustainable high dividends. Eg, the grossed-up yield on shares remains far superior to the yield on bank deposits. Investors need to consider what is most important – getting a decent income flow from their investment or absolute stability in the capital value of that investment. Of course, the equation will turn less favourable if economic growth weakens too much.

Source: RBA, Bloomberg, AMP Capital
Third, the earlier than expected rate cut will likely contribute along with the election result and other recent moves to an earlier bottom in Australian house prices. However, with still high debt levels, tight lending conditions and rising unemployment it’s unlikely to set off another property boom.
Finally, RBA rate cuts will help keep the $A down in the face of already high short $A positions, strong iron ore prices and rising risks that the Fed will cut rates this year.
If you would like to discuss any of the issues raised by Dr Oliver, please call on |PHONE| or email |STAFFEMAIL|.
Source: AMP Capital 4 June 2019
Important notes: While every care has been taken in the preparation of this article, AMP Capital Investors Limited (ABN 59 001 777 591, AFSL 232497) and AMP Capital Funds Management Limited (ABN 15 159 557 721, AFSL 426455) (AMP Capital) makes no representations or warranties as to the accuracy or completeness of any statement in it including, without limitation, any forecasts. Past performance is not a reliable indicator of future performance. This article has been prepared for the purpose of providing general information, without taking account of any particular investor’s objectives, financial situation or needs. An investor should, before making any investment decisions, consider the appropriateness of the information in this article, and seek professional advice, having regard to the investor’s objectives, financial situation and needs. This article is solely for the use of the party to whom it is provided and must not be provided to any other person or entity without the express written consent of AMP Capital.
The trade war is back – what went wrong, what it means for share markets and Australia
After taking a back seat over the last six months as negotiations appeared to make progress the US/China trade war is back on with the President Trump – “tariff man” – ramping up tariffs on Chinese imports again and threatening more and China moving to retaliate. This note takes a simple Q & A approach to the key issues.
What is Read More
After taking a back seat over the last six months as negotiations appeared to make progress the US/China trade war is back on with the President Trump – “tariff man” – ramping up tariffs on Chinese imports again and threatening more and China moving to retaliate. This note takes a simple Q & A approach to the key issues.

What is a trade war?
A trade war is where countries raise barriers to trade with each other (such as tariffs or quotas on imports or subsidies to domestic industries) usually motivated by a desire to “protect” domestic jobs often overlaid with (or dressed up by) “national security” motivations. To be a “trade war” the barriers need to be significant in terms of their size and the proportion of imports covered. The best known global trade war was that of 1930 where average 20% tariff hikes on US imports led to retaliation by other countries and contributed to a plunge in world trade.
What is so good about free trade and wrong with protectionism?
A basic concept in economics is comparative advantage: that if Country A and B are both equally good at making Product X but Country B is best at making Product Y then they will be best off if A makes X and B makes Y. Put simply free trade leads to higher living standards and lower prices whereas restrictions on trade lead to lower living standards and higher prices.
It often strikes me as perverse that some want to protect local industry, but they don’t buy local themselves. The experience of heavily protecting Australian industry in the post WW2 period was that it was just leading to higher prices and lower quality products and Australians were voting with their wallets to buy better value foreign made goods anyway. We and many other countries started to realise this in the 1980s and so cut protection. We might have protected lots of manufacturing jobs if we stayed at the levels of protection of 45 years ago, but we would have become a museum piece as would the US.
Fortunately, despite the loss of jobs in manufacturing (from 25% of the workforce in 1960 to around 8% now) other jobs have come along in the services sector where Australia’s and America’s relatively highly-skilled but highly-paid workforce have a comparative advantage compared to workers in less developed countries.
In short, if you want to support your country’s products buy them, but trade barriers don’t work.
Why is President Trump raising tariffs then?
It’s basically about fulfilling a presidential campaign commitment to “protect” American workers from what he regards as unfair trading practices in countries that the US has a trade deficit with – notably China. And he knows this is popular with his supporters but there is also some degree of bi-partisan support for taking on China.
What does President Trump want?
While it’s been feared at times that Trump was willing to get into trade wars with any country that the US has a trade deficit with his main focus is China. Basically he wants China to lower its tariffs, allow better access for US companies, end US companies being forced to hand over their technologies and protect intellectual property of US companies. At a high level he wants a reduction in America’s trade deficit with China. Along the way he has renegotiated the NAFTA free trade agreement with Mexico and Canada and the free trade deal with South Korea and is in talks with Europe and Japan.
Where are we now?
Fears of a global trade war were kicked off in March last year with Trump’s announcement of a 10% tariff on aluminium imports and a 25% tariff on steel imports. US allies were subsequently exempted but China was not. On March 22 Trump announced 25% tariffs on $US50bn of US imports from China. These were implemented in July and August. After Chinese retaliation Trump announced a 10% tariff on another $US200bn of imports from China (implemented in September) which would increase to 25% on January 1 this year. The latter was delayed to March 1 in response to trade talks and then was delayed further as the talks made progress.
Last year’s tariff increases took the weighted average tariff across all imports to the US from around 1.8% to around 3% which took the US above the developed country average of around 2% but not dramatically so.
However, on May 10 the delayed tariff hike from 10% to 25% on $US200bn of imports from China was put in place and the US kicked off a process to tariff the remaining roughly $US300bn of imports from China at 25%. If fully implemented this would take the average US tariff rate on imports to around 7.5%, which is significant (albeit minor compared to the 20% tariff hikes of 1930.) See the next chart.
Average weighted tariff rate across all products
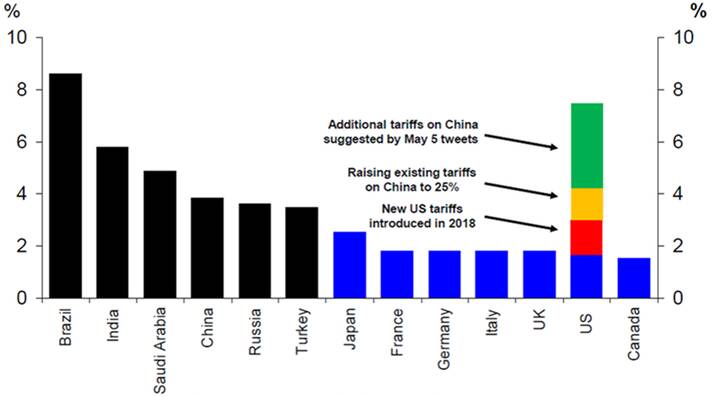
click to enlarge
Source: World Bank, Deutsche Bank Research
Along the way China has retaliated with a 10% tariff on $US60bn of imports from the US and in response to the latest move has announced this will be raised to as high as 25%. Its retaliation has been less than proportional partly reflecting lower imports from the US but it has also so far refrained from retaliating via other means such as selling US bonds (possibly because it could just depress the $US) and making life tougher for US companies.
At the same time the US is considering auto tariffs after a report lodged in February. A decision is due by May 18 but could be delayed given talks with the US and Japan.
What happened to the US/China trade talks?
Up until a week or so ago the trade talks were reportedly going well – with key elements reportedly agreed and only disagreement remaining about when tariffs would be removed and enforcement. But President Trump’s May 5 tweets announcing a resumption of tariff hikes with more to come was supposedly in response to China back tracking on what had been agreed. There has been much speculation about what happened: maybe negotiators agreed more than was politically acceptable to China’s leadership, maybe China saw it as two big a step down given Trump’s often perceived insulting approach, maybe they misjudged what he would agree to, maybe Trump’s resort to threats is just more “Art of the Deal” stuff to get what he wants and to prove that he is standing up for his base. Who knows for sure! But it’s likely that both sides may have become emboldened by better economic data and share markets this year, and so have decided to take risks again. Ongoing or rising tensions around Huawei, North Korea, Iran (with the US ending sanction waivers on China importing Iranian oil) and Taiwan are probably not helping the issue either.
What will be the economic impact?
Contrary to President Trump’s assertions China is not paying the tariffs being collected on imports from China. China will ultimately suffer if there is less demand for its exports but most of the cost is borne by US businesses or passed on to consumers. Taxing all US imports from China at 25% would be a big deal compared to last year’s tariffs and see the impact shift to largely consumer goods as opposed to industrial and intermediate goods in the first tariff rounds. Which in turn could add around 0.2% to core inflation and detract up to 0.75% from US GDP particularly as investment gets hit in response to uncertainty about supply chains. Given the flow on to slower global growth (which is where Australia could be impacted), hopefully the latest tariff hikes will be short-lived and the extra tariffs will be avoided.
What is the most likely outcome?
Our base case remains that the US and China will ultimately reach a deal to resolve the issue before too much damage is caused – once both sides refocus on the economic costs of slower growth, higher consumer prices and potentially rising unemployment. This is particularly relevant for President Trump given his desire to get re-elected next year as rising prices at Walmart and rising unemployment will drive a backlash. However, things could still get worse before they get better.
Why have share markets reacted relatively calmly? Can it last?
Since President Trump’s tweets announcing a resumption of the trade war, US and global shares have fallen about 4.5% and Australian shares have lost 1.7%. Chinese shares have been hit harder reflecting their greater vulnerability. But overall the falls have been benign compared to last year’s sharp falls (and they followed a sharp rebound so far this year). This likely reflects a combination of: investor optimism of a deal to resolve the issue; last years’ experience where the worst case fears of tariff hikes did not come to pass; hopes for more Chinese economic stimulus to offset the negative impact; and perceptions that the Fed is more supportive of growth now compared to last year when it was more worried about inflation. Australian shares have also been helped by their high exposure to defensive high yield stocks and ongoing strength in the iron ore price.
While our view remains that a deal will ultimately be reached and that this will see shares end the year higher than they are now, the risks have ramped up again after the setback in the talks and the associated loss of trust on both sides so investors need to allow that the trade war could again get worse before it gets better risking further short-term weakness in share markets. In fact, sharper share market falls may be needed to remind the US and China of the need for a deal.
What does it all mean for Australia?
Fortunately, Australian’s aren’t having to pay higher taxes on imports like Americans, but the main risk is that we are indirectly affected if the trade war is not quickly resolved and this drags down global growth weighing on demand for our exports leading to unemployment pushing higher than our 5.5% forecast for year end. The risk of this adds in turn to pressure on the RBA to cut interest rates, although we think they will do that anyway.
What to watch?
Key to watch for will be a continuation of trade talks. So far, the indications are mixed. The June 28 G20 meeting in Tokyo may be critical in terms of providing an opportunity for Trump and Xi to get negotiations back on track, with Trump saying that they will meet.
Please call us on |PHONE if you would like to discuss.
Source: AMP Capital 13 May 2019
Important notes: While every care has been taken in the preparation of this article, AMP Capital Investors Limited (ABN 59 001 777 591, AFSL 232497) and AMP Capital Funds Management Limited (ABN 15 159 557 721, AFSL 426455) (AMP Capital) makes no representations or warranties as to the accuracy or completeness of any statement in it including, without limitation, any forecasts. Past performance is not a reliable indicator of future performance. This article has been prepared for the purpose of providing general information, without taking account of any particular investor’s objectives, financial situation or needs. An investor should, before making any investment decisions, consider the appropriateness of the information in this article, and seek professional advice, having regard to the investor’s objectives, financial situation and needs. This article is solely for the use of the party to whom it is provided and must not be provided to any other person or entity without the express written consent of AMP Capital.
Seasonal patterns in shares – should we “sell in May and go away” and what about renewed trade war fears?
Since late last year share markets have rebounded with US shares up 25% to their recent high, global shares up 22% and Australian shares up 17% as last year’s worries about tightening monetary policy led by the Fed, global growth and trade wars have faded to varying degrees. Following such a strong rebound some have said that maybe it’s now
Read MoreSince late last year share markets have rebounded with US shares up 25% to their recent high, global shares up 22% and Australian shares up 17% as last year’s worries about tightening monetary policy led by the Fed, global growth and trade wars have faded to varying degrees. Following such a strong rebound some have said that maybe it’s now time to “sell in May and go away” given the old share market saying. Of course, this is a reference to seasonal pattern in shares.

It’s all seasonal
Seasonal patterns have long been observed in equity markets. Yet, despite the potential they provide for astute investors to profit from them – and in so doing arbitrage them away – they seem to persist. The “January effect” has perhaps been the most famous, where January typically provides the best gains for US stocks, but anticipation of it in recent years has seen it morph into December such that it has become the strongest month of the year for US shares. However, it is part of a broader seasonal pattern, which is positive for shares from around October/November to around May and then weaker from May. This can be seen in the seasonal pattern of average monthly changes in US share prices (using the S&P 500 index) shown in the next chart.
Source: Thomson Reuters, AMP Capital
The key factor behind the seasonal pattern is the regular ebb and flow of investor demand for shares relative to their supply through the course of the year. In the case of US shares the principal drivers of the seasonal pattern are:
-
investors and mutual funds selling losing stocks to realise tax losses (to offset against capital gains) towards the end of the US tax year in September. This is also normally at a time when capital raisings are solid;
-
investors buying back in November and December at a time when capital raisings wind down into year-end;
-
which then combines with the tendency for investors to invest bonuses early in the new year, new year optimism as investors refocus on the future, put any disappointments of the past year behind them and down play bad news all at a time when capital raisings are relatively low. The illiquid nature of investment markets around late December and January (due to holidays) makes these effects all the more marked.
The net effect has been that the US share market is relatively weak around the September quarter, strengthens into the new year with January often being the strongest month and then remains solid out to around May by which point new year optimism starts to fade a bit. As noted earlier, in recent years anticipation of the “January effect” has caused buying to pull it forward into December. Calendar year end window dressing by fund managers may have also added to this tendency. Since 1985 US share prices for December have had an average monthly gain of 1.5% monthly gain. This compares to an average monthly gain across all months of 0.76%. By contrast August and September are the weakest months with falls on average.
Consistent with the influence of the US share market on global markets generally, along with specific local influences, this seasonal pattern is also discernible in other countries, including Europe, Asia and Australia. In Australia the January or now December effect is not as dominant as in the US, possibly because tax effects are not relevant in Australia around that time of year. The seasonal pattern for the Australian stock market is shown in the next chart. While the strongest months of the year in the Australian market are April and July, December also tends to provide above average gains. Since 1985, Australian share price gains in December have averaged 2.1%, with April averaging 2.3% and July 2.2%. This compares to an average monthly gain for all months of 0.61%. (Note that the lower average monthly gain for all months in Australia compared to the US partly reflects the fact that a greater proportion of the return from Australian shares comes from a higher dividend yield compared to the US.)
Source: Thomson Reuters, AMP Capital
In Australia, tax loss selling may explain the weakness often observed in May and June and the strength often seen in July, given that the Australian tax year ends in June.
“Sell in May & go away, buy again on St Leger’s Day”
As a result of this monthly behaviour a typical pattern through the year is for stocks to strengthen from around October/November until around May (or July in Australia’s case) of the next year and then weaken into September/October (and November for Australian shares). This seasonal pattern can clearly be seen in the following chart which shows an index for US and Australian shares and the month to month pattern of share prices after the longer term fundamentally driven trend is removed.
Source: Thomson Reuters, AMP Capital
Breaking the year into two six-month periods also reflects this pattern. Since 1970, the average total return (ie, from price gains and dividends) from US shares from end November to end May is more than double that from end May to end November. A similar pattern exists in Australia, Asia and for global shares as shown in the next chart.

Source: Thomson Reuters, AMP Capital
While the US influence may be playing a big role in the continuation of this seasonal pattern in shares, the old saying in its full form of “sell in May and go away, buy again on St Leger’s Day” has its origins in the UK as St Leger’s Day is a UK horse race on the second Saturday in September suggesting that the seasonal pattern in shares dates back to the UK. In fact it may have its origins in crop cycles with grain merchants having to sell their shares at the end of the northern summer to buy the summer crop (which depresses shares around August/September) and they then bought back in after they sold the crop on to mills. Of course, that’s not so relevant to today. So, the explanation discussed earlier explains why it likely persists.
Qualifications
There is no guarantee that seasonal patterns will always prevail. They can be overwhelmed when contrary fundamental influences are strong, so they don’t apply in all years. For example, while Decembers are on average strong months in the US and Australia that wasn’t the case last December and not all years see weakness in the May to October/November period. However, they nevertheless provide a reasonable guide to the monthly rhythm of markets that investors should ideally be aware of. In simplistic terms, around May (and July in Australia) is perhaps not the best time to be piling into shares and around September to November is not the best time to be selling them.
What about now?
For the year as a whole we see shares doing okay. Valuations are okay helped in part by very low bond yields, global growth is expected to improve into the second half of the year and monetary and fiscal policy has become more supportive of markets all of which should support decent gains for share markets through 2019 as a whole.
However, from their December lows, shares – globally and in Australia – have run hard and fast and so are vulnerable to a short-term correction. Still soft global growth indicators and the latest flare up regarding US and China trade could provide triggers.
President Trump’s latest threat to increase the tariff on $US200bn of imports from China from 10% to 25% (delayed from January) and his threat to look at taxing remaining imports from China too suggest that the latest round of US/China trade talks in China did not go as well as planned and looks aimed at putting pressure on China to resolve the talks. Ultimately, we remain of the view that there will be a resolution given the economic damage not doing so would cause, particularly ahead of Trump’s re-election bid next year (US presidents don’t get re-elected when unemployment is rising). But the latest threat adds to the risk of market weakness in the short term, particularly if China delays a trip to the US to continue the negotiations in response to Trump’s threat.
In Australia, uncertainty around the impact of various tax increases if there is a change of Government in the upcoming Federal election could cause short-term nervousness for the Australian share market.
Of course, long term investors should look through all this.
Please call us on |PHONE| if you would like to discuss.
Source: AMP Capital 06 April 2019
Important notes: While every care has been taken in the preparation of this article, AMP Capital Investors Limited (ABN 59 001 777 591, AFSL 232497) and AMP Capital Funds Management Limited (ABN 15 159 557 721, AFSL 426455) (AMP Capital) makes no representations or warranties as to the accuracy or completeness of any statement in it including, without limitation, any forecasts. Past performance is not a reliable indicator of future performance. This article has been prepared for the purpose of providing general information, without taking account of any particular investor’s objectives, financial situation or needs. An investor should, before making any investment decisions, consider the appropriateness of the information in this article, and seek professional advice, having regard to the investor’s objectives, financial situation and needs. This article is solely for the use of the party to whom it is provided and must not be provided to any other person or entity without the express written consent of AMP Capital.
Inflation undershoots in Australia – why it’s a concern, is the RBA running out of ammo & what it means for investors?
Surprisingly weak Australian inflation has led to expectations the Reserve Bank will soon cut rates. But what’s driving low inflation? Is it really that bad? Why not just lower the inflation target? Will rate cuts help?And what does it mean for investors?
Inflation surprises on the downside againAustralian inflation as measured by the CPI was flat in the March quarter and
Read MoreSurprisingly weak Australian inflation has led to expectations the Reserve Bank will soon cut rates. But what’s driving low inflation? Is it really that bad? Why not just lower the inflation target? Will rate cuts help?And what does it mean for investors?

Inflation surprises on the downside again
Australian inflation as measured by the CPI was flat in the March quarter and up just 1.3% over the last year. Sure, the zero outcome in the quarter was partly due to a nearly 9% decline in petrol prices and they have since rebounded to some degree. And high-profile items like food, health and education are up 2.3%, 3.1% and 2.9% respectively from a year ago. But against this price weakness is widespread in areas like clothing, rents, household equipment & services and communications.

Source: ABS, AMP Capital
But why the focus on “underlying inflation”?
The increase in the CPI is the best measure of changes in the cost of living. But it can be distorted in the short term by often volatile moves in some items that are due to things like world oil prices, the weather and government administered prices that are unrelated to supply and demand pressures in the economy. So, economists and policy makers like the RBA focus on what is called underlying inflation to get a handle on underlying price pressures in the economy so as not to jump at shadows. There are various ways of measuring this ranging from excluding items like food and energy as in the US version of core inflation, to excluding items whose prices are largely government administered to statistical measures that exclude items that have volatile moves in each quarter (as with the trimmed mean and weighed median measures of inflation). Right now they all show the same thing ie that underlying inflation is low ranging between 1.2% to 1.6% year on year. The average of the trimmed mean and weighted median measures is shown in the previous chart and is averaging 1.4%. The common criticism of underlying inflation that “if you exclude everything there is no inflation” is funny but irrelevant. The point is that both headline and underlying inflation are below the RBA’s 2-3% target and this has been the case for almost four years now.
What is driving low inflation?
The weakness in inflation is evident globally. Using the US definition, core (ex food & energy) inflation is just 1.8% in the US, 0.8% in the Eurozone, 0.4% in Japan and 1.8% in China.

Sources: Bloomberg, AMP Capital
Several factors have driven the ongoing softness in inflation including: the sub-par recovery in global demand since the GFC which has left high levels of spare capacity in product markets and underutilisation of labour; intense competition exacerbated by technological innovation (online sales, Uber, Airbnb, etc); and softish commodity prices. All of which has meant that companies lack pricing power & workers lack bargaining power.
Why not just lower the inflation target?
Some suggest that the RBA should just lower its inflation target. This reminds me of a similar argument back in 2007-08, when inflation had pushed above 4%, that the RBA should just raise its inflation target. Such arguments are nonsense. First, the whole point of having an inflation target is to anchor inflation expectations. If the target is just raised or lowered each time it’s breached for a while then those expectations – which workers use to form wage demands and companies use in setting wages and prices – will simply move up or down depending on which way inflation and the target moves. And so inflationary or deflationary shocks will turn into permanent shifts up or down in inflation. Inflation targeting would just lose all credibility.
Second, there are problems with allowing too-low inflation. Most central bank inflation targets are set at 2% or so because statistical measures of inflation tend to overstate actual inflation by 1-2% because statisticians have trouble actually adjusting for quality improvements and so some measured price rises often reflect quality improvements. In other words, 1.3% inflation as currently measured could mean we are actually in deflation. And there are problems with deflation.
What’s wrong with falling prices (deflation) anyway?
Deflation refers to persistent and generalised price falls. It occurred in the 1800s, 1930s and the last 20 years in Japan. Most people would see falling prices as good because they can buy more with their income. However, deflation can be good or bad. In the period 1870-1895 in the US, deflation occurred against a background of strong growth, reflecting rapid technological innovation. This can be called “good deflation”. However, falling prices are not good if they are associated with falling wages, rising unemployment, falling asset prices and rising real debt burdens. For example, in the 1930s and more recently in Japan. This is “bad deflation”. Given high debt levels, sustained deflation could cause big problems. Falling wages and prices would make it harder to service debts. Lower nominal growth will make high public debt levels harder to pay off. And when prices fall people put off decisions to spend and invest, which could threaten economic growth. This could risk a debt deflation spiral of falling asset prices and falling incomes leading to rising debt burdens, increasing defaults, spurring more falls in asset prices, etc.
The problem for RBA credibility?
The problem for the RBA is that inflation has been undershooting its forecasts and the target for several years now. The longer this persists the more the RBA will lose credibility, seeing low inflation expectations become entrenched making it harder to get inflation back to target and leaving Australia vulnerable to deflation in the next economic downturn.

Source: RBA, Bloomberg, AMP Capital
Due to the slowdown in economic growth flowing partly from the housing downturn we have been looking for two rate cuts this year since last December. We had thought that the RBA would prefer to wait till after the election is out of the way before starting to move and coming fiscal stimulus from July also supports the case to wait as does the still strong labour market. However, with underlying inflation coming in much weaker than expected the RBA its arguably too risky to wait until unemployment starts to trend up. And the RBA has moved in both the 2007 and 2013 election campaigns. So, while it’s a close call our base case is now for the first rate cut to occur at the RBA’s May meeting. Failing that, then in June.
Will the banks pass on RBA rate cuts?
This has been an issue with all rate cuts since the GFC due to a rise in bank funding costs. But most cuts have been passed on largely or in full (the average pass through since the Nov 2011 cut has been 89%), notwithstanding out of cycle hikes. Short term funding costs have fallen lately pointing to a reversal of last year’s 0.1 to 0.15% mortgage rate hikes or at least the banks having little excuse not to pass on any RBA cuts in full.
But will more rate cuts help anyway?
Some worry that rate cuts won’t help as they cut the spending power of retirees and many of those with a mortgage just maintain their payments when rates fall. However, there are several points to note regarding this. First, the level of household deposits in Australia at $1.1 trillion is swamped by the level of household debt at $2.4 trillion. So the household sector is a net beneficiary of lower interest rates. Second, the responsiveness to changes in spending power for a family with a mortgage is far greater than for retirees. Third, even if many with a mortgage just let their debt get paid off faster in response to falling rates this still provides an offset to the negative wealth effect of falling house prices, reducing pressure to cut spending. Fourth, the fall in rates since 2011 has helped the economy keep growing as mining investment collapsed. And of course, RBA rate cuts help push the $A lower. So, while rate cuts may not be as potent with higher household debt levels today and tighter bank lending standards, they should provide some help.
Is the RBA out of ammo?
This is a common concern around major central banks. However, they are a long way from being unable to do anything: the Fed can reverse the 9 rate hikes seen since December 2015 and start quantitative easing again if needed; and both the ECB and Bank of Japan could expand their QE programs. The ultimate option is for central banks to provide direct financing of government spending or tax cuts using printed money. This is often referred to as “helicopter money”. Fortunately, non-traditional monetary policy has worked in the US and so at least these concerns are unlikely to need to be tested. Of course, the RBA still has plenty of scope to cut interest rates if needed (there is 150 basis points to zero) and it could still do quantitative easing if needed so it’s a long way from being out of ammo (not that we think it needs to do a lot more anyway).
Implications for investors?
There are a number of implications for investors. First, low interest rates will remain in place for some time keeping bank deposit rates unattractive. Second, given the absence of inflationary pressure, a 1994-style bond crash remains distant.
Third, the low interest rate environment means the chase for yield is likely to continue supporting commercial property, infrastructure and shares offering sustainable high dividends.
Fourth, an earlier RBA rate cut may bring forward the timing of the bottom in Australian house prices.
Finally, as can be seen in the next chart, low inflation is generally good for shares as it allows shares to trade on higher price to earnings multiples. But deflation tends to be bad for shares as it tends to go with poor growth and profits and as a result shares trade on lower PEs. The same would apply to assets like commercial property and infrastructure.

Source: Global Financial Data, Bloomberg, AMP Capital
Source: AMP Capital 29 April 2019
Important notes: While every care has been taken in the preparation of this article, AMP Capital Investors Limited (ABN 59 001 777 591, AFSL 232497) and AMP Capital Funds Management Limited (ABN 15 159 557 721, AFSL 426455) (AMP Capital) makes no representations or warranties as to the accuracy or completeness of any statement in it including, without limitation, any forecasts. Past performance is not a reliable indicator of future performance. This article has been prepared for the purpose of providing general information, without taking account of any particular investor’s objectives, financial situation or needs. An investor should, before making any investment decisions, consider the appropriateness of the information in this article, and seek professional advice, having regard to the investor’s objectives, financial situation and needs. This article is solely for the use of the party to whom it is provided and must not be provided to any other person or entity without the express written consent of AMP Capital.

