

Olivers Insights
The US economy – does the flattening yield curve indicate recession is imminent?
Ever since the Global Financial Crisis (GFC) there has been an obsession with looking for the next recession. In this regard, over the last year or so there has been increasing concern that a flattening yield curve in the US – ie the gap between long-term bond yields and short-term borrowing rates has been declining – is signalling a downturn
Read MoreEver since the Global Financial Crisis (GFC) there has been an obsession with looking for the next recession. In this regard, over the last year or so there has been increasing concern that a flattening yield curve in the US – ie the gap between long-term bond yields and short-term borrowing rates has been declining – is signalling a downturn and, if it goes negative, a recession in the US. This concern naturally takes on added currency given that the current US bull market and economic expansion are approaching record territory in terms of duration and given the trade war threat.

The increased volatility in shares seen this year, including a 10% or so pull back in global shares earlier this year, adds to these fears. Whether the US is about to enter recession is critical to whether the US (and hence global) bull market in shares is about to end. Looking at all 10% or greater falls in US shares since the 1970s (see the table in Correction time for shares?), US share market falls associated with a US recession are longer lasting and deeper with an average duration of 16 months and an average fall of 36% compared to a duration of 5 months and an average fall of 14% when there is no recession. Similarly, Australian share market falls are more severe when there is a US recession. So, whether a recession is imminent or not in the US is critically important in terms of whether a major bear market is imminent. This note assesses the risks.
The long US economic expansion and bull market
The cyclical bull market in US shares is now over nine years old. This makes it the second longest since WW2 and the second strongest in terms of percentage gain. And according to the US National Bureau of Economic Research the current US economic expansion is now 109 months old and compares to an average expansion of 58 months since 1945. See the next two tables. So, with the bull market and the economic expansion getting long in the tooth it’s natural to ask whether it will all soon come to an end with a major bear market.


The yield curve flattens – but it’s complicated
The yield curve is watched for two reasons. First, it’s a good guide to the stance of monetary policy. When short-term interest rates are low relative to long-term rates it indicates businesses can borrow short and lend (or invest) long & this grows the economy. But it’s not so good when short rates are above long rates – or the curve is inverted. And secondly an inverted US yield curve has preceded US recessions. So, when it’s heading in this direction some start to worry. However, there are several complications.
First, which yield curve? Much focus has been on the gap between 10-year bond yields and 2-year bond yields which has flattened to just 0.3%, but the Fed has concluded that the traditional yield curve based on the gap between 10-year bond yields and the Fed Funds rate is a better predictor of the economy and it has flattened but only to 1%. Moreover, a shorter yield curve based on the gap between 2-year bond yields and the Fed Funds rate predicted past recessions like the longer yield curves but has actually been steepening in recent years which is positive.

Second, the yield curve can give false signals – the traditional version flattened or went negative in 1986, 1995 and 1998 before rebounding – and the lags from an inverted curve to a recession can be long at around 15 months. So even if it went negative now recession may not occur until late 2020.
Third, various factors may be flattening the yield curve unrelated to cyclical economic growth expectations including still falling long-term inflation and real rate expectations, low German and Japanese bond yields holding down US yields and higher levels of investor demand for bonds post the GFC as they have proven to be a good diversifier to shares in times of crisis.
Fourth, a flattening yield curve caused by rising short term ratesand falling long term rates is arguably more negative than aflattening when both short and long term rates go up like recently.
Finally, a range of other indicators which we will now look at are not pointing to an imminent US recession.
Watch for exhaustion, not old age
A key lesson of past economic expansions is that “they do not die of old age, but of exhaustion”. The length of economic expansions depends on how quickly recovery proceeds, excess builds up, inflation rises and the central bank tightens. The US economic recovery may be long, but it has been very slow such that average economic and employment growth has been around half that seen in post WW2 expansions. So as a result it has taken longer than normal for excesses to build up. Apart from flattening yield curves one area where the US is flashing warning signs is in relation to the labour market where unemployment and underemployment have fallen about as low as they ever go warning of a wages breakout and inflation pressure.

However, there is still arguably spare capacity in the US labour market (the participation rate has yet to see a normal cyclical rise) and wages growth at 2.7% remains very low. The last three recessions were preceded by wages growth above 4%. Secondly, while US GDP is now back in line with estimates of “potential”, what is “potential” can get revised so it’s a bit dodgy and more fundamentally, industrial capacity utilisation at 78% is still below normal of 80% and well below levels that in the past have shown excess and preceded recessions.
Thirdly, cyclical spending in the US as a share of GDP remain slow. For example, business and housing investment are around long term average levels as a share of GDP in contrast to the high levels in one or both seen prior to the tech wreck and GFC.

Finally, while the rising Fed Funds rate and flattening traditional yield curve is consistent with tightening US monetary policy, it’s a long way from tight. Past US recessions have been preceded by the Fed Funds rates being well above inflation and nominal economic growth whereas it’s still a long way from either now. See the next chart.

US likely to see overheating before recession
Apart from the amber lights flashing from the flattening yield curve and very low unemployment our assessment is that a US recession is still some time away as it will take time for excesses to become extreme and US monetary policy to become tight. Looked at another way, the US is still more likely to overheat before it goes into recession. We have been thinking recession is a 2020 risk. The end of the current fiscal stimulus around then would also be consistent with this. However, given the current slow pace in terms of building excess, that 2020 is a presidential election year – do you really think Trump will allow the US to go off a fiscal cliff then? – and with 2020 being the consensus pick for a downturn, the risk is that it comes later. Of course, an escalating trade war could mess things up earlier, although we still see a negotiated solution. The rising US budget deficit is a concern but it’s more of an issue for when the economy turns down as this is when investors will start to worry about its sustainability. And of course a 1987 style share market crash cannot be ruled out but probably requires a share market blow off before hand. In the meantime, the Fed has more tightening to do and while sharemarket volatility is likely to remain high as US inflation and short rates rise, excesses gradually build and given risks around Trump and trade, with recession still a way off the US and global share bull market likely still has some way to go.
Source: AMP Capital 19 July 2018
Important notes
While every care has been taken in the preparation of this article, AMP Capital Investors Limited (ABN 59 001 777 591, AFSL 232497) and AMP Capital Funds Management Limited (ABN 15 159 557 721, AFSL 426455) makes no representations or warranties as to the accuracy or completeness of any statement in it including, without limitation, any forecasts. Past performance is not a reliable indicator of future performance. This article has been prepared for the purpose of providing general information, without taking account of any particular investor’s objectives, financial situation or needs. An investor should, before making any investment decisions, consider the appropriateness of the information in this article, and seek professional advice, having regard to the investor’s objectives, financial situation and needs. This article is solely for the use of the party to whom it is provided.
2017-18 saw strong returns for diversified investors – but there’s a few storm clouds around
The past financial year saw solid returns for investors but it was a story of two halves. While the December half year was strong as global share markets moved to factor in stronger global growth and profits helped by US tax cuts, the last six months have been messier and more constrained – with US inflation and interest rate worries,
Read MoreThe past financial year saw solid returns for investors but it was a story of two halves. While the December half year was strong as global share markets moved to factor in stronger global growth and profits helped by US tax cuts, the last six months have been messier and more constrained – with US inflation and interest rate worries, trade war fears, uncertainty around Italy, renewed China and emerging market worries and falling home prices in Australia. But will returns remain reasonable or is the volatility of the past six months a sign of things to come? After reviewing the returns of the last financial year, this note looks at the investment outlook for 2018-19 financial year.

A good year for diversified investors
The 2017-18 financial year saw yet again pretty solid returns for well diversified investors. Cash and bank deposits continued to provide poor returns and the combination of low yields and a back-up in some bond yields saw low returns from bonds. The latter resulted in mixed returns from yield sensitive investments, but Australian real estate investment trusts performed well helped by the RBA leaving rates on hold.
Reflecting strong gains in the December half as investors moved to factor in stronger global growth and profits assisted in the US by tax cuts global shares returned 11% in local currency terms and 15% in Australian dollar terms. Australian shares also performed well with the ASX 200 rising to a 10-year high and solid dividends resulting in a total return of 13%. Unlisted assets have continued to benefit from “search for yield” investor demand and faster growth in “rents” with unlisted property returning around 12% and unlisted infrastructure returning around 13.5%.
As a result, balanced growth superannuation returns are estimated to have returned around 9% after taxes and fees which is pretty good given inflation of 2%. For the last five years balanced growth super returns have also been around 8.5% pa.
click to enlarge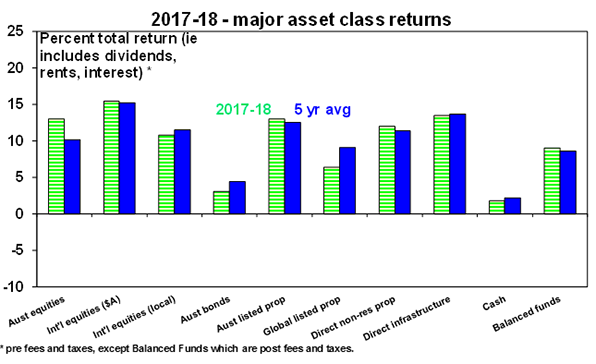
*pre fees and taxes, except Balanced Funds which are post fees and taxes
Source: Thomson Reuters, AMP Capital
Australian residential property slowed with average capital city prices down 1.6%, with prices down in Sydney, Perth and Darwin. Average returns after costs were around zero.
Key lessons for investors from the last financial year
These include:
-
Be cautious of the crowd – Bitcoin provided a classic reminder of this with its price peaking at $US19500 just when everyone was getting interested in December only to then plunge 70% in price.
-
Turn down the noise – despite numerous predictions of disaster it turned out okay.
-
Maintain a well-diversified portfolio – while cash, bonds and some yield sensitive listed assets had a tougher time, a well-diversified portfolio performed well.
-
Cash is still not king – while cash and bank deposits provided safe steady returns, they remain very low.
Expect more constrained returns and volatility
We expect returns to slow a bit over the new financial year and just as we have seen over the last six months volatility is likely to remain high. First the positives:
-
While global growth looks to have passed its peak the growth outlook remains solid. Business conditions indicators – such as surveys of purchasing managers (Purchasing Managers Indexes or PMIs) – are off their highs and point to some moderation in growth, but they remain strong pointing to solid global overall.

Source: Bloomberg, AMP Capital
In Australia, growth is likely to remain between 2.5% and 3% with strong business investment and infrastructure helping but being offset by a housing slowdown and constrained consumer spending.
-
Second, solid economic growth should continue to underpin solid profit growth from around 7% in Australia to above 10% globally
-
Third, while we are now further through the global economic cycle there is still little sign of the sort of excess that normally brings on an economic downturn – there is still spare capacity globally, growth in private debt remains moderate, investment as a share of GDP is around average or below, wages growth and inflation remain low and we are yet to see a generalised euphoria in asset prices.
-
Fourth, global monetary policy remains very easy with the Fed continuing to raise rates gradually, the ECB a long way from raising rates and tightening in Japan years away.
-
Finally, share valuations are not excessive. While price to earnings ratios are a bit above long-term averages, this is not unusual for a low inflation environment. Valuation measures that allow for low interest rates and bond yields show shares to no longer be as cheap as a year ago but they are still not expensive, particularly outside of the US.
Against this though there are a few storm clouds:
-
First, the US economy is more at risk of overheating – unemployment is at its lowest since 1969, wages growth is gradually rising and inflationary pressures appear to be picking up. The Fed is aware of this and will continue its process of raising rates. While other countries are behind the US, its share market invariably sets the direction for global markets
-
Second, global liquidity conditions have tightened compared to a year ago with central bank quantitative easing slowing down and yield curves (ie the gap between long term and short-term bond yields) flattening.
-
Third, the risks of a trade war dragging on global growth have intensified. While the share of US imports subject to recently imposed tariffs is minor so far (at around 3%) they are threatened to increase. Our base case remains that some sort of negotiated solution will be reached but trade war worries could get worse before they get better.
-
Fourth, emerging countries face various risks from several problem countries (Turkey, Brazil and South Africa), slowing growth in China, concerns the rising US dollar will make it harder for emerging countries to service their foreign debts and worries they will be adversely affected by a trade war.
-
Finally, various geopolitical risks remain notably around the Mueller inquiry in the US, the US mid-term elections and Italy heading towards conflict with the EU over fiscal policy.
A problem is that various threats around trade and Trump, Italy and China have come along at a time when the hurdle for central banks to respond may be higher than in the past – with the Fed focussed on inflation and the ECB moving to slow its stimulus and less inclined to support Italy.
What about the return outlook?
Given these conflicting forces it is reasonable to expect some slowing in returns after the very strong returns seen in the last two years. Solid growth, still easy money and okay valuations should keep returns positive, but they are likely to be constrained and more volatile thanks to the drip feed of Fed rate hikes, trade war fears, China and Emerging Market worries and various geopolitical risks. In Australia, falling home prices in Sydney and Melbourne along with tightening bank lending standards will be drags. Looking at the major asset classes:
-
Cash and bank deposit returns are likely to remain poor at around 2% as the RBA is expected to remain on hold out to 2020 at least. Investors still need to think about what they really want: if it’s capital stability then stick with cash but if it’s a decent stable income then consider the alternatives with Australian shares and real assets such as unlisted commercial property continuing to offer attractive yields.

Source: RBA; AMP Capital
-
Still ultra-low sovereign bond yields and the risk of a risking trend in yields, which will result in capital losses, are likely to result in another year of soft returns from bonds.
-
Unlisted commercial property and infrastructure are likely to benefit from the ongoing “search for yield” (although this is waning) and okay economic growth.
-
Residential property returns are likely to be mixed with Sydney and Melbourne prices falling, Perth and Darwin bottoming and other cities providing modest gains.
-
Shares are at risk of a further correction into the seasonally weak September/October period given the storm clouds noted above, but okay valuations, reasonable economic growth and profits and still easy monetary conditions should see the broad trend in shares remain up – just more slowly. We continue to favour global shares over Australian shares.
-
Finally, the $A is likely to fall as the RBA holds and the Fed hikes adding to the case for unhedged global shares.
Things to keep an eye on
The key things to keep an eye are: global business conditions PMIs for any deeper slowing; risks around a trade war; risks around Trump ahead of the US mid-term elections; the drip feed of Fed rate hikes; conflict with Italy over fiscal policy in Europe; risks around China and emerging countries; and the Australian property market – where a sharp slump in home prices (which is not our view) could threaten Australian growth.
Concluding comments
Returns are likely to remain okay over 2018-19 as conditions are not in place for a US/global recession. But expect more constrained returns (say around 6% for a diversified fund) and continued volatility.
Source: AMP Capital 4 July 2018
Important note: While every care has been taken in the preparation of this article, AMP Capital Investors Limited (ABN 59 001 777 591, AFSL 232497) and AMP Capital Funds Management Limited (ABN 15 159 557 721, AFSL 426455) makes no representations or warranties as to the accuracy or completeness of any statement in it including, without limitation, any forecasts. Past performance is not a reliable indicator of future performance. This article has been prepared for the purpose of providing general information, without taking account of any particular investor’s objectives, financial situation or needs. An investor should, before making any investment decisions, consider the appropriateness of the information in this article, and seek professional advice, having regard to the investor’s objectives, financial situation and needs. This article is solely for the use of the party to whom it is provided.
Should the RBA raise rates to prepare households for higher global rates?
It’s nearly two years since the Reserve Bank of Australia last changed interest rates – when it cut rates to a record low of 1.5% in August 2016. That’s a record period of inaction – or boredom for those who like to see action on rates whether it’s up or down. Of course, there are lots of views out that
Read MoreIt’s nearly two years since the Reserve Bank of Australia last changed interest rates – when it cut rates to a record low of 1.5% in August 2016. That’s a record period of inaction – or boredom for those who like to see action on rates whether it’s up or down. Of course, there are lots of views out that the RBA should be doing this or that – often held and expressed extremely – and so it’s natural that such views occasionally get an airing. This is particularly so when the RBA itself is not doing anything on the rate front.

And so it’s been this week with a former RBA Board member arguing that the RBA should raise rates by 0.25% to prepare households for higher global interest rates and that the RBA should consider ditching its inflation target in favour of targeting nominal growth.
Our view – rates on hold at least out to 2020
Our view for some time is that the RBA won’t raise interest rates until 2020 at the earliest. In terms of growth, a brightening outlook for mining investment, strengthening non-mining investment, booming infrastructure spending and strong growth in export volumes are all positive but are likely to be offset by topping dwelling investment and constrained consumer spending. As a result, growth is likely to average around 2.5-3% which is below RBA expectations for growth to move up to 3.25%. This in turn means that spare capacity in the economy will remain high – notably unemployment and underemployment at 13.9% – which will keep wages growth low and inflation down. On top of this house prices likely have more downside in Sydney and Melbourne over the next two years, banks are tightening lending standards which is resulting in a defacto monetary tightening and the risks of a US-driven trade war are posing downside risks to the global growth outlook. As such we remain of the view that a rate hike is unlikely before 2020 at the earliest and can’t rule out the next move being a cut.
Raising rates to prepare for higher rates makes no sense…
Against this backdrop, raising rates just to prepare households for higher global rates would be a major policy mistake:
-
It would be like shooting yourself in the foot so you can practice going to hospital. Some might argue that given high household debt you might miss the foot and hit something more serious – but I wouldn’t go that far!
-
What’s more it’s not entirely certain that outside the US higher global rates are on the way any time soon – particularly given the risks around a global trade war, the European Central Bank looks unlikely to be raising rates until 2020 and with Japanese inflation falling again a Bank of Japan rate hike looks years away.
-
The RBA needs to set Australian interest rates for Australian conditions not on the basis of other global economies that are in different stages in the cycle – notably the US which has unemployment and underemployment of just 7.6% in contrast to Australia where it’s 13.9%.

Source: Bloomberg, AMP Capital -
Raising rates when there is still high levels of labour market underutilisation, wages growth is weak and inflation is at the low end of the inflation target would just reinforce low inflation expectations – causing businesses and households to question whether the RBA really wants to get inflation and wage growth back up to be more consistent with the inflation target and run the risk of a slide into deflation next time there is an economic slowdown.
-
The RBA has already provided numerous warnings that sooner or later rates will go up, effectively helping to prepare households that such a move may come and in recent times banks have raised some mortgage rates, albeit only slightly. Last year’s bank rate rises were in response to regulatory pressure and recently they have been in response to higher short-term money market funding costs as the gap between bank bill rates and the expected RBA cash rate has blown out by around 0.35% relative to normal levels. This has further reminded households of the risk of higher interest rates.
…nor does changing the inflation target
Suggestions to change the inflation target or move to some other target for the RBA get wheeled out every time we run above or below the target for a while but its served Australia well. When it’s above for a while like prior to the Global Financial Crisis some wanted to raise it, when it’s below for a while some want to cut it. And there are regular calls to move to something else like nominal growth targeting. But the case to change the target is poor:
-
The 2-3% inflation target interpreted as to be achieved over time has served Australia well. It’s low enough to mean low inflation, it’s high enough to allow for the tendency of the measured inflation rate to exceed actual inflation (because the statistician tends to understate quality improvement) and to provide a bit of a buffer before hitting deflation. And the achievement of it over time means the RBA does not have to make knee-jerk moves in response to under or overshoots because it can take time to get back to target.
-
Shifting to a nominal GDP or national income growth target would be very hard for Australia for the simple reason that nominal growth in the economy moves all over the place given swings in the terms of trade which the RBA has no control off. It would have meant much tighter monetary policy into 2011 than was the case and even easier monetary policy a few years ago when the terms of trade fell. In short it would mean extreme volatility in RBA interest rates.
-
And in any case, nominal GDP or income growth is made up of two different things – inflation and real growth – so targeting just the aggregate could lead to crazy results for example if the target is 4.5% the RBA could get 4.5% inflation and say it hit its target! Which would be nuts.
-
Finally, while low rates risk inflating asset price bubbles it’s worth noting that apart from Sydney and Melbourne home prices, the period of low rates has not really led to a generalised asset price bubble problem in Australia. And in any case as we have seen recently in relation to Sydney and Melbourne property prices – which are now falling (despite still ultra-low interest rates!) – the asset price problem where it does arise can be dealt with via macro prudential controls on lenders. Arguably, if we had moved faster on the macro prudential front around 2014-2016 then the east coast housing markets would have been brought under control earlier and rates could have come down faster in Australia and we could now be in a tightening cycle…but that’s all academic!
Bottom line
The bottom line is that the RBA should stick to its inflation target and ignore those arguing for a premature rate hike. Our assessment is that this is just what it will do and that rates will be on hold for a long while yet. In the meantime, the debate about rates will no doubt rage on.
Continuing low interest rates in Australia will mean term deposit rates will stay low, search for yield activity will still help yield-sensitive unlisted investments like commercial property and infrastructure (albeit it’s waning) and an on-hold RBA with a tightening Fed is likely to mean ongoing downward pressure on the Australian dollar as the interest rate differential goes further into negative territory.

Source: Bloomberg, AMP Capital
While a crash in the $A may concern the RBA, we saw in both 2001 when it fell to $US0.48 and 2008 when it fell from $US0.98 to $US0.60 in just a few months that the inflationary consequences of a lower $A are not what they used to be and in any case the RBA would likely welcome a fall to around $US0.65-0.70.
Source: AMP Capital 28 June 2018
Author: Dr Shane Oliver, Head of Investment Strategy and Chief Economist, AMP Capital
Important note: While every care has been taken in the preparation of this article, AMP Capital Investors Limited (ABN 59 001 777 591, AFSL 232497) and AMP Capital Funds Management Limited (ABN 15 159 557 721, AFSL 426455) makes no representations or warranties as to the accuracy or completeness of any statement in it including, without limitation, any forecasts. Past performance is not a reliable indicator of future performance. This article has been prepared for the purpose of providing general information, without taking account of any particular investor’s objectives, financial situation or needs. An investor should, before making any investment decisions, consider the appropriateness of the information in this article, and seek professional advice, having regard to the investor’s objectives, financial situation and needs. This article is solely for the use of the party to whom it is provided.
Trade war risks are escalating – but a negotiated solution remains most likely
The threat of a full-blown trade war has escalated in the last few weeks with the G7 meeting ending in disarray over US tariffs on imports of steel and aluminium from its allies and more importantly President Trump threatening tariffs on (so far at least) $US450bn of imports from China, and China threatening to retaliate. Our base case remains that
Read MoreThe threat of a full-blown trade war has escalated in the last few weeks with the G7 meeting ending in disarray over US tariffs on imports of steel and aluminium from its allies and more importantly President Trump threatening tariffs on (so far at least) $US450bn of imports from China, and China threatening to retaliate. Our base case remains that a negotiated solution will ultimately be reached, but the pain threshold in the US is clearly higher than initially thought and the risks have increased.

Background on trade wars and protectionism
A trade war is a situation where countries raise barriers to trade, with each motivated by a desire to “protect’’ domestic workers, and sometimes dressed up with “national security” motivations. To be a “trade war” the barriers need to be significant in terms of their size and the proportion of imports covered. The best-known global trade war was that of 1930 where average 20% tariff hikes on most US imports under Smoot-Hawley legislation led to retaliation by other countries and contributed to a collapse in world trade.
A basic concept in economics is comparative advantage: that if Country A and B are both equally good at making Product X but Country B is best at making Product Y then they will be best off if A makes X and B makes Y. Put simply free trade leads to higher living standards and lower prices, whereas restrictions on trade lead to lower living standards and higher prices. The trade war of the early 1930s is one factor that helped make The Great Depression “great”. As RBA Governor Philip Lowe has observed “Can anyone think of a country that’s made itself wealthier or more productive by building walls?”
Access for US exports to China and stronger protection of US intellectual property. His comments at the recent G7 meeting where he proposed completely free trade suggest he secretly does support free trade (although it’s a bit hard to know for sure!)
Most of these issues were covered in more detail here.
Where are we now?
Fears of a global trade war were kicked off in early March with Trump announcing a 10% tariff on aluminium imports and a 25% tariff on steel imports. US allies were initially exempted but China was not and the exemptions for Canada, Mexico and the European Union expired on June 1. But tariffs on steel and aluminium imports are minor at around 1.5% of total US imports. There is a risk of escalation though as the affected countries retaliate.
However, the main focus remains China. On March 22, in response to the Section 301 intellectual property review (alleging theft by China), Trump proposed 25% tariffs on $US50bn of US imports from China and restrictions on Chinese investment in the US. At the same time, the US lodged a case against China with the World Trade Organisation. China then announced “plans” for 25% tariffs on $US50bn of imports from the US with a focus on agricultural products. Then Trump threatened tariffs on another $US100bn of imports from China in proposed retaliation to China’s proposed retaliation to which China said it would retaliate.
These tariffs were put on hold after a May 19 agreement between the US and China under which China agreed to import more from the US, reduce tariffs and strengthen laws to protect intellectual property, with negotiations around the details to come. Trump initially cheered the outcome, but after domestic criticism did a backflip and announced that the $US50bn in imports from China to be subject to a 25% tariff would be finalised by June 15, which they were (with a July 6 start date set for $US34bn) and that investment restrictions would be finalised by June 30.
After China said that the May 19 deal was no more and that it would match US tariffs, Trump upped the $US100bn to a 10% tariff on $US200bn of imports and said that if China retaliates to that it will do another $US200bn. This brings the tariffs on US imports from China to $US450bn which covers 90% of America’s total annual imports from China. Along the way Trump has also announced consideration of automobile tariffs – with the outcome yet to be announced.
Rising risk of a full-blown trade war
Clearly the escalating tariff threats have added to the risk of a full-blown trade war between the US and China, and with an escalation possible between the US and its allies. The initial tariffs on steel and aluminium and proposed for $US50bn of imports from China amount to a still small 3% or so of US imports or just 0.5% of US GDP so only a trivial impact and hardly a trade war.
But if there are tariffs on $US450 of imports it’s about 18% of total US imports and will have a bigger impact. On this scale it’s inevitable that consumer goods will be impacted. And with China only importing $US130bn from the US annually, it’s proportional retaliation to US tariffs will have to move into other areas like tougher taxation and regulation of US companies operating in China and selling US Treasury Bonds (although this will only push the Renminbi up which will make things worse for China).
And of course, with US allies preparing retaliation against US tariffs on steel and aluminium (eg EU tariffs on US whiskey and Harley Davidsons) there is a danger that conflict escalates here too as the US counter-retaliates. And then there’s potentially auto tariffs.
There is also the danger that President Trump’s flip flops on policy (particularly after the May 19 agreement with China) and the confusion as to who is handling the US negotiations (whatever happened to Treasury Secretary Mnuchin who declared that the trade war had been put on hold?) has damaged Trump’s and US credibility.
Economic impact
The negative economic impact from a full-blown trade war would come from reduced trade and the disruption to supply chains that this would cause. This is always a bit hard to model reliably. Modelling by Citigroup of a 10% average tariff hike by the US, China and Europe showed a 2% hit to global GDP after one year, with Australia seeing a 0.5% hit to GDP reflecting its lower trade exposure compared to many other countries, particularly in Asia which will face supply chain disruption. At present we are nowhere near an average 10% tariff hike (the average proposed tariff on $450bn of Chinese imports is 12% which across all US imports is around 2%). So this would need much further escalation from here.
It might also be argued that the US is best placed to withstand a trade war because it imports more from everyone else than everyone else imports from it and the negative impact from the proposed tariffs (which is running around $60bn in tax revenue out of the economy) is swamped by the $300bn in fiscal stimulus boosting the US economy. Trump also feels empowered because there is a lot of domestic support in the US for taking a tougher stance on trade (particularly amongst Republicans) and his approval rating has risen to 45% – the highest in his Presidency.
And the current situation mainly just involves the US and China (in terms of significant tariff announcements), so arguably Chinese and US goods flowing to each other could – to the extent that there are substitutes – just be swapped for goods coming from countries not subject to tariffs, thereby reducing the impact.
Some reasons for hope
So far what we have really seen is not a trade war but a trade skirmish. The tit for tat tariffs triggered in relation to US steel and aluminium imports are trivial in size. All the other tariffs are just proposals and the additional tariffs on $US200bn of imports from China plus another $US200bn would take months to implement, much like the initial tariffs on $US50bn. Trump is clearly using his “Maximum Pressure” negotiating approach with US Trade Representative Lighthizer saying on Friday that “we hope that this leads to further negotiations”. If the US didn’t really want to negotiate, the tariffs would no longer be proposals but would have been implemented long ago. And while Trump is riding high now as he stands tough for American workers, a full-blown escalation into a real trade war with China come the November mid-term elections is not in his interest. This would mean higher prices at Walmart and hits to US agricultural and manufacturing exports both of which will hurt his base and drive a much lower US share market which he has regarded as a barometer of his success. US Congressional leaders may also threaten intervention if they feel Trump’s tariff escalation is getting out of hand. So negotiation is still the aim and China, given its May agreement, is presumably still open to negotiation. So our base case is that after a bit more grandstanding for domestic audiences, negotiations recommence by early July allowing the July 6 tariffs to be delayed as negotiations continue, which ultimately lead to a resolution before the tariffs are implemented. Share markets would rebound in response to this.
But given the escalation in tension and distrust of President Trump we would now only attach a 55% probability to this. The other two scenarios involve:
-
A short-lived trade war with say the tariffs starting up on July 6 and maybe some more but with negotiations resulting in their eventual removal (30% probability). This would likely see more share market downside in the short term before an eventual rebound.
-
A full-blown trade war with China with all US imports from China subject to tariffs and China responding in kind, triggering a deeper 10% decline in share markets on deeper global growth worries (15% probability).
What to watch?
Key to watch for is a return to negotiation between the US and China by the end of June. The renegotiation of NAFTA and proposed retaliation from the EU against US steel and aluminium imports are also worth watching.
Why are Australian shares so relaxed?
Despite the trade war threat Australian shares have pushed to a 10 year high over the last few days helped by a rebound in financial shares, a boost to consumer stocks from the likely passage of the Government’s tax cuts (even though these are trivial in the short term) and strong gains in defensives. Given that China takes one third of our exports the local market would be vulnerable should the trade war escalate significantly. But if our base case (or even a short-lived trade war) plays out the ASX 200 looks on track for our year-end target of 6300.
Source: AMP Capital 21 June 2018
Author: Dr Shane Oliver, Head of Investment Strategy and Chief Economist , AMP Capital
Important note: While every care has been taken in the preparation of this article, AMP Capital Investors Limited (ABN 59 001 777 591, AFSL 232497) and AMP Capital Funds Management Limited (ABN 15 159 557 721, AFSL 426455) makes no representations or warranties as to the accuracy or completeness of any statement in it including, without limitation, any forecasts. Past performance is not a reliable indicator of future performance. This article has been prepared for the purpose of providing general information, without taking account of any particular investor’s objectives, financial situation or needs. An investor should, before making any investment decisions, consider the appropriateness of the information in this article, and seek professional advice, having regard to the investor’s objectives, financial situation and needs. This article is solely for the use of the party to whom it is provided.
Putting the global “debt bomb” in perspective – seven reasons to be alert but not alarmed
Here’s my forecast: “The global economy is going to have a significant downturn and record levels of debt are going to make it worse.” Sound scary enough? Put it in the headline and I can be assured of lots of clicks! I might even be called a deep thinker! The problem is that there is nothing new or profound in
Read MoreHere’s my forecast: “The global economy is going to have a significant downturn and record levels of debt are going to make it worse.” Sound scary enough? Put it in the headline and I can be assured of lots of clicks! I might even be called a deep thinker! The problem is that there is nothing new or profound in this. A significant economic downturn is inevitable at some point (it’s just the economic cycle), debt problems are involved in most economic downturns and such calls are a dime a dozen.

A standard scare now is that memories of the role of excessive debt in contributing to the GFC have worn thin and total global debt has pushed up to a new record high of over $US200 trillion – thanks largely to public debt in developed countries (with more to come in the US as Trump’s fiscal stimulus rolls out), Chinese debt and corporate debt (and household debt in Australia of course). Also, that its implosion is imminent and inevitable as interest rates normalise and that any attempt to prevent or soften the coming day of reckoning will just delay it or simply won’t work. However, in reality it’s a lot more complicated than this. This note looks at the main issues.
Global debt – how big is it and who has it?
Total gross world public and private debt is around $US171 trillion. Adding in financial sector debt pushes this over $US200 trillion but that results in double counting. Either way it’s a big and scary number. But it needs to be compared to something to have any meaning or context. A first point of comparison is income or GDP at an economy wide level. And even here new records have been reached with gross world public and private non-financial debt rising to a record of 233% of global GDP in 2016, although its fallen fractionally to 231% since. See the next chart.

Source: IMF, Haver Analytics, BIS, Ned Davis Research, AMP Capital
The next table compares total debt for various countries.

Source: IMF, Haver Analytics, BIS, Ned Davis Research, AMP Capital
The next chart shows a comparison of developed world (DM) and emerging world (EM) debt – both public and private.

Source: Haver Analytics, BIS, Ned Davis Research, AMP Capital
It can be seen that the rise in debt relative to GDP since the GFC owes to rising public debt in the developed world and rising private debt in the emerging world. Within developed countries a rise in corporate debt relative to GDP has been offset by a fall in household debt, so private debt to GDP has actually gone down slightly. And a rapid rise Chinese debt (particularly corporate) has played a role in the emerging world.
Of course, it needs to be mentioned that measures of gross debt exaggerate the total level of debt. For example, because of government holdings of debt instruments via sovereign wealth funds, central bank reserves, etc, net public debt is usually well below gross debt. In Norway net public debt is -91% of GDP and in Japan it’s 153% of GDP. But as an overview:
-
Japan, Belgium, Canada, Portugal and Greece have relatively high total debt levels;
-
Germany, Brazil, India and Russia have relatively low debt;
-
Australia does not rank highly in total debt – it has world-beating household debt but low public & corporate debt;
-
Emerging countries tend to have relatively lower debt, but rising private debt needs to be allowed for particularly in China, where corporate debt is high relative to GDP.
The bottom line is that global debt is at record levels even relative to GDP so it’s understandable there is angst about it.
Seven reasons not to be too alarmed about record debt
However, there are seven reasons not to be too alarmed by the rise in debt to record levels.
First, the level of debt has been trending up ever since debt was invented. This partly reflects greater ease of access to debt over time. So that it has reached record levels does not necessarily mean it’s a debt bomb about to explode.
Second, comparing debt and income is a bit like comparing apples and oranges because debt is a stock while income is a flow. Suppose an economy starts with $100 of debt and $100 in assets and in year 1 produces $100 of income and each year it grows 5%, consumes 80% of its income and saves 20% which is recycled as debt and invested in assets. How debt, debt to income & debt to assets evolves can be seen in the next table.
Debt ratios over time
Source: AMP Capital
At the end of year 1 its debt to income ratio will be 120%, but by the end of year 5 it will be 173%. But assuming its assets rise in line with debt its debt to asset ratio will remain flat at 100%. So the very act of saving and investing creates debt and {% rising debt to income ratios. 1 China is a classic example of this where it borrows from itself. It saves 46% of GDP and this saving is largely recycled through banks and results in strong debt growth. But this is largely matched by an expansion in productive assets. The solution is to spend more, save less and recycle more of its savings via investments like equity.
Third, the rapid rise in private debt in the emerging world is not as concerning as they have a higher growth potential than developed countries. Of course, the main problem emerging countries face is that they borrow a lot in US dollars and either a sharp rise in the $US or a loss of confidence by foreign investors causes a problem. This has started to be a concern lately as the $US is up 7% from its low earlier this year.
Fourth, debt interest burdens are low and in many cases falling as more expensive, long maturity, older debt rolls off. And given the long maturity of much debt in advanced countries it will take time for higher bond yields to feed through to interest payments. In Australia, interest payments as a share of household disposable income are at their lowest since 2003, and are down by a third from their 2008 high. There is no sign of significant debt servicing problems globally or in Australia.
Fifth, most of the post GFC debt increase in developed countries has come from public debt & governments can tax and print money. Japan is most at risk here given its high level of public debt, but borrows from itself. And even if Japanese interest rates rise sharply (which is unlikely with the BoJ keeping zero 10-year bond yields with little sign of a rise) 40% of Japanese Government bonds are held by the BoJ so higher interest payments will simply go back to the Government.
Sixth, while global interest rates may have bottomed, the move higher is very gradual as seen with the Fed and the ECB, Bank of Japan and RBA are all a long way from raising rates. What’s more, central banks know that with higher debt to income ratios they don’t need to raise rates as much to have an impact on inflation or growth as in the past.
Finally, debt alone is rarely the source of a shock to economies. Broader signs of excess such as overinvestment, rapid broad-based gains in asset prices and surging inflation and interest rates are usually required and these aren’t evident on a generalised basis. But these are the things to watch for.
Concluding comment
History tells us that the next major crisis will involve debt problems of some sort. But just because global debt is at record levels and that global interest rates and bond yields have bottomed does not mean a crisis is imminent. For investors, debt levels are something to remain alert too – but in the absence of excess in the form of booming investment levels, surging inflation and much higher interest rates, for example, there is no need to be alarmed just yet.
1.↩ [My favourite example of the complex relationships between income, saving and debt came from Bank Credit Analyst Research. Suppose there is an island with 100 people, each making 100 coconuts a year. Here’s three possibilities.
Case 1: Output is 10,000 coconuts with each person consuming 100. Saving and investment are zero and no debt is created.
Case 2: Each person consumes only 75 coconuts a year, selling the remainder to a plantation who buys them with a bank loan and plants them resulting in 2500 new coconut trees. Consumption is 7500 coconuts. Savings and investment are 2500 and debt has gone up by 2500 coconuts.
Case 3: Each person consumes 125 coconuts, by importing 25 each from foreign islands. Consumption is now 12,500 coconuts, savings is -2500 coconuts, investment is zero and the current account deficit is 2500. External debt goes up by 2500. This gets risky if the other islands want their coconuts back!
So debt can rise even if an economy lives within its means & invests for the future. ]↩
Source: AMP Capital 19 June 2018
Important note: While every care has been taken in the preparation of this article, AMP Capital Investors Limited (ABN 59 001 777 591, AFSL 232497) and AMP Capital Funds Management Limited (ABN 15 159 557 721, AFSL 426455) makes no representations or warranties as to the accuracy or completeness of any statement in it including, without limitation, any forecasts. Past performance is not a reliable indicator of future performance. This article has been prepared for the purpose of providing general information, without taking account of any particular investor’s objectives, financial situation or needs. An investor should, before making any investment decisions, consider the appropriateness of the information in this article, and seek professional advice, having regard to the investor’s objectives, financial situation and needs. This article is solely for the use of the party to whom it is provided.
China’s economy is pretty stable – but what about high debt levels and other risks?
It seems there is constant hand wringing about the risks around the Chinese economy with the common concerns being around unbalanced growth, debt, the property market, the exchange rate and capital flows and a “hard landing”. This angst is understandable to some degree. Rapid growth as China has seen brings questions about its sustainability. And China is now the world’s
Read MoreIt seems there is constant hand wringing about the risks around the Chinese economy with the common concerns being around unbalanced growth, debt, the property market, the exchange rate and capital flows and a “hard landing”. This angst is understandable to some degree. Rapid growth as China has seen brings questions about its sustainability. And China is now the world’s second largest economy, its biggest contributor to growth and Australia’s biggest export market so what happens in China has big ramifications globally. But despite all the worries it keeps on keeping on and recently growth has been relatively stable. This note looks at China’s growth outlook, the main risks and what it means for investors and Australia.

Stable growth, benign inflation
Chinese growth slowed through the first half of this decade culminating in a growth and currency scare in 2015 which saw Chinese policy swing from mild tightening towards stimulus. This has seen pretty stable growth since 2016 of around 6.8% year on year. Consistent with this, business conditions PMIs have also been stable (see the next chart) and uncertainty around the Renminbi has fallen & capital outflows have slowed.

Source: Bloomberg, AMP Capital
April data saw industrial production and profits accelerate but investment and retail sales slow a bit. Electricity consumption, railway freight and excavator sales have lost momentum from their highs. But the overall impression is that growth is still solid.

Source: Bloomberg, AMP Capital
While there is a need for China to rebalance its growth away from investing for exports, the slowdown in investment growth to below that for retail sales, imports growing faster than exports and the shrinkage in China’s current account deficit from 10% of GDP to 1% of GDP suggests this occurring.
Meanwhile, inflation in China is benign with producer price inflation around 3% and consumer price inflation around 2%.

Source: Domain, AMP Capital
Policy neutral
Chinese economic policy has been relatively stable recently. There has been some talk of boosting domestic demand and bank required reserve ratios have been cut. But the latter appears to have been to allow banks to repay medium term loan facilities, interest rates have been stable and growth in public spending has been steady at 7-8% year on year.
Growth and inflation outlook
We expect Chinese growth this year to slow a bit as investment slows further to around 6.5% and consumer inflation of 2-3%.
Key risks facing China
There are four key risks facing China. First, the policy focus could shift from maintaining solid growth to speeding up medium-term economic reforms and deleveraging (or cutting debt ratios) that could threaten short-term economic growth. Some expected this to occur after the 19th National Congress of the Communist Party was out of the way late last year. And the removal of term limits on President Xi Jinping could arguably make him less sensitive to a short-term economic downturn. However, so far there is no sign of this and the authorities seem focused on maintaining solid growth.
Second, China’s rapid debt growth could turn sour. Since the Global Financial Crisis, China’s ratio of non-financial debt to GDP has increased from around 150% to around 260%, which is a faster rise than has occurred in all other major countries.

Source: RBA, AMP Capital
This has been concentrated in corporate debt and to a lesser degree household debt and has been made easier by financial liberalisation and a lot of the growth has been outside the more regulated banking system in “shadow banking”. An obvious concern is that when debt growth is rapid it results in a lot of lending that should not have happened that eventually goes bad. However, China’s debt problems are different to most countries. First, as the world’s biggest creditor nation China has borrowed from itself – so there’s no foreigners to cause a foreign exchange crisis. Second, much of the rise in debt owes to corporate debt that’s partly connected to fiscal policy and so the odds of government bailout are high. Finally, the key driver of the rise in debt in China is that it saves around 46% of GDP and much of this is recycled through the banks where it’s called debt. So unlike other countries with debt problems China needs to save less and consume more and it needs to transform more of its saving into equity rather than debt. Chinese authorities have long been aware of the issue and growth in shadow banking and overall debt has slowed but slamming on the debt brakes without seeing stronger consumption makes no sense.
Third, the risk of a trade war has escalated with Trump threatening tariffs on $50-150bn of imports from China and restrictions on Chinese investment in the US and China threatening to reciprocate. While “constructive” negotiations have commenced and have seen China commit to buying more from the US & to strengthen laws protecting intellectual property which saw the US initially defer the tariffs and restrictions, Trump has indicated that they will be implemented this month which looks to be aimed at prodding China to move rapidly (and appeasing his base). Ultimately, we expect a negotiated solution, but the risks are high and a full-blown trade war with the US could knock 0.5% or so off Chinese short-term growth.
Finally, with the Chinese residential property market slowing again there is naturally the risk that this could turn into a slump. It’s worth keeping an eye on but absent an external shock looks doubtful. The “ghost cities” paranoia of a few years ago – it first aired on SBS TV way back in 2011 – has clearly not come to much. It’s doubtful China ever really had a generalised housing bubble: household debt is low by advanced country standards; house prices haven’t kept up with incomes; and while there’s been some excessive supply, this is not so in first tier cities; and the quality of the housing stock is low necessitating replacement. So, I think the property crash fears continue to be exaggerated and the latest bout of weakness in prices looks to be just another cyclical downswing in China of which there have been several over the last decade.

Our assessment remains that these risks are manageable, albeit the trade war risk is the hardest for China to manage given the erratic actions of President Trump. The Chinese Government has plenty of firepower to support growth though, so a “hard landing” for Chinese growth remains unlikely for now.
The Chinese share market
Since its low in January 2016 the Chinese share market has had a good recovery. But Chinese shares are trading on a price to earnings ratio of 12.8 times which is far from excessive.
With valuations okay and growth continuing, Chinese shares should provide reasonable returns, albeit they can be volatile.
Implications for Australia – not yet 2003, but still good
Solid growth in China should help keep commodity prices, Australia’s terms of trade and export volume growth reasonably solid. This, along with rising non-mining investment and strong public investment in infrastructure, will offset slowing housing investment and uncertainty over the outlook for consumer spending and will keep Australian economic growth going. However, with strong resources supply (and still falling mining investment) we are a long way from the boom time conditions of last decade and growth is likely to average around 2.5-3%. Rising US interest rates against flat Australian rates suggests more downside for the $A, but solid commodity prices should provide a floor for the $A in the high $US0.60s.
Key implications for investors
-
Chinese shares remain reasonably good value from a long- term perspective, but beware their short-term volatility.
-
Solid Chinese growth should support commodity prices and resources shares
Source: AMP Capital 04 June 2018
Important note: While every care has been taken in the preparation of this article, AMP Capital Investors Limited (ABN 59 001 777 591, AFSL 232497) and AMP Capital Funds Management Limited (ABN 15 159 557 721, AFSL 426455) makes no representations or warranties as to the accuracy or completeness of any statement in it including, without limitation, any forecasts. Past performance is not a reliable indicator of future performance. This article has been prepared for the purpose of providing general information, without taking account of any particular investor’s objectives, financial situation or needs. An investor should, before making any investment decisions, consider the appropriateness of the information in this article, and seek professional advice, having regard to the investor’s objectives, financial situation and needs. This article is solely for the use of the party to whom it is provided.

