

Olivers Insights
Boom turns to bust – falling Australian home prices. How far and for how long and what’s the impact on the economy?
Australian capital city home prices have fallen for 12 months in a row and are down 4% from their peak. Most of the weakness relates to the previous boom time cities of Sydney and Melbourne but prices are continuing to fall in Perth and Darwin.
Source: CoreLogic, AMP Capital
This begs the questions: how far will prices drop? and what will it
Read More
Australian capital city home prices have fallen for 12 months in a row and are down 4% from their peak. Most of the weakness relates to the previous boom time cities of Sydney and Melbourne but prices are continuing to fall in Perth and Darwin.

Source: CoreLogic, AMP Capital
This begs the questions: how far will prices drop? and what will it mean for the broader economy?
High prices and high debt – how did it come to this?
The big picture view on Australian property is:
-
Real house prices started to surge in the mid-1990s. This has led to them being expensive relative to income, rents, their long-term trend and by global standards. On our valuation measures prices are around 30% overvalued. The boom since the mid-1990s has rolled through different cities at different times, eg, starting in Sydney & Melbourne, then Perth, then Sydney & Melbourne again more recently.
-
As a result, affordability is poor and while interest rates may be low it’s become hard to save for a sufficient deposit.
-
The surge in home prices has gone hand in hand with a surge in household debt. See the next chart. This has taken the household debt to income ratio from the low end of OECD countries to the top end. The shift to overvaluation and high debt mostly occurred over the 1995-2005 period.

Source: OECD, RBA, AMP Capital
It’s popular to blame negative gearing, the capital gains tax discount and foreign buying for high home prices and debt. However, the basic drivers are a combination of the shift from high to low interest rates over the last 20-30 years boosting borrowing power, along with a surge in population growth from mid-last decade and the inadequacy of a supply response (thanks to tight development controls and lagging infrastructure) to suppress the resultant rise in the ratio of prices to incomes. Since 2006, annual population growth has averaged about 150,000 above what it was over the decade to the mid-2000s, which required roughly an extra 50,000 new homes per year, but dwelling completions have only recently caught up.
The tide has turned – expect more price falls
However, starting about a year ago it seems the tide has turned against property prices reflecting a range of factors:
-
Poor affordability – which has reduced the pool of buyers.
-
A tightening in bank lending standards under pressure from regulators – particularly around tougher income and expense verification and total debt to income limits for borrowers. The latter will particularly impact cities like Sydney and Melbourne which have high price to income ratios necessitating high debt to income ratios. It will also impact property investors with multiple properties (with around 1.5 million properties held by investors with multiple properties) with banks cracking down on lending to such investors. This is all making it harder to get housing loans.
-
A significant pool of interest only borrowers are scheduled to switch to principal and interest over the next few years resulting in a sharp rise in total debt servicing costs.
-
Banks withdrawing from lending to Self-Managed Super Funds – reducing the pool of property investors.
-
A cutback in foreign demand, partly due to Australian authorities making it more difficult. Chinese investment into Australian real estate has fallen by roughly 70% since 2015.
-
Rising unit supply – as the ongoing surge in unit construction completes and hits the market with Sydney and Melbourne most at risk. This risk is highlighted by Australia’s residential crane count of 528 cranes being way above the total crane count (ie residential and non-residential) in the US of 300 and Canada of 123!
-
Out of cycle bank mortgage rate increases may also be playing a role – although a minor one as the moves have been small, mortgage rates remain near record lows and some banks have cut rates for new borrowers.
-
Falling price growth expectations in response to falling prices risks resulting in a negative feedback loop for prices – as the FOMO (fear of missing out) phenomenon of up until a year ago risks turning into FONGO (fear of not getting out), particularly for investors as they realise they are only getting very low returns from net rental yields of around 1-2%.
-
Expectations that negative gearing and capital gains tax concessions will be made less favourable if there is a change of government are likely also impacting and have the potential to become a major drag on prices.
On their own some of these are not significant, but together they risk creating a perfect storm for the property market.
Home price outlook
For some time, we have been expecting top to bottom falls in Sydney and Melbourne prices of 15% spread out to 2020, implying price declines around 5% per annum. However, the risks are starting to skew to the downside – particularly around tighter credit and falling capital growth expectations made worse by fears of a change in tax arrangements. Auction clearances in recent weeks have been running around levels roughly consistent with 7-8% pa price declines. See next chart.

Source: Domain, AMP Capital
As such we are now allowing for a 20% decline in prices in these cities, again spread out to 2020, which would take average prices back to first half 2015 levels.

Source: CoreLogic, AMP Capital
By contrast home prices in Perth and Darwin are either at or close to the bottom having fallen back to levels seen more than a decade ago, and prices are likely to perform a lot better in Adelaide, Brisbane, Canberra and Hobart along with regional centres as they have not seen anything like the boom in Sydney and Melbourne. But they will see some impact from tighter credit. Overall, we now expect national average prices to fall nearly 10% out to 2020 which is a downgrade from our previous expectation for a 5% national average fall.
A crash is a risk but remains unlikely
With prices now falling naturally the calls for a property crash are getting a lot of airing. But these have been wheeled out endlessly over the last 15 years or so. Our assessment remains that a crash (say a 20% or more fall in national average prices) is unlikely unless we see much higher interest rates or unemployment (neither of which are expected) or a continuation of recent high construction for several years (which is unlikely as approvals are falling) and a collapse in immigration.
Strong population growth is continuing to drive strong underlying demand for housing. While mortgage stress is a risk, it tends to be overstated: there has been a sharp reduction in interest only loans already; debt servicing payments as a share of income have actually fallen slightly over the last decade; a significant number of households are ahead on their repayments; and banks’ non-performing loans remain low. Finally, while Sydney and Melbourne are at risk other cities have not seen the same boom and so are less vulnerable.
However, the risk of a crash cannot be ignored given the danger that banks may overreact and become too tight and that investors decide to exit in the face of falling returns, low yields and possible changes to negative gearing and capital gains tax.
The property cycle and the economy
The downturn in the housing cycle will affect the broader economy via slowing dwelling construction, negative wealth effects on consumer spending, less demand for household goods and via the banks as credit growth slows and if mortgage defaults rise. This will provide an offset to strong growth in infrastructure spending and solid growth in business investment and will constrain economic growth to around 2.5-3% which in turn will keep wages growth and inflation low. All of which is consistent with our view that the RBA won’t be raising rates until 2020 at the earliest and given the downside risks related to house prices it may have to cut rates. Housing weakness will also continue to constrain bank share returns.

Source: ABS, AMP Capital
Implications for investors
Over the very long-term, residential property adjusted for costs has similar returns to Australian shares. So, there is a role for it in investors’ portfolios. However, now remains a time for caution regarding housing as an investment destination – particularly in Sydney and Melbourne where it remains expensive, prices are likely to fall further & it offers very low rental yields. Best to look at other cities and regional areas that offer much better value.
Source: AMP Capital 18 October 2018
Important notes: While every care has been taken in the preparation of this article, AMP Capital Investors Limited (ABN 59 001 777 591, AFSL 232497) and AMP Capital Funds Management Limited (ABN 15 159 557 721, AFSL 426455) makes no representations or warranties as to the accuracy or completeness of any statement in it including, without limitation, any forecasts. Past performance is not a reliable indicator of future performance. This article has been prepared for the purpose of providing general information, without taking account of any particular investor’s objectives, financial situation or needs. An investor should, before making any investment decisions, consider the appropriateness of the information in this article, and seek professional advice, having regard to the investor’s objectives, financial situation and needs. This article is solely for the use of the party to whom it is provided.
The pullback in shares – seven things investors need to keep in mind
Every so often shares go through rough patches. We saw this most recently around February on the back of US inflation and interest rate concerns and the start of US tariffs which saw US shares and global shares fall roughly 10% and Australian shares fall 6%. Shares mostly recovered – even getting through the seasonally weak months of August
Read MoreIntroduction
Every so often shares go through rough patches. We saw this most recently around February on the back of US inflation and interest rate concerns and the start of US tariffs which saw US shares and global shares fall roughly 10% and Australian shares fall 6%. Shares mostly recovered – even getting through the seasonally weak months of August and September surprisingly well – with US shares making new records and Australian shares hitting a ten-year high, but the worry list has returned again with US, global shares and Australian shares now down around 7% from their recent high. This note looks at the issues for investors and puts the falls into context.

What’s driving the latest plunge?
The recent plunge reflects a range of factors.
-
Investors have started to worry again that the very strong US economy will push the Fed into tightening a lot more and that this will cause a further sharp rise in bond yields which will threaten growth and share market valuations.
-
The trade conflict between the US and China is continuing to intensify and spilling over into other areas.
-
Technology shares, which have been key drivers of the US share markets rally (and outperformance) have been vulnerable – being somewhat overvalued and facing increased regulation in the US (which is something that President Trump has been threatening).
-
Rising oil prices due to strong global demand and threats to supply have added to concerns about inflation and growth.
-
Problems in the emerging world partly due to rising US interest rates poses a threat to global growth as reflected in a recent downgrade to the IMF’s global growth forecasts.
-
Nervousness remains in the US around President Trump and the Mueller inquiry and the upcoming US mid-term Congressional elections.
-
Tensions in the Eurozone regarding the Italian budget are weighing on European shares.
-
October is also known for share market volatility and this October is the 31st anniversary of the 1987 crash which often seems to create a bit of apprehension.
Because shares have fallen rapidly they are technically oversold and so could have a short-term bounce. But given that many of these issues could get worse before they get better the risk is that the pullback has further to go.
Considerations for investors
Sharp market falls with headlines screaming that billions of dollars have been wiped off the share market (funny that you never see the same headlines on the way up!) are stressful for investors as no one likes to see the value of their investments decline. However, several things are worth bearing in mind:
First, periodic corrections in share markets of the order of 5-15% are healthy and normal. For example, during the tech/dot. com boom from 1995 to early 2000, the US share market had seven pull backs greater than 5% ranging from 6% up to 19% with an average decline of 10%. During the same period, the Australian share market had eight pullbacks ranging from 5% to 16% with an average fall of 8%. All against a backdrop of strong returns every year. During the 2003 to 2007 bull market, the Australian share market had five 5% plus corrections ranging from 7% to 12%, again with strong positive returns every year. More recently, the Australian share market had a 10% pullback in 2012, an 11% fall in 2013 (the taper tantrum), an 8% fall in 2014, a 20% fall between April 2015 and February 2016 and a 7% fall earlier this year all in the context of a gradual rising trend. And it has been similar for global shares, but against a strongly rising trend. See the next chart. While they can be painful, share market corrections are healthy because they help limit a build-up in complacency and excessive risk taking.

Source: Bloomberg, AMP Capital
Related to this, shares climb a wall of worry over many years with numerous events dragging them down periodically, but with the long-term trend ultimately up & providing higher returns than other more stable assets. Bouts of volatility are the price we pay for the higher longer-term returns from shares.

Source: ASX, AMP Capital
Second, the main driver of whether we see a correction (a fall 5% to 15%) or even a mild bear market (with say a 20% decline that turns around relatively quickly like we saw in 2015-2016) as opposed to a major bear market (like that seen in the global financial crisis (GFC)) is whether we see a recession or not – notably in the US. The next table shows US share market falls greater than 10% since the 1970s. I know it’s a bit heavy – but I like this table! The first column shows the period of the fall, the second shows the decline in months, the third shows the percentage decline from top to bottom, the fourth shows whether the decline was associated with a recession or not, the fifth shows the gains in the share market one year after the low and the final column shows the decline in the calendar year associated with the share market fall. Falls associated with recessions are highlighted in red. Averages are shown for the whole period and for falls associated with recession at the bottom of the table.

Several points stand out. First, share market falls associated with recession tend to be longer and deeper. Second, falls associated with recessions are more likely to be associated with negative total returns (ie capital growth plus dividends) in the associated calendar year as a whole. Finally, as would be expected the share market rebound in the year after the low is much greater following falls associated with recession.
So whether a recession is imminent or not in the US is critically important in terms of whether we will see a major bear market or not. In fact, the same applies to Australian shares. Our assessment remains that US/global recession is not imminent:
-
Still high levels of business and consumer confidence globally are only just starting to help drive stronger consumer spending and business investment.
-
While US monetary conditions have tightened they are far from tight and they are still very easy globally and in Australia (with monetary tightening still a fair way off in Europe, Japan and Australia). We are a long way from the sort of monetary tightening that leads into recession.
-
Fiscal stimulus will boost US growth into next year, partly offsetting Fed rate hikes.
-
We have not seen the excesses – in terms of debt growth, overinvestment, capacity constraints and inflation – that normally precede recessions in the US, globally or Australia.
Reflecting this, global earnings growth is likely to remain reasonable providing underlying support for shares. So, for all these reasons its likely that the current pull back is more likely to be a correction rather than a major bear market.
Third, selling shares or switching to a more conservative investment strategy or superannuation option after a major fall just locks in a loss. With all the talk of billions being wiped off the share market, it may be tempting to sell. But this just turns a paper loss into a real loss with no hope of recovering.
Fourth, when shares and growth assets fall they are cheaper and offer higher long-term return prospects. So, the key is to look for opportunities the pullback provides. It’s impossible to time the bottom but one way to do it is to average in over time.
Fifth, while shares may have fallen, dividends from the market haven’t. So the income flow you are receiving from a well-diversified portfolio of shares remains attractive, particularly against bank deposits.

Source: RBA, Bloomberg, AMP Capital
Sixth, shares and other related assets often bottom at the point of maximum bearishness, ie just when you and everyone else feel most negative towards them. So the trick is to buck the crowd. “Be fearful when others are greedy. Be greedy when others are fearful,” as Warren Buffett has said.
Finally, turn down the noise. At times like this, negative news reaches fever pitch. Talk of billions wiped off share markets and warnings of disaster help sell copy and generate clicks and views. But such headlines are often just a distortion. We are never told of the billions that market rebounds and the rising long-term trend in share prices adds to the share market. Moreover, they provide no perspective and only add to the sense of panic. All of this makes it harder to stick to an appropriate long-term strategy let alone see the opportunities that are thrown up. So best to turn down the noise and chill out – yeah, I agree it’s sometimes easier said than done, but still!
Source: AMP Capital 12th October 2018
Important notes: While every care has been taken in the preparation of this article, AMP Capital Investors Limited (ABN 59 001 777 591, AFSL 232497) and AMP Capital Funds Management Limited (ABN 15 159 557 721, AFSL 426455) makes no representations or warranties as to the accuracy or completeness of any statement in it including, without limitation, any forecasts. Past performance is not a reliable indicator of future performance. This article has been prepared for the purpose of providing general information, without taking account of any particular investor’s objectives, financial situation or needs. An investor should, before making any investment decisions, consider the appropriateness of the information in this article, and seek professional advice, having regard to the investor’s objectives, financial situation and needs. This article is solely for the use of the party to whom it is provided.
Successful investing despite 115 million worries and Truth Decay – how to turn down the noise
“Information is not knowledge, knowledge is not wisdom – Frank Zappa (and maybe some others)”
It may seem that the worry list for investors is bigger and more confusing than ever before. Some of this may relate to US President Trump’s disruptive and “open mouth” approach as highlighted by the “trade war” and his frequent and sometimes contradictory tweets. For example,
Read More“Information is not knowledge, knowledge is not wisdom – Frank Zappa (and maybe some others)”
It may seem that the worry list for investors is bigger and more confusing than ever before. Some of this may relate to US President Trump’s disruptive and “open mouth” approach as highlighted by the “trade war” and his frequent and sometimes contradictory tweets. For example, on 24th July Trump tweeted “Tariffs are the greatest!” But 12 hours later he tweeted “The European Union is coming to Washington tomorrow to negotiate a deal on Trade. I have an idea for them. Both the U.S. and the E.U. drop all Tariffs, Barriers and Subsidies!”

Now I think I know where he was coming from, but all this noise can create a lot of uncertainty for investors. But noise around Trump is part of a broader issue around information overload and broader again in terms of what a report by the RAND Corporation – a US non-partisan research organisation – has called Truth Decay. As we have observed in recent years there seems to be a never-ending worry list for investors that is receiving greater prominence as the information age enables the ready and rapid dissemination of news and opinion. But we need to recognise that much of this is just noise and ill-informed and that there is a big difference between information and wisdom when it comes to investing. The danger is that information and opinion overload is making us all worse investors as we lurch from one worry to the next resulting in ever shorter investment horizons in the process.
“Just remember: What you’re seeing and what you’re reading is not what’s happening.” – President Donald Trump
Truth Decay – what is it & what are its consequences?
Truth Decay as analysed by the RAND Corporation report is characterised by: disagreement about facts and their analytical interpretation; a blurring between fact and opinion; an increase in the volume and influence of opinion and personal experience over fact; and declining trust in traditional sources of facts such as government and newspapers. It’s evident in: declining support for getting children vaccinated despite medical evidence supporting it; perceptions crime has increased when it’s actually declined; and a lack of respect for scientific evidence around global warming. Elements of Truth Decay were evident in past periods like the 60s & 70s, but increasing disagreement about facts makes the current period different.
The causes of Truth Decay include: behavioural biases that leave people susceptible to information and opinion that confirms their views and aligns with their personal experience; the information revolution and social media that have led to a surge in the availability of information and opinion and the rise of partisan news channels; educational systems that have not taught us to be critical thinkers; social polarisation with rising inequality and division attracting people to opposing sides that are reinforced by participating in social media echo chambers. The consequences include a deterioration in civil debate as people simply can’t agree on the facts, political paralysis, disengagement from societies’ institutions and uncertainty.
Why is Truth Decay relevant for investors?
Truth Decay is relevant for investors because: it could lead to less favourable economic policy decisions which could weigh on investment returns; and investors are subject to the same forces driving Truth Decay such that it explains why the worry list for investors seems more worrying and distracting. The first is a topic for another day, but in terms of the heightened worry list facing investors there are three key drivers.
First, just as with the broader concept of Truth Decay various behavioural biases leave investors vulnerable in the way they process information. In particular, they can be biased to information and particularly opinions that confirm their own views. People are also known to suffer from a behavioural trait known as “loss aversion” in that a loss in financial wealth is felt much more distastefully than the beneficial impact of the same sized gain. This likely owes to evolution which has led to much more space in the human brain devoted to threat than reward. As a result, we are more predisposed to bad news stories that alert us to threat as opposed to good news stories. In other words bad news and doom and gloom find a more ready market than good news or balanced commentary as it appeals to our instinct to look for risks. Hence the old saying “bad new sells”.
Secondly, thanks to the information revolution we are now exposed to more information than ever on both how our investments are going and everything around them. This has particularly been the case since the GFC – the first iPhone was only released in 2007! In some ways this is great as we can check facts and analyse things very easily. But the downside is that we have no way of assessing all the extra information and less time to do so. So, it can become noise at best, distracting at worst. If we don’t have a process to filter it and focus on what matters we can simply suffer from information overload. This can be bad for investors as when faced with too much information we can become more uncertain, freeze up and make the wrong investment decisions as our natural “loss aversion” combines with what is called the “recency bias” that sees people give more weight to recent events which can see investors project bad news into the future and so sell after a fall.
But the explosion in digital/social media means we are bombarded with economic and financial news and opinions with 24/7 coverage by multiple web sites, subscription services, finance updates, TV channels, social media feeds, etc. And in competing for your attention, bad news and gloom trumps good news and balanced commentary as “bad news sells.” And the more entertaining it is the more attention it gets, which means less focus on balanced quality analysis. An outworking of all this is that the bad news seems “badder” and the worries more worrying. Google the words “the coming financial crisis” and you get 115 million search results with titles such as:
-
a vicious Fed-fuelled economic crisis is coming
-
coming financial crisis: a look behind the wizard’s curtain
-
here comes another global financial crisis
-
coming financial crisis will be much worse than Great Depression
-
another financial crisis is imminent, four reasons why
-
Japanese whales and the next financial crisis – I knew there was a connection!
In the pre-social media/pre-internet days it was much harder for ordinary investors to be exposed to such disaster stories on a regular basis. The obvious concern is that the combination of a massive ramp up in information and opinion combined with our natural inclination to zoom in on negative news is making us worse investors: more distracted, fearful, reactive and short-term focussed and less reflective and long-term focussed.
Five ways to manage information & opinion overload
To be a successful investor you need to make the most of the power of compound interest and to do that you need to invest for the long term and not get blown around by each new worry. And the only way to do that is to turn down the noise on the worry list. This is getting harder given the distractions on social media. But here are five suggestions as to how to do so:
First, put the latest worry in context. There is always an endless stream of worries. Here’s a list of the main worries of the last five years: Fed tapering; the US Government shutdown; Ukraine; IS terror threat; Ebola; deflation; Greece & Eurozone debt; China worries; Australian recession fears, property & banks; Brazil and Russia in recession; oil price collapse; manufacturing slump; Fed raising rates; falling profits; Brexit; Trump; North Korea; South China Sea tensions; Italy; and trade wars. Even fund managers go from one worry to another as evident in the next chart that tracks what they nominate as the biggest risk over time.
click to enlarge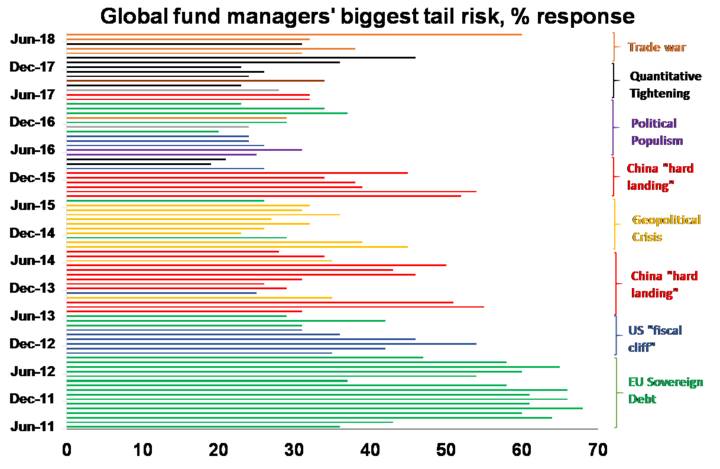
Source: BofA Merrill Lynch Global Fund Manager Survey, AMP Capital
Yet despite all the worries, investment returns have been good with, eg, average balanced superannuation funds returning 8.5% pa over the last five years. The global economy has had plenty of worries over the last century, but Australian shares still returned 11.8% pa since 1900 and US shares 9.8% pa.

Source: ASX, AMP Capital
Some of the worries we hear much about come to something big, but most of the time they don’t with US and Australian shares rising seven and eight years out of 10 respectively since 1900. So is the latest worry is any more threatening than the last one?
Second, recognise how markets work. Shares return more than cash in the long term because they can lose money in the short term. So, while the share market is highly volatile in the short term – often in response to loss-averse investors projecting recent bad news and worries into the future – it has strong returns over rolling 20-year periods. Short-term volatility is the price wise investors pay for higher long-term returns.
Third, find a way to filter news so that it doesn’t distort your investment decisions. For example, this could involve building your own investment process or choosing a few good investment subscription services and relying on them.
Fourth, don’t check your investments so much. On a day to day basis the Australian All Ords price index and the US S&P 500 price index are down almost as much as they are up. See the next chart. So, it’s a coin toss as to whether you will get good news or bad on a day to day basis. By contrast if you only look at how the share market has gone each month and allow for dividends the historical experience tells us you will only get bad news about 35% of the time. And if you stretch it out to each decade, since 1900 positive returns have been seen 100% of the time for Australian shares and 82% for US shares.

Data from 1995 and 1900. Source: Global Financial Data, AMP Capital
So, the less you look the less you will be disappointed and so the lower the chance that a bout of “loss aversion” will be triggered which leads you to sell at the wrong time.
Finally, look for opportunities that bad news and investor worries throw up. Periods of share market turbulence after bad news provide opportunities for smart investors as such periods push shares into cheap territory.
Source: AMP Capital 28 September 2018
Important notes: While every care has been taken in the preparation of this article, AMP Capital Investors Limited (ABN 59 001 777 591, AFSL 232497) and AMP Capital Funds Management Limited (ABN 15 159 557 721, AFSL 426455) makes no representations or warranties as to the accuracy or completeness of any statement in it including, without limitation, any forecasts. Past performance is not a reliable indicator of future performance. This article has been prepared for the purpose of providing general information, without taking account of any particular investor’s objectives, financial situation or needs. An investor should, before making any investment decisions, consider the appropriateness of the information in this article, and seek professional advice, having regard to the investor’s objectives, financial situation and needs. This article is solely for the use of the party to whom it is provided.
Seven lessons from the Global Financial Crisis for investors
The period August to October is a time for anniversaries of financial market crises – the 1929 share crash, the 1974 bear market low, the 1987 share crash, the Emerging market/LTCM crisis in 1998, and of course the worst of the Global Financial Crisis in 2008. The GFC started in 2007 but it was the collapse of Lehman Brothers on
Read MoreThe period August to October is a time for anniversaries of financial market crises – the 1929 share crash, the 1974 bear market low, the 1987 share crash, the Emerging market/LTCM crisis in 1998, and of course the worst of the Global Financial Crisis in 2008. The GFC started in 2007 but it was the collapse of Lehman Brothers on 15 September 2008 and the events around it which saw it turn into a major existential crisis for the global financial system. Naturally each anniversary begs the question of can it happen again and what are the key lessons. And so it is with the tenth anniversary of the worst of the GFC.

A brief history of the GFC
The events around the failure of Lehman Brothers and the GFC have been done to death. But here’s a brief history. It was the worst financial crisis since the Great Depression. It saw the freezing up of lending between banks, multiple financial institutions needing to be rescued, 50% plus share market falls and the worst post-war global economic contraction. Basically, the environment of low interest rates prior to the GFC saw too many loans made to US homebuyers that set off a housing boom that went bust when rates rose and supply surged.
-
40% or so of loans went to people with a poor ability to service them – sub-prime and low doc borrowers. And many were non-recourse loans – so borrowers could just hand over the keys to the house if its value fell – “jingle mail”!
-
This was encouraged by public policy aimed at boosting home ownership and ending discrimination in lending. Some extolled the “democratisation of finance”!
-
It was made possible by a huge easing in lending standards and financial innovation that packaged the sub-prime loans into securities, which were then given AAA ratings on the basis that while some loans may default the risk will be offset by the broad exposure. These securities were then leveraged, sold globally and given names like Collateralised Debt Obligations (CDOs). But after securitization there was no “bank manager” looking after the loans.
-
This all came as banks were sourcing an increasing amount of the money they were lending from global money markets.
This stopped in 2006 when poor affordability, an oversupply of homes and 17 Fed interest rates hikes saw US house prices start to slide. This made it harder for sub-prime borrowers to refinance their loans after their initial “teaser” rates. So they started defaulting, causing losses for investors. This caught the attention of global investors in August 2007 after BNP froze redemptions from three funds because it couldn’t value the CDOs within them, triggering a credit crunch with sharp rises in the cost of funding for banks – evident in a surge in short term borrowing rates relative to official rates (see next chart) – and a reduction in its availability causing sharp falls in share markets.

Source: Bloomberg, AMP Capital
Shares rebounded but peaked around late October 2007 before commencing roughly 55% falls as the credit crunch worsened, the global economy fell into recession, mortgage defaults escalated, and many banks failed with a big one being Lehman.
The crisis went global as losses magnified by gearing mounted, forcing investment banks and hedge funds to sell sound investments to meet redemptions which spread the crisis to other assets. The wide global distribution of investors in US sub-prime debt led to greater worries about who was at risk, with the loss of trust resulting in a freezing up of lending between banks and sky-high borrowing costs (see the previous chart). All of which affected confidence and economic activity.
The cause of the GFC lay with home borrowers, the US Government, lenders, ratings agencies, regulators, investors and financial organisations for taking on too much risk. It ended in 2009 after massive monetary and fiscal stimulus along with government rescues of banks. But aftershocks continued for years with sub-par growth and low inflation into this decade. From an economic perspective the GFC highlighted that:
-
Fiscal and monetary policy work. There is a role for government, central banks and global cooperation in putting free market economies back on track when they get into a downward spiral. (While some have argued that easy money just benefitted the rich, doing nothing would have likely ended with 20% plus unemployment and worse inequality.) Hopefully there will be the same common sense ‘do whatever it takes’ approach again if the need arises.
-
The return to normal from major financial crises can take time – in fact a decade or so according to a study by Kenneth Rogoff and Carmen Reinhart – as the blow to confidence depresses lending and borrowing and hence consumer spending and investment for years afterwards. The key is to allow for this and not turn off the policy stimulus prematurely, but also to avoid thinking it is permanent as the muscle memory does eventually fade.
-
“Stuff happens” – while after each economic crisis there is a desire to “make sure it never happens again”, history tells us that manias, panics and crashes are part and parcel of the process of “creative destruction” that has led to an exponential increase in material prosperity in capitalist countries. The trick is to ensure that the regulation of financial markets minimises the economic fallout that can occur when free markets go astray but doesn’t stop the dynamism necessary for economic prosperity.
Will it happen again?
History is replete with bubbles and crashes and tells us it’s inevitable that they will happen again as each generation forgets and must relearn the lessons of the past through another bubble based on collective euphoria about some new innovation. Often the seeds for each bubble are sown in the ashes of the former. Fortunately, in the post-GFC environment seen so far there has been an absence of broad-based bubbles on the scale of the tech boom or US housing/credit boom. There was a brief surge in gold and some commodity prices early this decade but it did not get that big before bursting. Bitcoin and other cryptos were another example but they blew up before sucking in enough investors to have a meaningful global impact. E-commerce stocks like Facebook and Amazon are candidates for the next bust but they have seen nowhere near the gains or infinite PEs seen in the late 1990s tech boom.

Source: Thomson Reuters, Bloomberg, AMP Capital
Post a GFC related pull back, global debt has grown to an all-time high relative to global GDP posing an obvious concern. However, this alone does not mean another GFC is upon us. The ratio of global debt to GDP has been trending up forever, much of the growth in debt in developed countries post the GFC has been in public debt and debt interest burdens are low thanks to still low interest rates in contrast to the pre-GFC period. Furthermore, the other signs of excess that normally set the scene for recessions and associated deep bear markets in shares like that seen in the GFC are not yet present on a widespread basis. Inflation is low, monetary policy globally remains easy, there has been no widespread overinvestment in technology or housing, and bank lending standards have not been relaxed as much as prior to the GFC.

Source: IMF, Haver Analytics, BIS, Ned Davis Research, AMP Capital
Moreover, financial regulations have tightened with banks required to have higher capital ratios and get more funds from their depositors. Much of the surge in debt post the GFC has been in private emerging market debt rather than in developed countries suggesting emerging markets are at greater risk.
Another economic crisis is inevitable at some point, but it will likely be very different to the GFC.
Seven lessons for investors from the GFC
The key lessons for investors from the GFC are as follows:
-
There is always a cycle. Talk of a “great moderation” was all the rage prior to the GFC but the GFC reminded us that long periods of good growth, low inflation and great returns are invariably followed by something going wrong. If returns are too good to be sustainable they probably are.
-
While each boom bust cycle is different, markets are pushed to extremes – with the asset at the centre of the upswing overvalued and over-loved at the top and undervalued and under-loved at the bottom, which for credit investments and shares was in first half 2009. This provides opportunities for patient contrarian investors to profit from.
-
High returns come with higher risk. While risk may not be apparent for years, at some point when everyone is totally relaxed it turns up with a vengeance as seen in the GFC. Backward-looking measures of volatility are no better than attempting to drive while just looking at the rear-view mirror.
-
Be sceptical of financial engineering or hard-to-understand products. The biggest losses for investors in the GFC were generally in products that relied heavily on financial alchemy purporting to turn junk into AAA investments that no one understood.
-
Avoid too much gearing and gearing or the wrong sort. Gearing is fine when all is well. But it magnifies losses when things reverse and can force the closure of positions at a loss when the lenders lose their confidence and refuse to roll over maturing debt or when a margin call occurs forcing an investor to sell just when they should be buying.
-
The importance of true diversification. While listed property trusts and hedge funds were popular alternatives to low-yielding government bonds prior to the GFC, through the crisis they ran into big trouble (in fact Australian Real Estate Investment Trusts (REITs) fell 79%), whereas government bonds were the star performers. In a crisis, “correlations go to one” – except for true safe havens.
-
The importance of asset allocation. The GFC reminded us that what matters most for your investments is your asset mix – shares, bonds, cash, property, etc. Exposure to particular shares or fund managers is second order.
Source: AMP Capital 12 September 2018
Important notes: While every care has been taken in the preparation of this article, AMP Capital Investors Limited (ABN 59 001 777 591, AFSL 232497) and AMP Capital Funds Management Limited (ABN 15 159 557 721, AFSL 426455) makes no representations or warranties as to the accuracy or completeness of any statement in it including, without limitation, any forecasts. Past performance is not a reliable indicator of future performance. This article has been prepared for the purpose of providing general information, without taking account of any particular investor’s objectives, financial situation or needs. An investor should, before making any investment decisions, consider the appropriateness of the information in this article, and seek professional advice, having regard to the investor’s objectives, financial situation and needs. This article is solely for the use of the party to whom it is provided.
Five things you need to know about the Australian economy
For years now, many have told us that Australia is heading for an imminent recession. By contrast official forecasts have long been looking for several years of above trend growth. In the event neither has happened and we don’t see them happening anytime soon. Against this backdrop there are five things you should know about the Australian economy.
First – the Read MoreFor years now, many have told us that Australia is heading for an imminent recession. By contrast official forecasts have long been looking for several years of above trend growth. In the event neither has happened and we don’t see them happening anytime soon. Against this backdrop there are five things you should know about the Australian economy.

First – the economy grew solidly over the last year
After several years of muddling along the Australian economy actually perked up over the last year with GDP growing a surprisingly strong 3.4% year on year, its fastest since 2012.

Source: ABS, AMP Capital
That growth has been able to range between just below 2% and just above 3% over the last six years despite a large drag on growth from the fall back in mining investment is actually pretty good. But it’s below the norm for Australia, which has averaged around 3% GDP growth per annum over the very long term. It should also be remembered that strong population growth has been one of the reasons for the relative resilience of Australia’s economy, but over the last year per capita GDP growth at 1.8% has been running below that in the US and in line with that in Europe.
Second – growth is likely to slow a bit from here
While economic growth averaged a strong 1% quarterly pace in the first half of the year it’s likely to slow going forward:
-
The housing construction cycle is turning down as approvals trend down and the cranes come down. Falling alterations and additions won’t help.
-
Growth in consumer spending is likely to slow given weak wages growth, high levels of underemployment and slowing wealth gains as home prices fall. With falling home prices its unlikely that households will be prepared to keep running down the household saving rate – which is now at a 10 year low of just 1% – to make up for weak income growth.
-
Business investment plans for the current financial year are still subdued pointing to roughly flat investment (if plans for this year are compared with those made a year ago) and political uncertainty could start to weigh ahead of a potential change in government.

Source: ABS, AMP Capital
-
Drought could knock 0.5 percentage points off economic growth this year.

Source: ABS, Bureau of Meteorology, AMP Capital
-
While agricultural production as a share of GDP is now just 2.5%, a 20% slump in farm production as seen in past droughts would still knock 0.5% off economic growth. If it turns into an El Nino phenomenon it could be worse.
Third – but it’s not going into recession
Despite these drags, recession will continue to be avoided just as it has been over the past 27 years:
-
Over the past five years or so the slump in mining investment back to more normal levels has knocked around 1.5% per annum from GDP growth. However, mining investment is no longer 7% of the economy and it’s near the bottom so its drag on GDP growth is approaching zero.

Source: ABS, AMP Capital
-
Public infrastructure spending is rising and has further to go.
-
Net exports are likely to add to growth as the completion of resources projects boosts resources export volumes, although a US/China trade war is a threat here.
-
Profits for listed companies are rising in contrast to the 2014-16 period. This is a positive for investment.

Source: UBS, AMP Capital
-
While profit growth has slowed from 17% in 2016-17 to around 8% it’s positive and 77% of companies in the recent reporting season (the highest since the GFC) have seen rising profits with 86% of companies raising or maintaining their dividends indicating confidence in the outlook.

Source: AMP Capital
So while housing construction will slow and consumer spending is constrained, a lessening drag from mining investment and slightly stronger non-mining investment along with solid export growth provide an offset and are expected to see growth between 2.5-3% going forward. Down from over the last year and slower than the RBA expects, but stronger than many doomsters see.
Fourth – spare capacity will remain for a while yet
With the economy’s potential (or sustainable) growth rate running around 2.75% and actual economic growth likely to run around this spare capacity in the economy will be with us for a while yet. To use it up we really need a long period of above trend economic growth, but this looks unlikely. Spare capacity remains most obvious in the labour market where the underutilisation rate remains historically high at near 14%. With it likely to remain high for some time to come it’s hard to see much acceleration in wage growth or inflation in the economy.

Source: ABS, AMP Capital
Fifth – which means RBA rate hikes are a long way off
The RBA’s forecasts for continuing solid economic growth and a gradual rise in underlying inflation argue against a rate cut and support the case for an eventual hike. But our more constrained view on growth implying lower for longer wages growth and inflation along with the risks posed by likely further falls in Sydney and Melbourne home prices, tightening bank lending standards and the drought indicate a rate hike is unlikely to be justified any time soon. The next move in rates is probably still up but not until second half 2020 at the earliest and there is a risk that the next move will actually be down if falling home prices pose a significant threat to consumer spending and inflation starts falling again.
Implications for investors
There are several implications for Australian investors.
First, continuing growth should provide support for reasonable returns from Australian growth assets.
Second, bank deposits are likely to provide poor returns for investors for a while yet.
Third, while Australian shares are great for income, global shares are likely to remain outperformers for capital growth.
Finally, the outlook remains for a further fall in the $A. With the RBA comfortably on hold and the Fed raising rates every three months (with the next move coming this month), the interest rate gap between Australia and the US will go further into negative territory making it even more attractive to park money in the US and not Australia which will drag the $A down. Threats to global growth from a trade war and problems in emerging countries will also weigh on the $A.
Source: AMP Capital 6 September 2018
Important notes: While every care has been taken in the preparation of this article, AMP Capital Investors Limited (ABN 59 001 777 591, AFSL 232497) and AMP Capital Funds Management Limited (ABN 15 159 557 721, AFSL 426455) makes no representations or warranties as to the accuracy or completeness of any statement in it including, without limitation, any forecasts. Past performance is not a reliable indicator of future performance. This article has been prepared for the purpose of providing general information, without taking account of any particular investor’s objectives, financial situation or needs. An investor should, before making any investment decisions, consider the appropriateness of the information in this article, and seek professional advice, having regard to the investor’s objectives, financial situation and needs. This article is solely for the use of the party to whom it is provided.
Why the $A is likely to fall further and shorting it is good protection against things going wrong globally
For the last two calendar years the Australian dollar has defied our expectations for weakness. But after hitting $US0.81 in January it’s been trending down as US interest rates fell below the Australian cash rate, the threat of a US-driven trade war increased and it recently broke below a short-term range around $US0.74 and fell as low as $US0.72 on
Read MoreFor the last two calendar years the Australian dollar has defied our expectations for weakness. But after hitting $US0.81 in January it’s been trending down as US interest rates fell below the Australian cash rate, the threat of a US-driven trade war increased and it recently broke below a short-term range around $US0.74 and fell as low as $US0.72 on fears of contagion to global growth from a crisis in Turkey. This note looks at outlook for the $A and why it makes sense for Australian-based investors to hold a decent exposure to foreign exchange.

What are the fundamental drivers of the $A?
The Australian dollar tends to move in line with relative price differentials over the long term. This is the theory of purchasing power parity (PPP) according to which exchange rates should equilibrate the price of a basket of goods and services across countries – see the next chart.

Source: RBA, ABS, AMP Capital
If over time Australian inflation and costs rise relative to the US, then the value of the $A should fall relative to the $US to maintain its real purchasing power and competitiveness. But in the short to medium term, swings in the $A are largely driven by swings in the prices of Australia’s key commodity exports and the terms of trade (when they go up the $A tends to rise and vice versa) and relative interest rates such that a rise in US rates relative to Australian rates makes it more attractive to park money in the US and hence pushes the $A down.
Why the $A is likely to fall further
At current levels, the Australian dollar at around $US0.7350 is around where it should be on a long-term purchasing power parity basis – see the first chart. But the $A rarely spends much time at the purchasing power parity level and tends to be pushed to extremes above and below it. Our view remains that the downtrend in the $A that started in 2011 when the iron ore price peaked at over $US190/tonne has further to go. The main reason is the interest rate differential in favour of the $A is likely to go further into negative territory as the Fed continues to hike rates and the RBA remains on hold. This is making it relatively less attractive to park money in Australia putting downwards pressure on the $A. The Fed is on track to hike rates again next month as the US economy has continued to strengthen highlighted by a very tight jobs market. This will take the Fed Funds rate to a range of 2-2.25%. If the RBA leaves rates on hold at 1.5%, as is almost certain, then the gap between Australian and US official interest rates will fall to -0.5-0.75%, from a whopping +4.5% in 2011. Periods of a low and falling official interest rate differential between Australia and the US usually see a low and falling $A.

Source: Bloomberg, AMP Capital
While some think that the RBA just follows the Fed there has often been significant divergences. This has notably been the case lately with the RBA hiking in 2009 (as the mining boom returned) and the Fed holding and the RBA continuing to cut in 2016 even though the Fed had commenced a tightening cycle. While US growth is running well above potential and has largely used up spare capacity, Australian growth has been running below potential and there is plenty of spare capacity. This is evident in the combination of unemployment and underemployment in the US running about as low as it ever gets whereas in Australia it’s about as high as it ever gets.

Source: Bloomberg, AMP capital
While there are some positive signs in Australia with investment picking up, strong export volumes and strong employment growth, uncertainty remains high around the housing sector and consumer spending. Wages growth and inflation also remain very low so the RBA is likely to be on hold for a long while yet as the Fed continues to hike. Given falling home prices in Sydney and Melbourne a rate cut cannot be ruled out if it threatens overall growth and inflation.
Our base case is that solid global growth will support commodity prices – particularly iron ore and coal – and that this will provide a floor for the $A in the high $US0.60s. However, history suggests we are still in a commodity price bear market after last decade’s surge in prices, the recent 20% or so plunge in metal prices is a warning of weakness and there are threats to emerging world growth from a rising $US, a potential contagion from Turkey, slower growth in China and from US trade policy.

Source: Global Financial Data, Bloomberg, AMP Capital
In the very short term the Australian dollar is oversold and this along with speculative short positions warns of a bounce higher. However, beyond this our assessment is that the $A has further to fall and will likely reach $US0.70 by year end.
What does it mean for investors?
With the risks skewed towards more downside in the value of the $A, there are several implications for investors.
First, there remains a strong case to maintain a decent exposure to offshore assets that are not hedged back to Australian dollars. A decline in the value of the $A boosts the value of an investment in offshore assets denominated in foreign currency by one for one. This can be seen in relation to international equity returns in the next table. The first column shows the return from global shares in local currency terms; the second shows the return in Australian dollars (if foreign currency exposures are not hedged back to Australian dollars); the third column shows the difference, which is the change in the $A on a weighted basis; and the final column shows the return to global shares if hedged back to Australian dollars.

Source: Thomson Reuters, AMP Capital Investors
When the $A rises as it did last year it reduces returns from international shares for an unhedged investor. But when the $A falls as was the case in 2005, 2008, 2013, 2014 and 2015 it boosts the value of global assets and hence the return from global shares for an unhedged investor.
Furthermore, when Australian interest rates are above global rates, investors are “paid” to hedge their foreign currency exposure back to Australian dollars. As can be seen in the last column the return from global shares when hedged back to Australian dollars has been higher than the local currency return because hedging investors receive the difference between Australian and foreign rates. However, with Australian rates falling versus global rates the incentive to hedge is falling.
Second, if the global outlook turns sour, having an exposure to foreign currency provides protection for Australian investors as the $A usually falls in response to threats to global growth. As can be seen in the next chart there is a rough positive correlation between changes in global shares in local currency terms and the $A. Major falls in global shares associated with the emerging market/LTCM crisis in 1998, the tech wreck into 2001, the GFC, the Eurozone crises and the 2015-16 global growth scare saw sharp falls in the $A. This has been evident this year with worries about a trade war and Turkey weighing on the $A. So being short the $A and long foreign exchange provides good protection against threats to the global outlook.

Source: Bloomberg, AMP Capital
Finally, continuing weakness in the $A will be positive for Australian sectors that compete internationally like tourism, higher education, manufacturing, agriculture and mining.
Source: AMP Capital 21 August 2018
Important notes: While every care has been taken in the preparation of this article, AMP Capital Investors Limited (ABN 59 001 777 591, AFSL 232497) and AMP Capital Funds Management Limited (ABN 15 159 557 721, AFSL 426455) makes no representations or warranties as to the accuracy or completeness of any statement in it including, without limitation, any forecasts. Past performance is not a reliable indicator of future performance. This article has been prepared for the purpose of providing general information, without taking account of any particular investor’s objectives, financial situation or needs. An investor should, before making any investment decisions, consider the appropriateness of the information in this article, and seek professional advice, having regard to the investor’s objectives, financial situation and needs. This article is solely for the use of the party to whom it is provided.

