

Olivers Insights
2021 – A list of lists regarding the macro investment outlook
Dr Shane Oliver, Head of Investment Strategy and Chief Economist provides a summary of key insights and views on the investment outlook in simple point form.
The key points are as follows:
2020 turned out far better for investors than was feared with average balanced growth superannuation funds estimated to have returned around 3%.
2021 is expected to provide solid returns and see
Read More
Dr Shane Oliver, Head of Investment Strategy and Chief Economist provides a summary of key insights and views on the investment outlook in simple point form.
The key points are as follows:
-
2020 turned out far better for investors than was feared with average balanced growth superannuation funds estimated to have returned around 3%.
-
2021 is expected to provide solid returns and see a further rotation from pandemic winners to cyclical investments, with Australian shares likely to outperform US shares.
-
Watch: coronavirus and vaccines; US politics; China tensions; inflation; and the hit to immigration in Australia
Download pdf copy – Oliver’s Insights: 2021 – A list of lists regarding the macro investment outlook
If you would like to discuss any of the issues raised by Dr Oliver, please call on |PHONE|.
Modern Monetary Theory – can it help with economic problems or is it just another Magic Money Tree?
For some years now Modern Monetary Theory (MMT) has been gaining prominence as a solution to the perceived failure of traditional economic policies to achieve full employment & meet inflation targets, despite at or near zero interest rates. MMT has been given added impetus by the hit to economic activity from coronavirus. And with even Reserve Bank of Australia Governor
Read MoreFor some years now Modern Monetary Theory (MMT) has been gaining prominence as a solution to the perceived failure of traditional economic policies to achieve full employment & meet inflation targets, despite at or near zero interest rates. MMT has been given added impetus by the hit to economic activity from coronavirus. And with even Reserve Bank of Australia Governor Philip Lowe referring to it in question time after an address last week, it’s clearly hit the big time. Its supporters seem to claim it will solve many of our economic problems. But its detractors see it as just another simplistic economic theory with plenty of problems. In fact, Governor Lowe said, “there’s actually not much monetary, not much modern and not much theory in it. It’s really a series of propositions about fiscal policy.” So can it help or is it just another fad like monetary targeting? Its easy to get bogged down in the details of MMT, so I will keep it simple.

What is MMT?
Modern Monetary Policy has a number of key propositions:
-
The government can just keep spending until it meets its objectives – whether that’s traditional macroeconomic objectives like boosting inflation or full employment, or conceivably everything else including reducing inequality, dealing with climate change and more affordable housing.
-
Many MMT supporters advocate a government job guarantee in the form of community work programs that are paid at the minimum wage which can be dialled down once full employment is reached and then dialled up again if needed.
-
Rather than raising taxes or issuing debt, government spending can be financed by the government directing its central bank, eg, the RBA in Australia, to print the money and give it to the government to spend, subsuming monetary policy into fiscal policy.
-
As long as there is spare capacity in the economy in the form of unemployment and underutilised factories, monetary financing of government spending should not be inflationary.
-
Worries about budget deficits and sovereign debt are overblown if the government borrows in its own currency – so the government can just print more money to finance itself and service its debts and there is no risk of a currency crisis.
-
It also contends that a government that issues its own currency can borrow at any interest rate it wants and that all government spending can be financed by debt or money printing – but these are a bit way too whacky for me!
Monetary financing of government is not new
So MMT basically advocates using printed money from the central bank to directly finance government to spending, which boosts the economy. This concept is not new. From university economics in the early 1980s, I remember the equation that:
Government spending = Tax bonds money printing
Which basically means that government spending can be financed by taxes, the issuance of more debt or the printing of more money. Of course, in the early 1980s in developed countries, the financing of government spending by printing money (beyond growth in the money supply consistent with growth in the economy) was and has remained out of fashion because it was seen as inflationary following the hyperinflation in the Weimar Republic in 1920s Germany, the experience of the late 1960s and early 1970s where expanded welfare and Vietnam War spending was partly financed by money printing and given the experience in many South American countries with money printing and hyperinflation. At the back of most economists’ minds is the Quantity Theory of Money that states:
M times V = P times T
where M = money supply, V = its velocity of circulation in the economy, P = prices and T = transactions or real GDP. V and T were thought to be constant in the short term so an increase in money supply would lead to an increase in prices, ie, inflation.
So given this and the experience with high inflation at various times, the monetary financing of government spending has been seen as a no no! And this has been reinforced by the separation of monetary and fiscal policy in Australia and many countries, with central banks being made independent.
MMT does provide some useful insights or reminders
Of course, the experience over the last decade has highlighted the already well-known failings of the quantity theory of money – put simply there are different forms of money and its speed of circulation in the economy (or V) is not constant. For example, quantitative easing (QE) led to an increase in the money supply in Europe, the US and Japan last decade but it was narrow money (like cash and bank reserves) not credit and the circulation of money through the economy slowed so there was not much, if any, increase in inflation. This was contrary to some hard money fanatics who claimed that QE would lead to hyperinflation. But it didn’t even get us back to most central banks’ inflation targets of around 2% p.a.
MMT reminds us, via Proposition 4 above that, as long as there is spare capacity in the economy, using printed money to finance public spending should not be inflationary. This is consistent with the experience of last decade which was characterised by spare capacity globally and taken together with a fall in the velocity of circulation of money in the economy explains why inflation did not take off despite QE boosting the money supply.
But it also explains why Zimbabwe and Venezuela have had a different experience – they boosted their money supply to finance government spending but as there was no spare capacity this just led to hyperinflation as too much money chased too few goods.
Moreover, budget deficits and public debt has blown out dramatically from where they were at the time of the budget austerity obsession early last decade (the deficit blow out seemed to be the central issue in Australia’s 2013 election!) without major consequences. This seems to line up with the MMT assertion that worries about budget deficits and public debt are overblown for countries that borrow in their own currency.
And using government spending to employ unemployed workers also has merit. In fact, it’s standard Keynesian economics.
But what are the problems with MMT?
But while MMT provides some useful insights it has big problems:
-
First, it gives the impression there is always some sort of free lunch. That the central bank can just print money – like some sort of Magic Money Tree – and all economic problems can be solved. But as an old friend of mine used to repeatedly remind me, “you can’t make something out of nothing.” Of course, in the current environment of high unemployment and inflation below target, there perhaps is a bit of a free lunch if more government spending financed by money printing can result in full employment and boost inflation back to target. But contrary to what some MMT supporters imply, the economy is not always in a position of spare capacity.
-
Second, the traditional concern about budget deficits and rising public debt is not always overblown. When the economy is strong, it can cause overheating as the competition for workers and funding can push up wages, prices and interest rates “crowding out” more productive private sector activity. Budget deficits and high public debt are not a problem now as there is spare capacity, economies are not overheating and interest rates are low but this won’t always be the case.
-
Third, MMT underestimates the costs and low productivity associated with large scale public employment programs. This has been evident in the failure of “work for the dole” schemes in Australia to make much headway.
-
The more fundamental problem with MMT is that governments may have trouble turning off the monetary and fiscal stimulus when spare capacity is used up and inflation hots up. Not only is it hard to get the timing right economically, but it’s compounded by politicians in government having an incentive to keep the stimulus going to get re-elected. Politicians risk becoming addicted to the flow of money from the central bank’s Magic Money Tree, resulting in wasteful government spending and eventually high inflation or hyperinflation. And once the inflation genie gets out of the bottle, it’s hard to get it back in as we saw in the 1970s.
This is precisely why central banks are independent of politicians.
What’s the difference between QE and MMT?
Normally central banks implement monetary policy by changing interest rates. But when interest rates have fallen to zero, central banks have been turning to boosting the quantity of money. And this is called quantitative easing (or QE). QE involves a central bank printing money and using that money to buy government and private sector securities that have already been issued or to lend directly or via banks to pump cash into the economy.
Quantitative easing is more indirect than what is advocated by MMT as it involves using printed money to buy bonds that have already been issued into the secondary market. It can help the economy by lowering long term borrowing costs (as the bond buying pushes up bond prices which pushes down their yield and so pulls down fixed mortgage rates as well), by pushing down the currency (as its supply goes up) and by forcing investors in government bonds into more risky assets like shares, which increases the availability of funds in the economy and pushes up asset prices resulting in a positive wealth effect.
Some would say it’s the same thing as monetary financing as the bond holders who have sold their bonds to the central bank then have more scope to directly buy bonds off the government. But central banks and MMT supporters would say it’s not the same as the central bank is not being directed in doing this by the government and it’s not directly financing the government as the bonds held by the central bank still have to be paid back at maturity just as if the bonds were held by say a bank.
So QE as currently practiced is not really MMT or helicopter money – which would see a central bank directly give money to the government to spend.
But of course, QE is aiding the government’s stimulus program by helping to keep bond yields down. And unlike in the period of quantitative easing seen in the US and Europe last decade, which was accompanied by fiscal austerity, exploding budget deficits today provide a vehicle for the increased money supply to add to spending in the economy. So QE today is likely to be more potent than last decade when it occurred at a time of fiscal austerity which led to an environment akin to driving a car with one foot on the accelerator and the other on the brake.
In this sense, despite all the differences, QE may achieve the same thing as MMT – but because it’s controlled by an independent central bank, it avoids the pitfalls of MMT which sees politicians left in charge and at greater risk of leaving the punchbowl at the party for too long for political reasons.
What does it all mean for investors?
For now, spare capacity is massive which is keeping inflation is below target and so there is plenty of room for big budget deficits and this may remain the case for a while – so interest rates could remain low for several years. This has the effect of bidding up the value of other assets as investors continue to search for more attractive yields than what’s offered by bank deposits and bonds.
But the combination of massive quantitative easing and fiscal spending along with increasing talk of MMT highlights that policy makers are increasingly focussed on taking more risks with inflation. This has also been highlighted by the recent move by the Fed and RBA to shift from raising rates pre-emptively ahead of a forecast rise in inflation – to only raising them when actual inflation is back at target. Inflation has moved in decades long cycles and so too have attitudes to it. After the deflation of the 1930s, the focus was on full employment and taking risks with inflation. But after inflation got out of hand in the 1970s, the focus was on keeping it down with inflation targeting and independent central banks. Now the inflation of the 1970s is long forgotten and so the focus is shifting back to full employment. Ultimately the combination of ultra-easy monetary policy, huge budget deficits and a retreat from globalisation will add to the risk of an eventual pick-up in inflation – but at this stage this looks like something to be wary of on a five to ten-year horizon, but not right now.
Source: AMP Capital 26th Nov 2020
Important notes: While every care has been taken in the preparation of this article, AMP Capital Investors Limited (ABN 59 001 777 591, AFSL 232497) and AMP Capital Funds Management Limited (ABN 15 159 557 721, AFSL 426455) (AMP Capital) makes no representations or warranties as to the accuracy or completeness of any statement in it including, without limitation, any forecasts. Past performance is not a reliable indicator of future performance. This article has been prepared for the purpose of providing general information, without taking account of any particular investor’s objectives, financial situation or needs. An investor should, before making any investment decisions, consider the appropriateness of the information in this article, and seek professional advice, having regard to the investor’s objectives, financial situation and needs. This article is solely for the use of the party to whom it is provided and must not be provided to any other person or entity without the express written consent of AMP Capital.
This article is not intended for distribution or use in any jurisdiction where it would be contrary to applicable laws, regulations or directives and does not constitute a recommendation, offer, solicitation or invitation to invest.
Still The Lucky Country – five reasons why Australian shares are likely to outperform in the year ahead
In May, in a note called The Lucky Country, I argued that due to Australia’s far better control of coronavirus relative to many comparable countries, a stronger economic policy support response to shutdowns, and exposure to China which was well into economic recovery Australia was likely to come through this period of global misery relatively well compared to many other
Read MoreIn May, in a note called The Lucky Country, I argued that due to Australia’s far better control of coronavirus relative to many comparable countries, a stronger economic policy support response to shutdowns, and exposure to China which was well into economic recovery Australia was likely to come through this period of global misery relatively well compared to many other countries – and this may ultimately support Australian shares and other assets relative to other comparable countries’ assets. In the interim, the coronavirus resurgence in Victoria got in the way and we are still not out of the woods as periodic problems in NSW and a cluster in South Australia highlight.

But the basic points remain valid and I continue to thank god I live in The Lucky Country. This note provides an update and looks at five reasons why the Australian economy is well placed for a solid recovery in 2021 and why Australian shares are likely to be relative outperformers versus global shares.
First, better virus control
Australia’s success in “controlling” coronavirus continues to stand out globally (touch wood). Comparing OECD countries in how they are managing the coronavirus outbreak (based on new cases per capita, deaths per capita, total cases per capita and testing per capita) Australia ranks first, with NZ 2nd (this has been flipping around) compared to the US at 22nd, Sweden at 28th, Spain at 32nd and France at 36th. See the next table.
Less congested living, better weather, a younger population and luck may have all played a role, but the big driver looks to have been a public health response based on expert medical advice as opposed to bravado and crackpot theories. This has been characterised by rigorous contact tracing, quarantining and timely and targeted distancing and containment measures. Our institutions have been working well together across various levels of government – in contrast to the US where President Trump has contradicted and weakened the message. And the overwhelming majority of Australians have done the right thing.
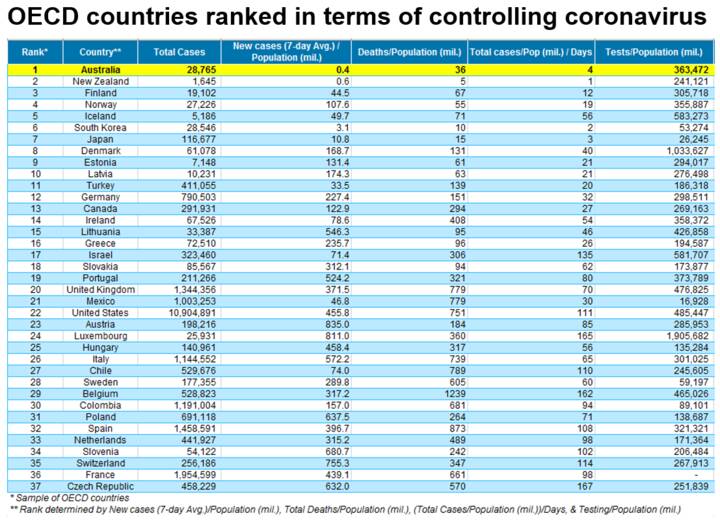
Daily new cases per million people are running at around 0.4 compared to over 400 in the US and deaths are around 36 per million compared to around 700 or more per million in many other major countries. If we had the same deaths per capita as the US, we would have lost an extra 18,000 people to the virus.
Recent news regarding a vaccine is very good with two vaccines (Pfizer and Moderna) showing efficacy of 90% or more in preliminary testing. But there is still a way to go yet – more information regarding efficacy & safety is required & assuming these are positive, it will probably take at least till mid-next year for broad enough coverage to achieve herd immunity (and longer for the whole world). In the meantime, better virus control provides more scope to continue cautiously reopening the economy and confidence for Australians to participate in it.
Second, better economic policy response
The global government policy response to the economic threat posed by coronavirus has been huge. See the next chart.
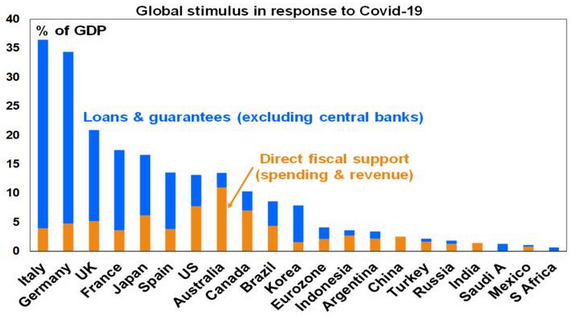
Source: IMF, AMP Capital
But in terms of direct fiscal support, Australia has stood out with the biggest stimulus at nearly 11% of GDP for 2020 in comparison to other major countries. And it’s been well targeted (with the JobKeeper wage subsidy protecting businesses, jobs and incomes) and with stimulus extended in the October Budget into the years ahead with a bring forward of tax cuts and tax write-offs for investment having the effect of muting much feared fiscal cliffs. RBA monetary easing arguably lagged relative to other countries but has now largely caught up, with a full blown bond buying program.
Third, trade exposure to China/Asia
We are benefitting from our biggest export market – China – having now fully recovered and most of our Asian trading partners similarly doing a better job of controlling coronavirus and hence being better placed to recover. This supports demand for our exports and partly explains why prices for our key exports – notably iron ore – are holding up relatively well.
Fourth, the drag from the mining bust is over
The slump in mining investment from around 2013 that has been a key drag on the Australian economy (detracting around 1.5 percentage points per annum from GDP between 2012-13 and 2018-19) is now over and mining investment is now starting to improve. The ABS’ most recent capital spending survey points to growth in mining investment of between 1% to 8% for this financial year. This partly explains the relative strength of WA economic data recently after years of weakness.
Finally, the relatively cyclical Aust economy and share market should benefit from global recovery in 2021
The Australian economy and share market with their relatively high exposure to resources and financials are relatively cyclical in contrast to the US that has a higher exposure to “growth” sectors like IT and healthcare. Consequently, the US share market and the $US tend to outperform in downturns and underperform in upturns. So if the combination of a vaccine and global stimulus drives a strong global economic recovery in 2021 (mainly in the second half) then the Australian economy, shares and $A are likely to be relative beneficiaries.
Implications for the Australian economy
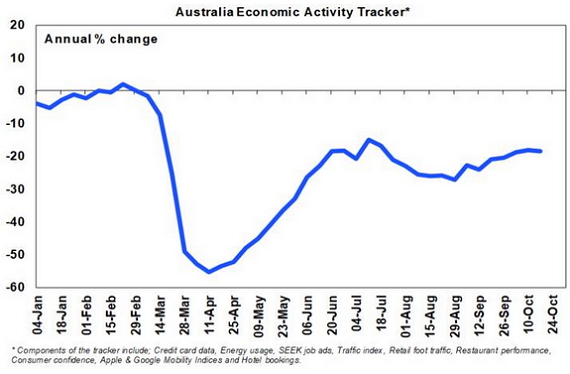
The combination of better virus control, a superior policy response, exposure to faster recovering China and Asia, the shift in mining investment from being a drag to being a boost to the economy and leverage to a cyclical recovery globally should result in a stronger more assured recovery in the Australian economy relative to comparable countries in the year ahead. This is partly evident in our Economic Activity Trackers which are based on weekly data for things like credit card sales, restaurant bookings, job openings, confidence and mobility. While the Victorian lockdown saw Australia’s Economic Activity Tracker fall back around August, it has recently started to accelerate again & is looking stronger than the US and Europe.
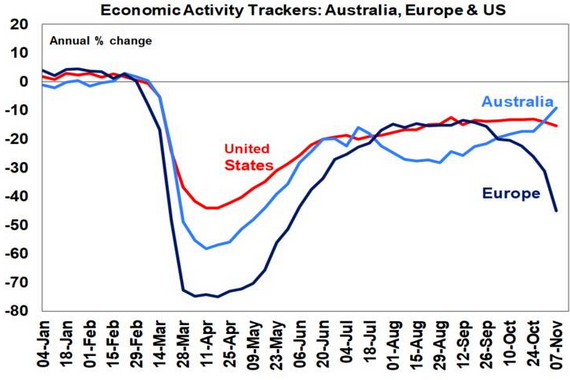
Source AMP Capital
Implications for investors
A relatively stronger recovery for the Australian economy should benefit Australian assets relative to global assets. This could continue to come via an appreciation of the $A and we continue to see the $A rising to around $0.80 over the next year or so. However, it’s also likely the relative underperformance of the Australian share market since October 2009 has run its course. The next chart shows the ratio of Australian share prices to global share prices in local currency terms. Over the last 30 years, the relative performance of Australian shares has seen three distinct waves – underperforming through the tech boom until March 2000, outperforming through the resources boom of the 2000s, but underperforming since October 2009 as the mining boom went bust and coronavirus hit cyclical stocks.
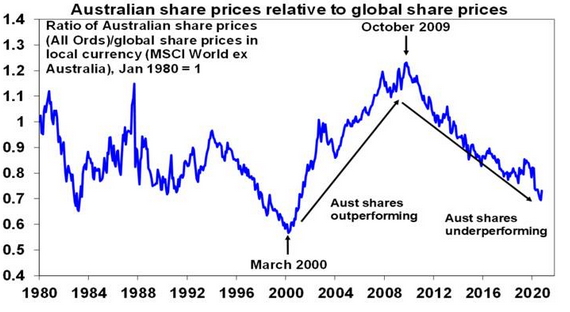
Source: Thomson Reuters, AMP Capital
However, there is now good reason to believe that this relative underperformance will start to reverse in the year ahead if the Australian economy recovers faster, cyclical sectors like resources and financials come back into favour over growth stocks like IT and healthcare and as commodity prices continue to drift up. As a result, it’s hard to maintain a strong case against Australian shares in favour of global shares. We expect Australian shares to provide solid returns next year.
Risks to watch
There are five main risks or potential threats to this.
First – vaccines could prove ineffective leaving all economies vulnerable to waves of coronavirus. However, if Australia remains better at controlling it, it should fare relatively better.
Second – tensions between Australia and China could continue to escalate. So far only a small proportion of exports to China amounting to less than 0.5% of GDP are at risk but if it were to affect iron ore the impact would be greater. A Biden Presidency with a focus on diplomatic solutions to issues with China could provide an off ramp for Australia though.
Third – inflation and bond yields could rise. Initially this would be a good problem as higher inflation would help boost share market earnings. But if bond yields rose too fast it would be a problem for shares and other assets.
Fourth – fiscal support could be withdrawn too quickly. But the Government has shown sensitivity to this & keeps extending it.
Fifth – many fret that the ban on international travel means Australia can’t recover. But this is not really true. The bulk of the 7.3% hit to the economy in the first half came via the shutdowns and impact on confidence with the net impact of the travel ban on tourism & education maybe accounting for a 1% hit to GDP at most. So, while the travel ban will prevent a full recovery if it remains, most economic activity can return. The absence of immigration will slow Australia’s long-term growth rate by around 1% pa if it’s sustained and will weigh on the property and construction sector, but it won’t prevent economic recovery.
Source: AMP Capital 18 Nov 2020
Important notes: While every care has been taken in the preparation of this article, AMP Capital Investors Limited (ABN 59 001 777 591, AFSL 232497) and AMP Capital Funds Management Limited (ABN 15 159 557 721, AFSL 426455) (AMP Capital) makes no representations or warranties as to the accuracy or completeness of any statement in it including, without limitation, any forecasts. Past performance is not a reliable indicator of future performance. This article has been prepared for the purpose of providing general information, without taking account of any particular investor’s objectives, financial situation or needs. An investor should, before making any investment decisions, consider the appropriateness of the information in this article, and seek professional advice, having regard to the investor’s objectives, financial situation and needs. This article is solely for the use of the party to whom it is provided and must not be provided to any other person or entity without the express written consent of AMP Capital.
This article is not intended for distribution or use in any jurisdiction where it would be contrary to applicable laws, regulations or directives and does not constitute a recommendation, offer, solicitation or invitation to invest.
Joe Biden on track to become US president – implications for investors and Australia
Contrary to what would normally be suggested by the worst recession since the 1930’s, high unemployment, the worst riots since 1968 and the poor handling of the coronavirus pandemic Donald Trump performed very well in the US presidential election resulting in a close outcome. However, while counting is still continuing in some key states, major US TV networks and Associated
Read MoreContrary to what would normally be suggested by the worst recession since the 1930’s, high unemployment, the worst riots since 1968 and the poor handling of the coronavirus pandemic Donald Trump performed very well in the US presidential election resulting in a close outcome. However, while counting is still continuing in some key states, major US TV networks and Associated Press have called the result in Biden’s favour and he has claimed victory as it looks highly likely he will secure at least the 270 electoral college votes required to win and possibly 306. In the popular vote President Trump received at least 70.8 million votes but Joe Biden received 75.2 million votes (and still counting), more than 4 million above Trump.

With likely run-offs for both Senate seats in Georgia in January there is a possibility the Democrats ultimately achieve a “clean sweep” having retained control of the House and gaining control of the Senate if they win both seats in Georgia given that this would give them 50 Senate seats plus one vote from the Vice President Harris in the event of ties. However, the likelihood of the Democrats winning both Senate seats in Georgia is low given Georgia is traditionally Republican and the Republican vote in both Senate races was above the Democrat vote.
So, the most likely outcome is a divided government with Biden as President, the Democrats retaining control of the House and Republicans retaining control of the Senate. So, no “blue wave.”
A victory by President Trump based on final counting (which now looks very unlikely) or recounts and challenges (which is possible but unlikely given the margins that Biden is ahead in key states) would mean more of the same. US tax rates would stay low, but the trade war would ramp up again – which would be bad for non-US shares including Australian shares relative to US shares and be positive for the US dollar including against the $A and the Renminbi. This note looks at the key implications of a Biden victory.
Biden’s key policies
Taxation: Biden plans to raise the corporate tax rate to 28% (reversing half of Trump’s cut to 21%), return the top marginal tax rate to 39.6% (from 37%) and tax capital gains and dividends as ordinary income.
Infrastructure: Biden plans to spend $1.3trn over 10 years.
Climate policy: Biden aims for the US to reach net zero emissions by 2050 by raising the cost of fossil fuels & boosting the development of alternatives (possibly with a carbon tax). He would take the US back into the Paris Climate Agreement.
Regulation: Biden is likely to end the era of deregulation.
Healthcare: Biden wants to strengthen Obamacare and limit drug prices.
Trade and foreign policy: Biden would likely de-escalate tensions with Europe and strengthen the alliance, work with international organisations like the World Trade Organisation, work to re-establish the nuclear deal with Iran and adopt a more diplomatic approach to dealing with trade and other issues with China (working with Europe and Asian allies in the process).
Fiscal stimulus: Biden would support another round of fiscal stimulus of around $US3 trillion or so.
But what can we expect given divided govt?
-
Biden’s proposed tax hikes are extremely unlikely to pass into law given blockage from the Senate.
-
Some form of fiscal stimulus is likely to be agreed, with Senate Majority Leader McConnell saying after the election that, “I think we need do it.”, It could come before the end of the year while Trump is still president but is likely to be smaller at say $US1.5 trillion rather than say $3 trillion had the Democrats won the Senate as well.
-
Joe Biden and Mitch McConnell already have a strong working relationship so may be able to get something done on infrastructure spending and other Democrat spending priorities around health care and education. There may be some incentive for Senate Republicans to cut a deal with Democrats if they can make Trump’s corporate tax cuts (most of which expire in 2025) permanent.
-
The Senate is likely to limit what Biden can do on climate policy where spending & tax measures are required, but a lot can still be achieved by regulation of the energy sector and the US will likely re-enter the Paris Climate Agreement.
-
Biden is likely to re-engage and strengthen relationships with traditional US allies and international bodies like the WHO and WTO. The US is also likely to re-enter the Trans-Pacific Partnership (now CPTPP) and the Iran Nuclear Deal.
-
Trade wars are likely to be toned down with the US relying on a more diplomatic approach working with US allies to resolving trade differences with China, using the prospect of cutting Trump’s tariffs as leverage. This doesn’t mean that Biden will be “soft on China” just that a different approach will be used to address US grievances.
-
A Biden presidency is likely to take a more expert based approach to controlling coronavirus ahead of the full deployment of vaccines. This could involve a more coordinated approach and partial lockdowns in the short term, eventually leading to a more confident reopening.
-
Biden will seek to heal divisions and unify the US that were inflamed by President Trump. This may be helped by having Kamala Harris as VP who may very well be the Democrat nominee for President 2024. He will also support the rule of law and reinforce US institutions that have served it well.
Key risks under a Biden presidency
-
Expect more episodes of budget gridlock – including over the debt ceiling that needs to be increased by July next year. As we saw in the Obama years, this can lead to periods of market volatility, but we also saw that Republicans back down quickly once they realise it was working against them. Agreeing more short-term stimulus may cause some short-term share market uncertainty.
-
While the Republican Senate will serve to head off left ward drift under a Biden presidency – by limiting what he can do in areas like tax, climate policies etc – this may alienate many of Biden’s more left-wing supporters reinforcing cynicism. Then again, staying in the political middle is probably the best way to see a Democrat re-elected in 2024.
-
The contentious nature of the election fuelled in large part by Trump’s claims of voter fraud may see divisions remain intense in the US, particularly with Trump sniping on the sidelines. This could lead to unrest in the short term.
-
President Trump could also throw curve balls between now and inauguration day on 20th January – possibly in terms of refusing to leave office (although I suspect key Republicans will progressively desert him) & also potentially in terms of tensions with China, Iran and North Korea.
Economic impact of a Biden presidency
Our base case remains that while it will be bumpy and uneven, the US economy will continue to recover from the coronavirus hit, helped along by more fiscal stimulus & ultra-easy monetary policy. This will be accelerated if highly effective vaccines are deployed to a wide proportion of the population through next year. The negatives from the tax hikes are likely gone due to the Senate and the impact of more regulation under a Biden presidency should be offset by a ramping down of the trade war compared to what would have happened under Trump.
The main near-term risk is that Biden announces another lockdown to slow coronavirus resulting in another hit to growth. But while this is a short term negative it should ultimately result in a more confident reopening like we are seeing in Australia.
Market implications of a Biden Presidency
Share markets have so far responded favourably to news of Biden being ahead in presidential election counting. However, with Republicans likely retaining control of the Senate this is on the grounds that Biden’s promised tax hikes likely won’t happen, but with some sort of fiscal stimulus still likely. Beyond election challenges we are now into a period of the year where shares normally perform well seasonally, and US shares have typically gone up initially in the aftermath of close elections.
Ultimately, looking beyond the initial knee jerk reaction, the combination of averted tax hikes but some more US stimulus and a toning down of the trade war may be slightly more positive for non-US shares and Australian shares relative to US shares and slightly negative for the US dollar including against the Chinese Renminbi and Australian dollar.
The move towards a more diplomatic approach to resolving issues with China could be particularly positive for Australia to the extent that it would also help encourage Australia and China to resolve tensions that have been ramping up recently. This in turn would help avert a further threat to our exports to China and support Australian exporters and the Australian dollar. Trump’s “Phase One” trade deal with China may also have been working against Australia to the extent that reported Chinese restrictions on imports from Australia may have been partly motivated to free up scope for China to import more from the US to meet the terms of its deal with Trump.
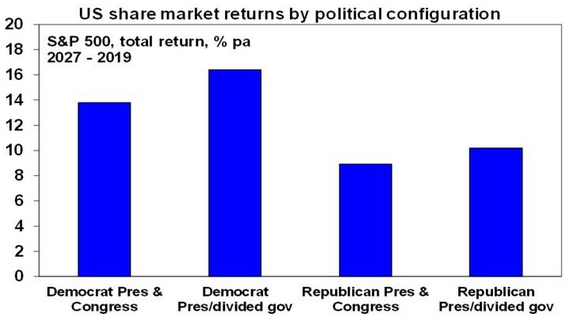
For those worried about “left wing” Democrats, it’s worth noting that US shares have done best under Democrat presidents with an average return of 14.6% pa since 1927 compared to an average return under Republican presidents of 9.8% pa. However, the best average result has actually occurred when there has been a Democrat president and Republican control of the House, the Senate or both. This has seen an average return of 16.4% pa. By contrast the return has only averaged 8.9% pa when the Republicans controlled the presidency and Congress.
Source: Bloomberg, AMP Capital
How would a Democrat Senate change things?
In the unlikely event that the Democrats get control of the Senate via Georgia it would clear the way for significantly more US expansionary fiscal policy and action on climate change but it would likely also mean higher corporate tax in the US and more regulation. Global shares would likely benefit more than US shares and the US dollar would likely fall more. Historically this has been the second-best outcome for share markets. It would probably be the best outcome for Australian shares and the $A as Australia would benefit from more US stimulus, our companies would be relatively more attractive with a higher tax rate in the US and we would likely see less tensions with China.
Implications for Australia
The main positive implications from a Biden Presidency for Australia are likely to be: ultimately a stronger US economy which will benefit the Australian economy; a stronger more consistent relationship with the US; a toning down of the trade war with China in favour of a more diplomatic and engaged approach to resolving trade issues which will be less negative for Australia; and US re-entry into the TPP. More aggressive action on climate change in US may also force Australia and Australian companies (that engage with the US) down a more aggressive response to climate change too. Beyond short term uncertainties around US civil tensions in the aftermath of the election and when US fiscal stimulus will come, overall, we see it as benefitting Australian shares and the Australian dollar.
Source: AMP Capital 9th November 2020
Important notes: While every care has been taken in the preparation of this article, AMP Capital Investors Limited (ABN 59 001 777 591, AFSL 232497) and AMP Capital Funds Management Limited (ABN 15 159 557 721, AFSL 426455) (AMP Capital) makes no representations or warranties as to the accuracy or completeness of any statement in it including, without limitation, any forecasts. Past performance is not a reliable indicator of future performance. This article has been prepared for the purpose of providing general information, without taking account of any particular investor’s objectives, financial situation or needs. An investor should, before making any investment decisions, consider the appropriateness of the information in this article, and seek professional advice, having regard to the investor’s objectives, financial situation and needs. This article is solely for the use of the party to whom it is provided and must not be provided to any other person or entity without the express written consent of AMP Capital.
This article is not intended for distribution or use in any jurisdiction where it would be contrary to applicable laws, regulations or directives and does not constitute a recommendation, offer, solicitation or invitation to invest.
RBA cuts rates to just 0.1% and ramps up quantitative easing – but will it work?
As had been well flagged, the RBA announced significant further monetary easing at its November meeting. This entails:
A cut in the cash rate, the Term Funding Facility rate (ie, the rate at which the RBA provides cheap funding to the banks for three years) and the three-year bond yield target to 0.1% (all from
Read More
Broad based additional easing from the RBA
As had been well flagged, the RBA announced significant further monetary easing at its November meeting. This entails:
-
A cut in the cash rate, the Term Funding Facility rate (ie, the rate at which the RBA provides cheap funding to the banks for three years) and the three-year bond yield target to 0.1% (all from 0.25%). This takes the cash rate to a new record low. This leaves Australia’s official interest rate broadly consistent with rates in comparable countries around zero.

Source: Bloomberg, AMP Capital
-
An additional bond buying (or quantitative easing) program, beyond what would occur for maintaining the three-year bond yield at 0.1%, of $100bn of five to ten-year bonds over the next six months, with an 80%/20% split across Federal/state bonds. This a bit faster than the market had expected where most saw it spread out to end next year and the RBA has said it will keep it under review which means that it could be increased. It involves the RBA using newly printed money to buy already issued government bonds which has the effect of injecting cash into the economy, increasing the supply of Australian dollars and pushing down bond yields and long-term borrowing costs. It makes it easier for the Government to finance its $214bn budget deficit as the RBA will be indirectly buying the equivalent of nearly half the value of bonds to be issued to finance it.
-
A formal revision to forward guidance for monetary policy to now say the RBA “will not increase the cash rate until actual inflation is sustainably within the 2 to 3 percent target range. For this to occur, wages growth will have to be materially higher than it is currently. This will require significant gains in employment and a return to a tight labour market.” This means the RBA will take longer to raise interest rates compared to the old forward guidance that just required “progress” towards full employment and confidence that inflation will be sustainably in the target band. The RBA said that it is not expecting to increase rates for at least three years but I suspect it won’t be till 2024 at the earliest. This basically means that borrowers can be confident that the borrowing costs will stay down for several years to come.
What’s driving the latest easing?
Put simply, the RBA’s economic forecasts show that it does not expect to meet its inflation and employment objectives over the next two years and it sees the recovery as being bumpy and drawn out. It has been undershooting its 2-3 percent inflation objective for the last five years now.

Source: ABS, AMP Capital
More importantly the coronavirus hit to the economy has taken us further away from full employment and the RBA sees addressing the high rate of unemployment as an “important national priority.” Of course, fiscal policy is likely more powerful in terms of driving actual spending. But the RBA remains committed to do what it can and is under pressure to act when it’s not expecting to meet its objectives. It feels that monetary easing is likely to gain more traction now the economy is reopening and can’t ignore the faster pace of quantitative easing in other major countries. The latter has the effect of pushing up the $A relative to what it otherwise would be which in turn slows the economic recovery.
Why not just lower the inflation target?
Surely low price rises or falling prices are good. So, why not just lower the inflation target. This would be crazy. First, the whole point of having an inflation target is to anchor inflation expectations. If the target is just moved whenever it’s breached, it won’t be taken seriously & there would be no point having it.
Second, statistical measures of inflation tend to overstate actual inflation and targeting too low inflation could mean we are knocked into deflation in an economic downturn.
Third, deflation is not good if it means falling wages, high unemployment, falling asset prices and rising real debt burdens.
Fourth, low inflation is synonymous with low wages growth and this contributes to a sense of dissatisfaction in the community.
Finally, it’s not just about below target inflation but also about reducing high levels of unemployment and underemployment.
But will the banks pass on the RBA rate cuts?
Passing all of the 0.15% cut on will mean some downwards pressure on bank profit margins as a significant chunk of deposits are already at or near zero rates – and the banks won’t want to cut those negative. But I think the banks will pass most of it on under pressure from the RBA and Government who have been providing them with a lot of support (including cheap funding which is now 0.15% cheaper) and if they don’t they will face a public backlash. One way around it is to cut their standard variable rates by say 0.1% and then cut their fixed rates by say 0.2%, as the latter only benefits new customers but gains publicity brownie points (made possible by lower funding costs on the back of lower bond yields due to RBA bond buying). This is what happened in March. Three-year fixed rate mortgages are already averaging around a very low 2.35%.

Source: RBA
But will the further easing help anyway?
While the further easing announced by the RBA won’t have a huge impact compared to say the boost from the Budget, it will have a positive impact on the economy at the margin. First, even just a 0.1% reduction in mortgage rates will mean roughly a $400 a year reduction in interest costs on a $450,000 mortgage. Note that the level of household debt in Australia is more than double the level of household bank deposits so the household sector is a net beneficiary of lower interest rates. Second, a further reduction in fixed rates will further spur new home demand. Third, further rate cuts and an increase in the supply of Australian dollars on the back of expanded quantitative easing will help keep the $A lower than otherwise which helps exporters and companies competing with imports. Finally, extra RBA bond buying will make it easier for the Government to run its large budget deficit.
What about the risk of financial instability?
There is certainly a risk that the combination of even lower mortgage rates combined with a notable easing in lending standards (with the removal of responsible lending obligations and the First Home Loan Deposit Scheme) will drive household debt levels even higher, posing the risk of increased financial instability in the years ahead, particularly if house prices ultimately correct in the face of substantially lower immigration. Right now though, the RBA is more focused on helping people get jobs and avoiding debt servicing problems.
Will the RBA take rates negative?
This is unlikely as the evidence as to whether they have worked in Europe and Japan is mixed and they confuse people which may depress confidence. As a result, the RBA has regularly said that negative rates are “extraordinarily unlikely” in Australia. That said with central banks in the UK, Canada and NZ considering them, negative rates can’t be ruled out entirely to the extent that if other central banks go down that path, it may put more pressure on the RBA to do so too. As long as the Fed doesn’t go negative though I think it’s unlikely.
Is the RBA now out of bullets?
The RBA has now hit the bottom of the barrel in terms of conventional interest rate cuts, but as other major central banks have shown since the GFC, there is still plenty it can do in terms of ongoing quantitative easing.
Implications for investors?
There are a number of implications for investors from the latest easing by the RBA. First, ultra-low interest rates will likely be with us for several more years, keeping bank deposit rates unattractive so it’s important for investors in bank deposits to assess alternative options. Second, the low interest rate environment means the chase for yield is likely to continue supporting assets offering relatively high sustainable yields. This is likely to include Australian shares where despite sharp cuts to dividends, the grossed-up for franking credits dividend yield on shares remains far superior to the now even lower yield on bank term deposits. Investors need to consider what is most important – getting a decent income flow from their investment or absolute stability in the capital value of that investment. Of course, the equation will turn less favourable if economic activity deteriorates again.

Source: RBA, Bloomberg, AMP Capital
Third, the ongoing decline in mortgage rates along with easing lending standards will help boost house prices but bear in mind that high unemployment and the hit to immigration will likely impact in the year ahead. The housing outlook also varies dramatically between cities & within them given rising demand for outer suburban and regional houses over inner city units.
Finally, lower rates and increased quantitative easing will help keep the $A lower than otherwise but it’s still likely to rise over the year ahead if global recovery continues and this pushes up commodity prices.
Source: AMP Capital 03 November 2020
Important notes: While every care has been taken in the preparation of this article, AMP Capital Investors Limited (ABN 59 001 777 591, AFSL 232497) and AMP Capital Funds Management Limited (ABN 15 159 557 721, AFSL 426455) (AMP Capital) makes no representations or warranties as to the accuracy or completeness of any statement in it including, without limitation, any forecasts. Past performance is not a reliable indicator of future performance. This article has been prepared for the purpose of providing general information, without taking account of any particular investor’s objectives, financial situation or needs. An investor should, before making any investment decisions, consider the appropriateness of the information in this article, and seek professional advice, having regard to the investor’s objectives, financial situation and needs. This article is solely for the use of the party to whom it is provided and must not be provided to any other person or entity without the express written consent of AMP Capital.
This article is not intended for distribution or use in any jurisdiction where it would be contrary to applicable laws, regulations or directives and does not constitute a recommendation, offer, solicitation or invitation to invest.
Five reasons why this downturn and subsequent recovery are different – and where are we in the Australian recovery now?
From the get-go back in March, as coronavirus lockdowns hit, there has been much debate about what this recession would be like: how deep and long would it be? Was it going to be a recession like those in decades past or more like the Great Depression of the 1930s? Would it look like a V, a U, a W
Read MoreFrom the get-go back in March, as coronavirus lockdowns hit, there has been much debate about what this recession would be like: how deep and long would it be? Was it going to be a recession like those in decades past or more like the Great Depression of the 1930s? Would it look like a V, a U, a W or an L? Or even a K, square root or a swoosh? These questions gained added currency when actual data showed a bigger hit to economies than what was seen at the end of WW2 or the Great Depression and then confusion reigned as much data showed very steep rebounds. But one thing that seemed clear at the start was that it would be very different to past downturns and this is now even more apparent.

Five reasons why this time is a bit different
There are basically five reasons why this downturn and subsequent recovery is different to those of the past:
-
First, it was caused by government mandated shutdowns and changed individual behaviour to control the spread of coronavirus. This contrasts to normal economic downturns that are preceded by a period of excess (in investment, consumer spending, private debt and inflation) that have to be unwound often with the help of monetary tightening.
-
Second, we have seen massive upfront monetary and fiscal easing which has propped up businesses, jobs, incomes and the flow of credit relative to what otherwise would have occurred. Interest rates have gone to record lows, quantitative easing has become the norm and most importantly fiscal stimulus as a share of GDP in developed countries has been at a record levels. This is in stark contrast to most post war recessions that have seen policy response come with a lag as it’s taken longer to realise the economy needs help. And in the Great Depression, monetary and fiscal policy was first tightened.
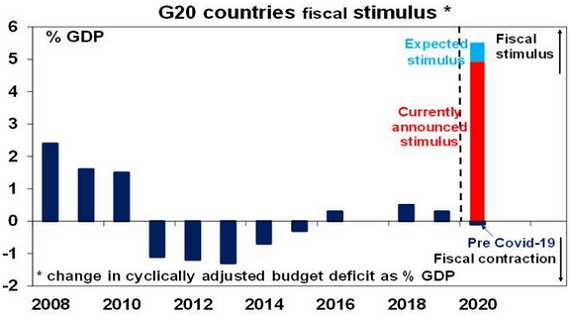
Source: IMF, AMP Capital
-
Third, debt payment holidays, rent moratoriums and a relaxation of insolvency rules have been put in place to avoid the sort of business failures, distressed asset sales, layoffs and hardship that normally occurs in recessions. This has seen for example, company insolvencies in Australia run at around half the level of prior years since April. And the lack of forced sales and income protection partly explain why home prices have held up relatively well.
-
Fourth, it’s dependent on containing the virus. This was seen in terms of the severity of the economic downturn in the first half being less in countries with less deaths from the virus, like Australia. Likewise getting it under control will play a big role in determining the recovery. There are good prospects for vaccines but assuming a reasonable degree of efficacy, it may take 6-12 months before enough people have had it to develop herd immunity. In the meantime, much will depend on social controls, tracing & quarantining.
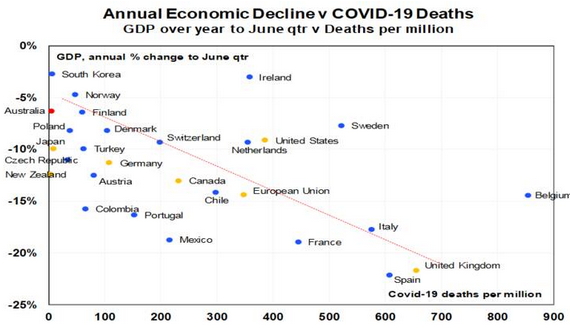
Source: ourworldindata.org, Bloomberg, AMP Capital
-
Finally, the coronavirus shock is likely to have accelerated structural change by more than is normal by driving an even faster embrace of technology in terms of online retailing, working from home, digital meetings, etc. This is not all negative and could mean faster productivity (less time commuting, less time in meetings, less time travelling) but it could result in higher than otherwise structural unemployment (e.g. less jobs associated with commuting and offices, less jobs associated with business travel and less jobs in retailing).
The outworking of all this is likely to be:
-
A sharp initial rebound in economic activity as businesses reopen and people return to work.
-
Followed by the remainder of the recovery being slower and bumpy reflecting periodic outbreaks of the virus and renewed restrictions, some sectors taking longer to recover (eg, travel jobs) & as structural change impacts some jobs.
The Australian recession and recovery
This pattern looks to have been what we have seen so far globally with very sharp falls in GDP in the first half followed by a strong rebound in the September quarter (with GDP data for the US and Europe to be released later this week likely to show an 8% or so rebound), followed by a more uncertain and gradual recovery going forward – particularly as the resurgence of the virus leads to tightening restrictions in Europe (as we are now seeing in France and Germany) and possibly the US. This can be seen in our projections for the level of real global GDP in the next chart. In particular, global GDP will take years to get back to its pre-coronavirus level which means a long period of spare capacity and low inflation/low interest rates.
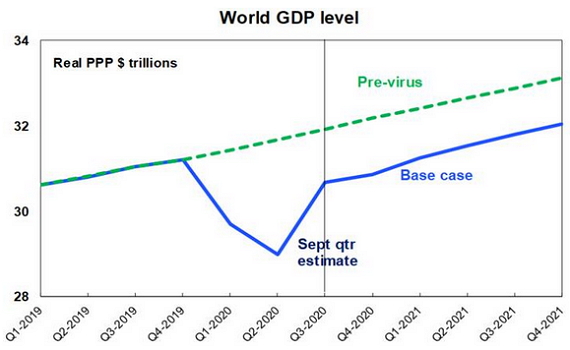
Source: AMP Capital
The Australian economy looks to be following a similar pattern, although the initial recovery has been slowed through the September quarter by Victoria’s hard lockdown. As a result, we only expect 1% or so growth in the September quarter, but a stronger rebound in the December quarter as Victoria reopens. Our forecasts for the level of real Australian GDP are shown in the next chart. Note that while a return to growth in the September quarter will mean that technically the recession is over – this really is just a technicality because the level of activity will still be a long way below its pre-coronavirus level.
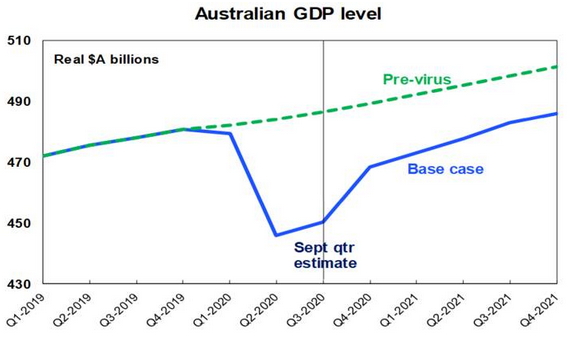
Source: AMP Capital
Because most traditional economic data is infrequent, we have constructed Economic Activity Trackers for the US and Australia which track weekly data releases for things like traffic, direction requests from phones, confidence and spending. This clearly shows the initial hard decline in the economy into mid-April, followed by a strong bounce into July on reopening. The recovery then faltered a bit and now seems to be getting back on track with Victoria reopening.
Source: AMP Capital
A sharp hit followed by an initial “deep V” rebound can also be seen in Australian employment, which has now recovered about half the job losses seen in April and May.
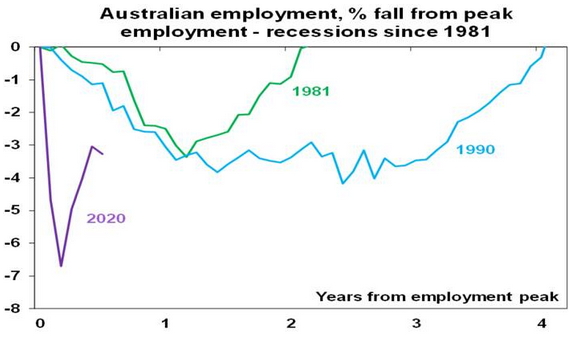
Source: ABS, AMP Capital
Both our Australian Economic Activity Tracker and employment have seen a sharp rebound but remain a long way below pre-coronavirus levels. In terms of the jobs market, this is reflected in “effective unemployment” (ie, adjusting for JobKeeper and reduced participation) of 9.6% and underemployment of 11.4%. So, while Australia has seen some “recovery,” we have a long way go yet to say that we have “recovered”. Our assessment is that the recovery will continue but beyond a December quarter bounce fuelled by reopening, this will be more gradual and bumpy for the reasons noted earlier as some jobs take longer to recover and some won’t come back at all due to structural change and so will need to be replaced by new jobs which will take time, as government supports wind down and as the hit to immigration impacts the property market.
Concluding comment
As we noted back in May in The Lucky Country, Australia has performed far better than many comparable countries in controlling coronavirus, it has seen a stronger economic policy response and its major trading partner in China is well into economic recovery. This along with a bit of luck should result in a stronger, more assured recovery in the Australian economy compared to many other comparable countries which should ultimately benefit Australian assets relative to global assets.
Source: AMP Capital 29 October 2020
Important notes: While every care has been taken in the preparation of this article, AMP Capital Investors Limited (ABN 59 001 777 591, AFSL 232497) and AMP Capital Funds Management Limited (ABN 15 159 557 721, AFSL 426455) (AMP Capital) makes no representations or warranties as to the accuracy or completeness of any statement in it including, without limitation, any forecasts. Past performance is not a reliable indicator of future performance. This article has been prepared for the purpose of providing general information, without taking account of any particular investor’s objectives, financial situation or needs. An investor should, before making any investment decisions, consider the appropriateness of the information in this article, and seek professional advice, having regard to the investor’s objectives, financial situation and needs. This article is solely for the use of the party to whom it is provided and must not be provided to any other person or entity without the express written consent of AMP Capital.

