

Olivers Insights
RBA holds – but more stimulus likely as Victorian lockdown to knock at least $12bn from national GDP
As widely expected, the RBA left interest rates on hold again for the fifth month in a row. It still sees its massive March monetary easing package as working as it expected and signalled more bond buying to keep 3-year bond yields at its 0.25% target but this is just a continuation of its Yield Curve Control
Read MoreRBA on hold again
As widely expected, the RBA left interest rates on hold again for the fifth month in a row. It still sees its massive March monetary easing package as working as it expected and signalled more bond buying to keep 3-year bond yields at its 0.25% target but this is just a continuation of its Yield Curve Control program as opposed to new easing. It also noted that the coronavirus outbreak in Victoria is adding to the uncertain economic outlook and looks to have downgraded its 2021 growth outlook to 5% growth (from 6%) after an unchanged expectation for a 6% contraction through this year) and now sees the unemployment rate rising to 10% later this year. It reiterated that it remains committed to do “what it can to support jobs, incomes and businesses.” However, while it left monetary policy on hold, with Melbourne now in a stage 4 lockdown, pressure for further stimulus – particularly from the Government but also the RBA is building.

Victorian lockdown to cost at least $12bn
After a stage 3 lockdown of Melbourne for three and a half weeks failed to sufficiently slow new cases, Melbourne has now been placed into a far stricter stage 4 lockdown with the rest of Victoria moving into a stage 3 lockdown, both for six weeks.
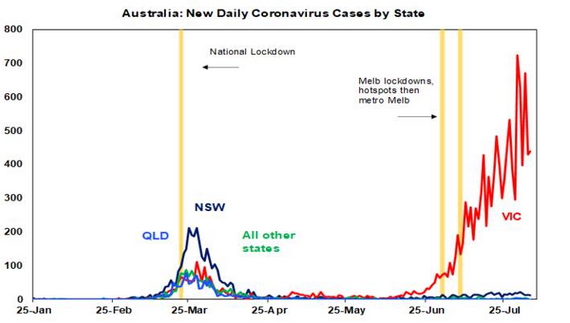
Source: Covid19data.com.au, AMP Capital
Based on New Zealand’s experience with a stage 4 lockdown and allowing for the fact that Victoria had never fully recovered from the initial lockdown, we estimate that this will cost the Victorian economy around $12bn to $14bn. This is up from an initial estimate of the cost of the stage 3 lockdown of Melbourne of $5bn.
Prior to the stage 3 lockdown of Melbourne we had been assuming that national GDP would rise 2.5% this quarter after something like a -7 to -8% hit in the June quarter. The rebound in indicators like retail sales following the reopening in May was directionally consistent with this.
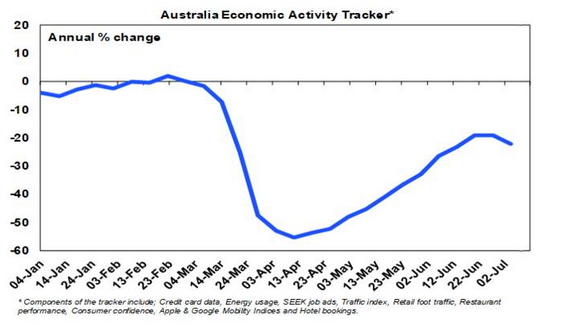
However, a $12bn hit from Victoria would take this back to around flat and negative impacts on confidence could see the economy even decline slightly again in the September quarter. This is consistent with our Australian Economic Activity Tracker of weekly economic indicators like credit card data and job ads flatlining since June after a decent pick up from mid-April.
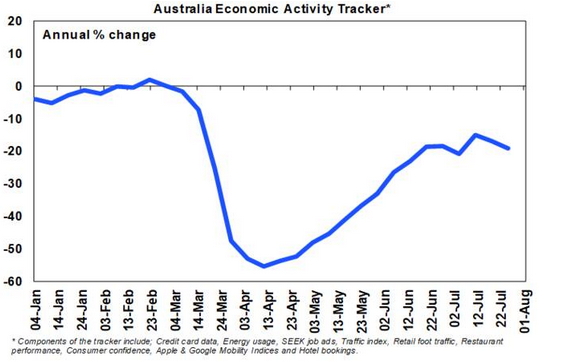
Source: AMP Capital
Note though, that this would all mask a large contraction in the Victorian economy (25% of national GDP) but growth in the rest of Australia, assuming of course that confidence impacts on the rest of Australia are kept to a minimum and that the virus is contained outside of Victoria.
The net result though could be a further delay in the start of Australia’s overall economic recovery as measured by GDP into the December quarter – assuming that coronavirus is brought under control in Victoria again and that it can safely reopen.
Pressure for more fiscal stimulus…
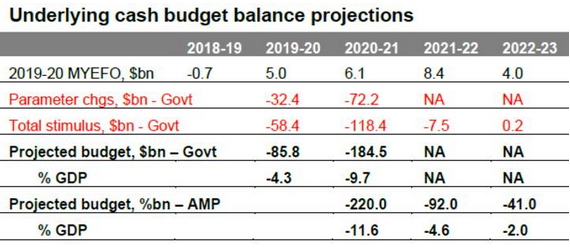
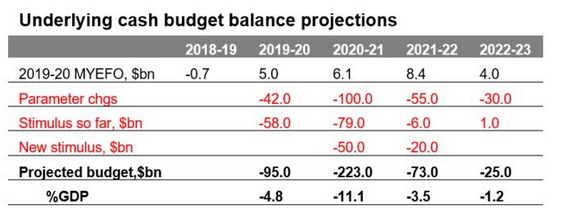
At time of the Federal Government’s Economic and Fiscal Update we felt that the deficit projection of $184.5bn for this financial year was too optimistic and saw it closer to $220bn reflecting softer revenue and more stimulus than the Government was allowing for. The tightening lockdown in Victoria has added to this and we now see the deficit this financial year as ultimately being closer to $235bn. Our revised budget projections are shown below. Of course, these should be treated with greater than normal caution given the uncertain economic outlook.
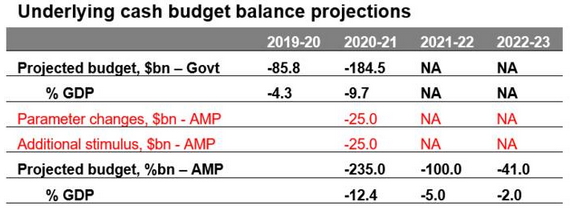
Source: Australian Treasury, AMP Capital
We are assuming that the slower economy depresses tax revenue by a further $25bn this financial year compared to the Government’s projections (see the line labelled parameter changes) and that an extra $25bn in stimulus occurs. The Federal Government has already announced paid pandemic leave of $1500 for two weeks for Victorians without sick leave but it’s likely that both JobKeeper and JobSeeker will now end up costing more than projected two weeks ago, as hundreds of thousands of Victorian jobs could be impacted by the stage 4 lockdown. Additional stimulus is also likely to come in more industry support packages, a bring forward of the 2022 tax cuts and investment incentives.
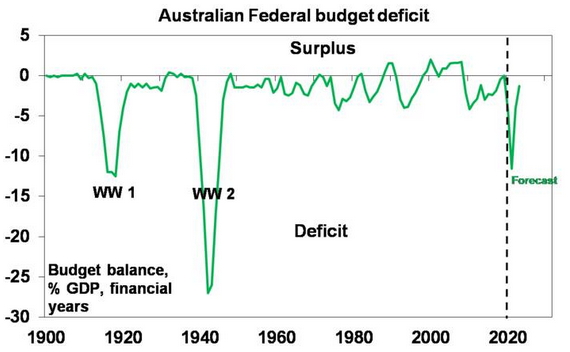
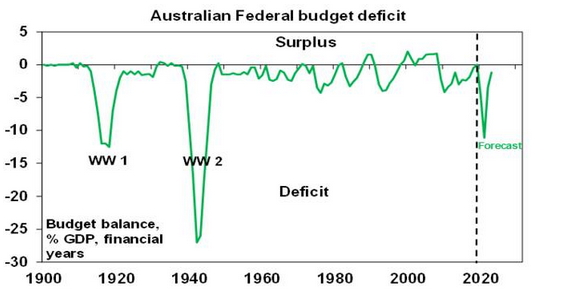
While the deficit and debt blowout to the highest levels since WW2 will alarm some, we remain of the view that without it the economic outlook will be much worse and that its made viable by ultra-low interest rates, Australia’s low starting point deficit and debt levels compared to other advanced countries and Australia’s lack of reliance on foreign capital.
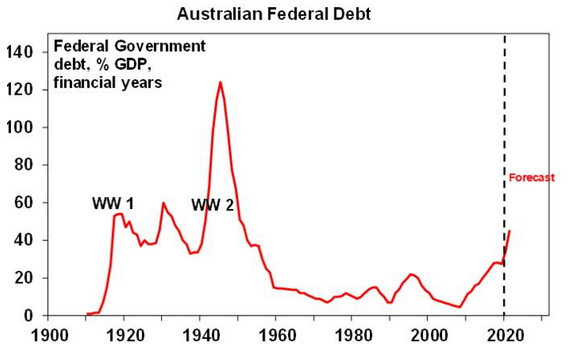
Source: RBA, Australian Treasury, AMP Capital
…and likely more monetary easing
However, while the bulk of the pressure for further economic support stimulus will fall on fiscal policy, the RBA is also likely to end up doing more too. In terms what the RBA might do if it does ease further in the months ahead – it has all but ruled out negative interest rates, foreign exchange intervention and the direct monetary financing of government spending. But it sees still lower but positive interest rates and the purchase of more government bonds beyond what’s necessary to achieve the 3- year bond yield target of 0.25% as possible options. A rate cut to 0.1% would hardly be worth the effort (but they may still do it) which leaves more quantitative easing as the main tool for further easing. The latter could take the form of bond purchases beyond 3-year bonds and a possible target for the value of bond purchases. Meanwhile, rate hikes are at least three years away.
Concluding comment
All of this begs the question: why are shares holding up so well? The answer is simple – while the second wave of coronavirus cases has increased the uncertainty around the economic outlook, its being offset by more positive signs of containment (fingers crossed) and hence recovery outside Victoria, ongoing positive signs regarding coronavirus treatments and an eventual vaccine globally, policy stimulus supporting the economy and ultra-easy monetary policy making shares look relatively cheap. So, we remain of the view that while shares are vulnerable to corrections, they are likely to rise on a 6 to 12-month horizon.
Source: AMP Capital 5 August 2020
Important notes: While every care has been taken in the preparation of this article, AMP Capital Investors Limited (ABN 59 001 777 591, AFSL 232497) and AMP Capital Funds Management Limited (ABN 15 159 557 721, AFSL 426455) (AMP Capital) makes no representations or warranties as to the accuracy or completeness of any statement in it including, without limitation, any forecasts. Past performance is not a reliable indicator of future performance. This article has been prepared for the purpose of providing general information, without taking account of any particular investor’s objectives, financial situation or needs. An investor should, before making any investment decisions, consider the appropriateness of the information in this article, and seek professional advice, having regard to the investor’s objectives, financial situation and needs. This article is solely for the use of the party to whom it is provided and must not be provided to any other person or entity without the express written consent of AMP Capital.
US dollar breaking down, gold and the $A breaking up – what does it mean for investors?
The price of gold has now broken out to a record high and the Australian dollar has risen 30% from its coronavirus panic low in March and broken above $US0.70. What’s driving this and what does it mean for investors? This note looks at the main issues.
The US dollar looks to have peakedThe recent surge in gold and the Australian
Read MoreThe price of gold has now broken out to a record high and the Australian dollar has risen 30% from its coronavirus panic low in March and broken above $US0.70. What’s driving this and what does it mean for investors? This note looks at the main issues.

The US dollar looks to have peaked
The recent surge in gold and the Australian dollar have one thing in common – namely an emerging breakdown in the US dollar. The $US surged during the early phase of the coronavirus panic in response to safe haven demand. The US economy has less exposure to cyclical sectors (like manufacturing, materials and financials) and a greater exposure to growth sectors like IT & health (that benefit from coronavirus) compared to the rest of the world. This means capital flows into the US when global growth slows and back out again when it picks up. Right now, the $US looks to be breaking down.
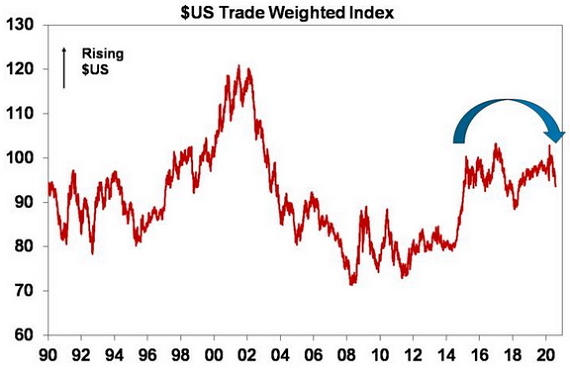
Source: Bloomberg, AMP Capital
From its March coronavirus panic high the US dollar index has fallen 9%. There are several reasons why the US dollar has likely peaked and will decline over the next six to 12 months.
-
First, the gap between US and global interest rates has now collapsed as the Fed has cut rates to zero making the US dollar less attractive to investors.
-
Second, the trade weighted US dollar has become expensive based on relative price levels (or what is often referred to as purchasing power parity).
-
Third, the Fed has been relatively more aggressive in its quantitative easing program than many other central banks which has increased the relative supply of US dollars.
-
Fourth, the Eurozone seems to be getting its act together relative to the US in terms of fiscal stimulus which makes the Euro (the main anti-dollar) relatively more attractive.
-
Fifth, a recovery in global growth (albeit a faltering one given the ongoing threat from coronavirus) is likely to hurt the US dollar reflecting the relatively lower cyclical exposure of the US. In other words, safe haven demand for the US dollar is likely to recede. This may be accentuated by the US’ relatively poor control of coronavirus.
-
Finally, for the technically minded, in early July the US dollar registered a so-called death cross with the 50-day moving average falling below the 200-day moving average. It’s also seen a double top with its late 2016 high
Historically, a falling US dollar is often seen as a sign that global reflation is working and that confidence may be gradually returning regarding the outlook for the global economy. If the $US has peaked then its good news for emerging countries (which often have US dollar debt) and positive for commodities including gold, and consistent with a rising trend for the Australian dollar – both of which we are now seeing. This partly reflects the reality that it’s all relative and so a falling US dollar naturally pushes up the price of gold and the $A as they are priced in US dollars. But there are other factors at play as well.
Gold taking out its 2011 record high
The next chart shows the price of gold since 1900 both in nominal and real terms. Until the early 1970s, the US dollar was fixed against gold. This was subject to periodic devaluations, such as in 1934. From the early 1970s to 1980 gold was in a secular upswing as investors turned to gold for protection against inflation. However, from 1980 to 1999 gold was in a secular downtrend as inflation was brought under control. The 2000’s saw gold enter another secular upswing in line with other commodities and despite a brief interruption at the time of the GFC, this got a further push along with the Eurozone debt crisis and more central bank monetary easing into 2011 which saw gold peak at $1921 in 2011. But this gave way as global growth improved with gold falling into 2015. However, since then, gold has surged again, and has now surpassed its 2011 high, albeit its yet to take out its 1980 price peak in real terms of $US819 in today’s prices (albeit it was just a one-week spike).
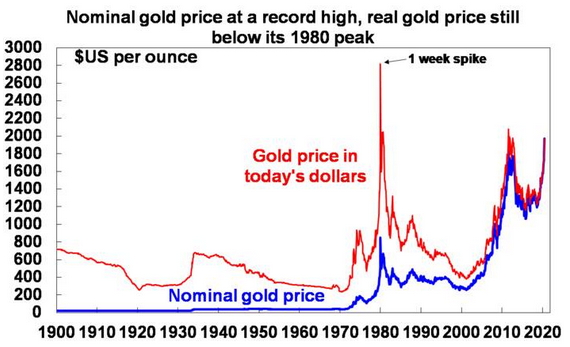
Source: Global Financial Data, AMP Capital Investors
Along with the fall in the US dollar several other factors have helped push the price of gold up:
-
First, some have been buying gold as a hedge against inflation on the basis that quantitative easing (which involves using printed money to buy financial assets) will generate higher consumer price inflation.
-
Second, gold is seen as a good alternative to major paper currencies which some see as being at risk thanks to renewed money printing and surging public debt levels. Notably on this front gold has risen against most currencies.
-
Third, and perhaps most importantly, the opportunity cost of holding gold versus cash or government bonds as an alternative store of value has collapsed again thanks to the renewed collapse in interest rates and bond yields.
Gold likely has more upside until central banks start to tighten and bond yields rise significantly, which looks to be a while off.
Some might see the surge in the gold price as a bad sign, but given the mixed factors driving it higher its ambiguous as to whether its good or bad. But the fall in the $US is more clearly a positive than a negative in terms of what it signals about the global economy and falling safe haven demand from investors.
Should investors consider gold?
There are numerous ways to get exposure to gold, all with their pros and cons:
-
Physical gold – gives pure exposure but its costly to store.
-
Gold futures – no storage problem here & easy to leverage up but need to roll futures contracts over as they expire.
-
Gold exchange traded funds – these are highly liquid but do involve counterparty risk.
-
Gold shares – these reflect gold prices but are also affected by the performance of the individual companies.
-
Gold funds provide an exposure to gold – these may reflect a combination of the above.
But its worth stressing that gold is highly speculative. It’s not grounded by an income stream like most shares, property, bonds and cash. Virtually all the gold ever produced still exists and can potentially come back on to the market. At the same time, actual production and demand for jewellery and industrial use is trivial relative to the huge gold stock. As a result, ‘animal spirits’ can play a huge role in the determination of the gold price. This can make for a volatile ride and history has shown that the gold price goes through long term upswings and downswings. Sooverall, we think there may be a role for gold in investors’ portfolios as a hedge against major paper currency weakness/inflation, but it should be limited to maybe no more than 5% (depending on an investors’ circumstances).
Five reasons why the $A is likely to head higher too
The $A has broken above $US0.70 having bottomed out at the height of the coronavirus panic in March at around $US0.55. Just like gold it’s being driven higher by a combination of:
-
First, a falling US dollar for the reasons noted earlier.
-
Second, the Fed printing more US dollars than the RBA is printing Australian dollars.
-
Third, the interest rate different between Australia and the US looks to have bottomed with the Fed cutting to near zero. As can be seen in the next chart, periods of a low and falling interest rate differential between Australia and the US usually see a low and falling $A and vice versa.
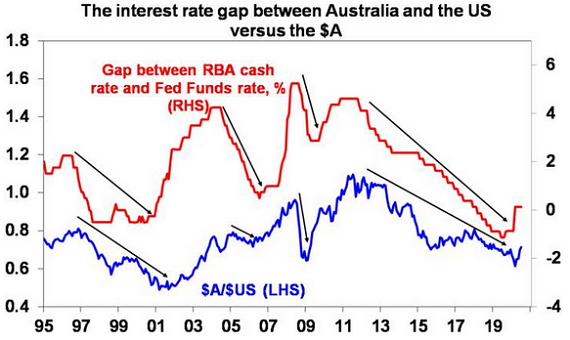
Source: Bloomberg, AMP Capital
-
Fourth, rising commodity prices with iron ore above $US100/tonne, metal prices up nearly 30% from March lows to be around pre coronavirus levels and oil prices having more than doubled since April.
-
Fifth, high commodity prices along with strong export volumes to China and a rising net equity position in Australia’s favour is helping to maintain Australia’s current account surplus. This in turn means that Australia is not dependent on foreign capital.
-
Finally, there is reason for optimism that Australia will recover faster than the badly coronavirus hit US.
For all these reasons I expect the Australian dollar will continue to rise and is likely to be above $US0.75 by year end.
At this point, the Australian dollar is still around fair value (which is around $US0.73 based on purchasing power parity) and the rebound is consistent with underlying fundamentals such as commodity prices. But if it rises rapidly above fair value in the absence of fundamental support such that the RBA starts to see it as a threat to the recovery, expect it to respond with more quantitative easing, not negative rates and foreign exchange intervention as the RBA is not keen on either of these.

Source: RBA, ABS, AMP Capital
What does a rising $A mean for Australian investors?
Basically, it means that the case to maintain a large exposure to offshore assets that are not hedged back to Australian dollars has weakened. Of course, maintaining a position in foreign exchange for Australian-based investors against the $A provides some protection should things on the coronavirus front deteriorate badly here in Australia or globally.
Source: AMP Capital 28 July 2020
Important notes: While every care has been taken in the preparation of this article, AMP Capital Investors Limited (ABN 59 001 777 591, AFSL 232497) and AMP Capital Funds Management Limited (ABN 15 159 557 721, AFSL 426455) (AMP Capital) makes no representations or warranties as to the accuracy or completeness of any statement in it including, without limitation, any forecasts. Past performance is not a reliable indicator of future performance. This article has been prepared for the purpose of providing general information, without taking account of any particular investor’s objectives, financial situation or needs. An investor should, before making any investment decisions, consider the appropriateness of the information in this article, and seek professional advice, having regard to the investor’s objectives, financial situation and needs. This article is solely for the use of the party to whom it is provided and must not be provided to any other person or entity without the express written consent of AMP Capital.
Australian economic and fiscal update – record budget deficits, but more to come
This economic and fiscal update is the first since December’s Mid-Year Economic and Fiscal Outlook when budget surpluses looked just around the corner. Since then things have changed dramatically due to the hit from coronavirus and necessary support measures from the Government.
Policy stimulusThe statement provided no new policy stimulus measures beyond those that have been announced in the last two
Read MoreThis economic and fiscal update is the first since December’s Mid-Year Economic and Fiscal Outlook when budget surpluses looked just around the corner. Since then things have changed dramatically due to the hit from coronavirus and necessary support measures from the Government.

Policy stimulus
The statement provided no new policy stimulus measures beyond those that have been announced in the last two weeks:
-
$2bn in spending on subsidies for apprentices & JobTrainer;
-
An estimated $16bn to extend JobKeeper to March next year but with payments stepping down to $1200 and then $1000 a fortnight for those who worked 20 hours or more per week in February and to $750 and then $650 for others and businesses having to meet the turnover reduction test at the end of the September and December quarters to keep receiving it; and
-
An estimated $3.8bn to extend the JobSeeker Supplement to December at the pared back rate of $250 a fortnight.
This additional $22bn in spending along with prior coronavirus-related economic support (in the form of actual spending, tax breaks and health measures) takes the COVID-19 response package to nearly $174bn. JobKeeper is the main element in this, but it also includes the JobSeeker supplement, payments to businesses and payments to eligible households. There is also loans & guarantee support (from the government and RBA) worth $125bn or just over 6% of GDP.
Proposals to bring forward the tax cuts and provide additional investment incentives look to have been pushed out to the October budget and additional industry support packages are also likely. The Government may have delayed this extra stimulus to gauge how much additional help will be required with a lot riding on how quickly the latest outbreak of coronavirus is brought back under control. Spreading out the announcement of new stimulus measures may also get more bang for the buck in terms of the boost to confidence.
Economic assumptions
The Government is forecasting the economy to contract this financial year by -2.5%, its biggest financial year contraction since 1946-47. But this masks a “record” -7% contraction in June quarter GDP and a gradual recovery from the second half of this year. The Government is a bit more optimistic than we are in terms of economic growth and unemployment.
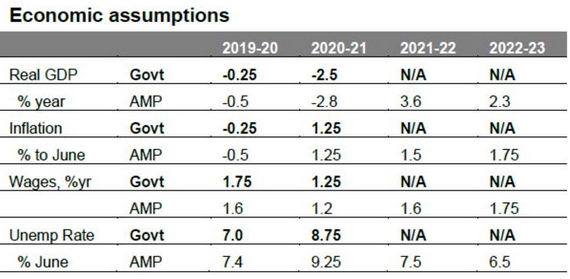
Source: Australian Treasury, AMP Capital
Budget deficit projections
The Government’s revised budget projections and our own are shown below. These should be treated with greater than normal caution given the uncertain economic outlook.
Source: Australian Treasury, AMP Capital
The hit to the economy and hence revenue and expenditure since the Mid-Year Economic and Fiscal Outlook last December is huge at $72bn for this financial year and is shown in the line called “parameter changes”. It should gradually start to diminish as the economy recovers. Policy stimulus (mainly due to the coronavirus response but also other things) since last December is shown in the line labelled “Total stimulus”.
As a result of the Government’s fiscal response and the hit to revenue from the economic downturn, the Government projects the budget deficit to further blow out from around $86bn for the past financial year to a record $184.5bn this financial year.
While it does not provide projections beyond this financial year the implication is that the deficit will decline in future years as support programs phase down and the economy recovers. On the Government’s projections this would see the budget deficit as a share of GDP peak at around 9.7% of GDP in 2020-21, which would be its highest since World War 2. We continue to see a bigger deficit for this financial year of around $220bn reflecting both a bigger hit to revenue and additional stimulus of around $17bn to be announced in the months ahead, including in the October budget. This is likely to include the bring forward of the 2022 tax cuts, more investment incentives and more industry support programs. The budget deficit blow-out will add about 20% of GDP to public debt out to 2022.
Source: RBA, Australian Treasury, AMP Capital
Assessment
The additional $22bn in stimulus announced over the last two weeks is welcome and will help turn the fiscal cliff in October into a fiscal slope. The boost to stimulus announced in the last two weeks takes Australia’s total level of coronavirus related fiscal stimulus (excluding loans and guarantees) this year up to 8.7% of GDP, which is well and truly at the high end of comparable countries. This should aid the economic recovery.
Source: IMF, AMP Capital
However, it’s doubtful that this will be enough given the long tail of unemployment flowing from the coronavirus shock. We estimate that were it not for JobKeeper and people leaving the workforce the effective unemployment rate would currently be 11.3%, which is well above the official measured rate of 7.4%. This has fallen from 14.8% in April thanks to the reopening of the economy, but with the threat to the recovery posed by the second wave of cases in Victoria and the lockdown in Melbourne and the risk of a flow on to NSW, effective unemployment may only fall to around 10% or so by September and maybe 9% or more going into next year, so continued income support is essential. The Government’s focus now shifts to economic reforms in the October budget and this is likely to include even more fiscal support, as noted earlier.

Source: IMF, AMP Capital
Our assessment remains that the blow out in the budget deficit is affordable. First, it’s absolutely necessary as were it not for the support measures the economic hit would be far greater.
Second, it makes sense for the public sector to borrow from households and businesses at a time when they have cut their spending, and to give the borrowed funds to help those businesses and individuals that need help.
Third, the support programs are targeted at current needs so shouldn’t lead to permanently higher government spending.
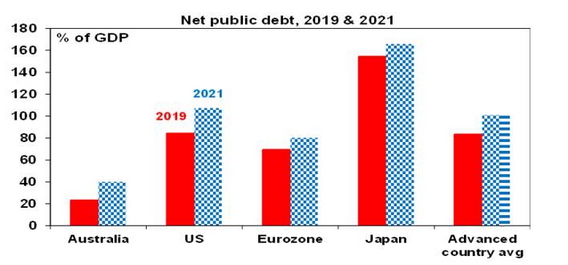
Fourth, Australia’s starting point for net public debt last year was low at 23% of GDP compared with other advanced countries averaging 83%. See the next chart. And even with projected budget deficits it will remain relatively small.
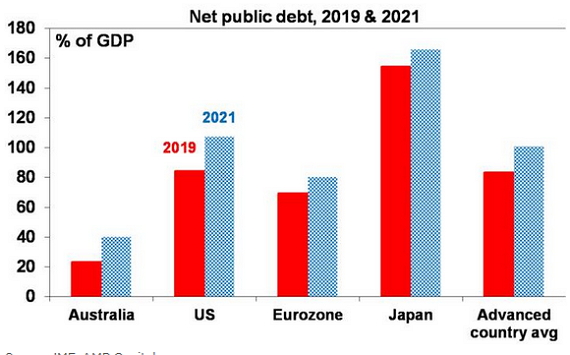
Source: IMF, AMP Capital
Fifth, borrowing to finance the budget deficit is in Australian dollars and we are not dependent on foreign creditors, so we are not vulnerable to a “foreign currency crisis.”
Finally, the cost of Government borrowing is very low at around 0.85% for ten years and 0.25% for three years.
Implications for the RBA
Ongoing Government support for households and businesses is not enough to change our assessment that the RBA will need to keep cash rate near zero for years ahead and possibly need to undertake more quantitative easing in the face of ongoing spare capacity in the economy and below target inflation.
Implications for Australian assets
Cash and term deposits – with the cash rate unlikely to rise from 0.25% for years, returns from cash and bank term deposits will remain low for a long time to come. That said the budget stimulus and increase in money supply holds out at the prospect that at some point inflation and interest rates will rise. But it’s probably at least three years away.
Bonds – the surge in public debt and bond supply would all other things being equal, point to higher bond yields, but this is offset by massive spare capacity, low private sector borrowing, very low inflation and the cash rate capped at 0.25% for years it’s hard to see a lot of upside in bonds yields. That said, if coronavirus comes under control it’s hard to see a lot of downside either so medium-term bond returns are likely to be low.
Shares – the addition of extra policy stimulus further helps to offset the hit from coronavirus and adds to confidence that growth will recover which is supportive of shares.
Property – ongoing income support is continuing to help the property market avoid a sharp fall in home prices but the negatives around high effective unemployment, the weak rental market and the collapse in immigration point to ongoing falls in prices into next year, particularly in Sydney and Melbourne.
The $A – ongoing fiscal stimulus at the high end of comparable countries coming at a time of rising commodity prices and a declining US dollar point to more upside for the $A.
Concluding comment
With private sector spending hit by coronavirus it makes sense for the Government to continue to help fill the breach and support the economy. The best approach to getting debt back down is to grow the economy aided by a reinvigorated economic reform agenda, but for a while yet government fiscal support will continue to be needed.
Source: AMP Capital 23 July 2020
Important notes: While every care has been taken in the preparation of this article, AMP Capital Investors Limited (ABN 59 001 777 591, AFSL 232497) and AMP Capital Funds Management Limited (ABN 15 159 557 721, AFSL 426455) (AMP Capital) makes no representations or warranties as to the accuracy or completeness of any statement in it including, without limitation, any forecasts. Past performance is not a reliable indicator of future performance. This article has been prepared for the purpose of providing general information, without taking account of any particular investor’s objectives, financial situation or needs. An investor should, before making any investment decisions, consider the appropriateness of the information in this article, and seek professional advice, having regard to the investor’s objectives, financial situation and needs. This article is solely for the use of the party to whom it is provided and must not be provided to any other person or entity without the express written consent of AMP Capital.
The fiscal cliff is more likely to be a fiscal slope – and why concerns about Australia’s budget deficit are overblown
The thought of various government support measures expiring in the months ahead, causing some sort of fiscal cliff over which economies and share markets will plunge, has caused much consternation. But as with the original fiscal cliff of December 31, 2012 in the US, it’s likely to be tapered into a fiscal slope. Particularly with so called “second waves” of
Read MoreThe thought of various government support measures expiring in the months ahead, causing some sort of fiscal cliff over which economies and share markets will plunge, has caused much consternation. But as with the original fiscal cliff of December 31, 2012 in the US, it’s likely to be tapered into a fiscal slope. Particularly with so called “second waves” of coronavirus reaping havoc with the economic outlook. Of course, this will add to the public sector’s debt burden associated with the coronavirus shock, in turn adding to concern about some sort of fiscal day of reckoning down the track.
This note looks at the key issues around fiscal support and the budget in Australia ahead of the Treasurer’s Economic Statement (due 23rd July) which is expected to provide new economic forecasts, an estimate of the budget cost of support measures so far and outline plans for future support measures.

Fiscal stimulus to be extended
It made sense for many of the coronavirus government support measures to expire at the end of September as it avoided a permanent/hard to reverse lift in public spending, and to borrow from the analogy likening the support measures to a bridge across a chasm, once the coronavirus chasm has been crossed there is no longer the need for the bridge. However, its increasingly clear that support will be needed for longer:
-
First, the second wave of coronavirus cases in Australia has seen the Victorian Government return Melbourne to a “stay at home” six-week lockdown which will slow the recovery. While we estimate the direct impact on the Australian economy to be around $5bn which will knock around 1% off GDP this quarter, there is a high risk that it impacts confidence in other states (as people “self-isolate”) and that other states may also return to a lockdown if cases spread, with NSW most at risk. This already appears to be impacting economic activity, with our Australian Economic Activity Tracker which combines timely weekly data faltering over the last two weeks, after ten consecutive weeks of recovery.
Source: AMP Capital
-
Second, the easy gains from the initial reopening including the unleashing of pent up demand may have mostly been seen but distancing requirements and travel restrictions mean that it will take much longer for some industries – travel, events, culture, accommodation, restaurants and housing construction – to get back to normal.
-
Third, the coronavirus shock has accelerated the shift to a digital world, such that job losses associated with automation are now likely occurring faster than new jobs are being created. Three examples of this are a faster take up of online retailing meaning less jobs in retailing, more working from home meaning less office demand and less jobs in public transport and less business travel in favour of virtual meetings meaning less use of airlines and hotels.
The last two mean that “spare capacity” will linger well into the future and this is likely to show up in a long tail of high unemployment. Without the JobKeeper wage subsidy and changes to JobSeeker, “effective unemployment” would have risen to 14.8% in April and would still be around 13.6% now.
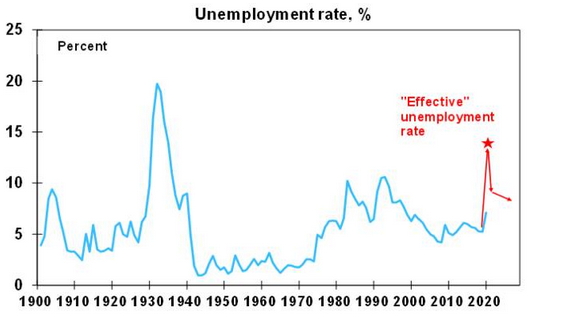
Source: RBA, ABS, AMP Capital
The initial spike in “effective unemployment” may be reversed quickly taking it down to say 9% by year end, but getting it back to 5% as seen early this year could take years as some sectors take a long time to recover and accelerated structural change impacts. This suggests both a short-term and a long-term challenge for government which will likely be met at least in the short term by more fiscal stimulus.
Revised budget deficit projections
Our revised deficit projections are shown below and take the December 2019 Mid-Year Fiscal Outlook as the starting point.
Source: Australian Treasury, AMP Capital
The hit to the economy will mean a hit to government revenue and this is shown in the line called “parameter changes”. Budget data released for the period to May suggests that this has been running at just over $10bn a month since March.
The Government has already announced significant policy support and this is shown in the line “stimulus so far”. We have allowed for the three policy support packages in March, the health package and industry support packages. These are dominated by JobKeeper now estimated to cost $70bn.
However, the need for additional support for the economy has also been recognised by the
Government. As a result, in its 23 July economic statement we are likely to see:
-
An extension of JobKeeper – although it’s likely to be revamped with a monthly eligibility test and different pay rates and companies are likely to be discouraged from accessing it for jobs that won’t be revived;
-
The doubled JobSeeker payment is likely to be pared back;
-
Income tax cuts due from 2022 may be brought forward;
-
Additional investment incentives; and
-
More industry support packages.
The Government will partly fund extra support by taking JobKeeper from those who no longer need it, but the bulk will likely come from the $60bn saving already seen on JobKeeper, which we expect to be fully spent and then some (see “new stimulus”) although it may not all be announce next week.
As a result of the Government’s fiscal response and the hit to public revenue from the economic downturn, the budget deficit is expected to blow out from around $95bn for the past financial year to around $223bn this financial year before improving from 2021-22, as support programs phase down and the economy recovers. This would see the budget deficit as a share of GDP peak at around 11% of GDP in 2020-21, which would be its highest since World War 2. Spread over several years, this will add nearly 20% of GDP to Australia’s public debt. This raises two questions though: will it be enough? And can we afford it?
Source: RBA, Australian Treasury, AMP Capital
Will it be enough?
By extending programs like JobKeeper beyond September and announcing additional stimulus including the likely bring forward of tax cuts, the Government will effectively taper the fiscal cliff and turn it into more of a slope. This helps solve the short-term reality that a lot of jobs won’t have come back by October. However, it remains to be seen whether this will be enough given the long tail of unemployment flowing from the coronavirus shock discussed earlier. The Government’s focus looks likely to shift to economic reforms in the October budget and this makes sense, but more fiscal support may ultimately be needed to soak up the likely long tail of unemployment.
Can we afford the surge in the deficit and debt?
Our assessment remains that it is affordable. First, were it not for the support measures the economic hit would be far greater, ultimately resulting in an even bigger public debt blowout.
Second, as Keynes showed, it makes sense for the public sector to borrow from households and businesses at a time when they have cut their spending, and to give the borrowed funds to help those businesses and individuals that need help.
Third, the support programs won’t cause a permanent step jump higher in public spending.
Fourth, Australia’s starting point for net public debt was low at 23% of GDP compared with other advanced countries averaging 83%. See the next chart. And even with projected budget deficits it will remain relatively small.
Source: IMF, AMP Capital
Fifth, borrowing to finance the budget deficit is in Australian dollars and, with a current account balance, we are not dependent on foreign creditors risking a foreign currency crisis.
Sixth, the cost of Government borrowing is very low at less than 1% for ten years. This is partly being facilitated by the RBA buying bonds, but bond rates would be low anyway.
Finally, consider what would happen if “shock horror” the Government and the RBA agreed to cancel the bonds that the RBA owns? Apart from a lot of grinding teeth from some commentators the answer would be very little – the Government’s loss on its “investment” in the RBA would be offset by a reduction in liabilities. In other words, it’s not necessarily the case that all public debt has to be paid back if it’s owned by the central bank. For the technically minded, the limit to this would be if all the extra money that the central bank printed to buy the bonds causes inflation – but as Japan has seen, if there is lots of spare capacity, inflation is not an issue.
Concluding comment
With the private sector spending hit by coronavirus it makes sense for the Government to continue to help fill the breach and support the economy. The best approach to getting debt back down is to grow the economy aided by a reinvigorated economic reform agenda, but for a while government fiscal support will continue to be needed.
Source: AMP Capital 15 July 2020
Important notes: While every care has been taken in the preparation of this article, AMP Capital Investors Limited (ABN 59 001 777 591, AFSL 232497) and AMP Capital Funds Management Limited (ABN 15 159 557 721, AFSL 426455) (AMP Capital) makes no representations or warranties as to the accuracy or completeness of any statement in it including, without limitation, any forecasts. Past performance is not a reliable indicator of future performance. This article has been prepared for the purpose of providing general information, without taking account of any particular investor’s objectives, financial situation or needs. An investor should, before making any investment decisions, consider the appropriateness of the information in this article, and seek professional advice, having regard to the investor’s objectives, financial situation and needs. This article is solely for the use of the party to whom it is provided and must not be provided to any other person or entity without the express written consent of AMP Capital.
2019-20 saw poor returns – but it could have been much worse
The past financial year was poor for investors as coronavirus knocked economies into what is likely to be their biggest hit since the 1930s. Shares were hit hard, but the blow was softened by a strong rebound in the June quarter. This note reviews the last financial year and takes a look at the outlook.
Pre and post covidThe past financial
Read MoreIntroduction
The past financial year was poor for investors as coronavirus knocked economies into what is likely to be their biggest hit since the 1930s. Shares were hit hard, but the blow was softened by a strong rebound in the June quarter. This note reviews the last financial year and takes a look at the outlook.

Pre and post covid
The past financial year can effectively be divided into two halves. The period from July last year into early this year saw generally strong returns from shares and growth assets, as fear of recession faded helped by central bank easing and a truce in the US/China trade war and gave way to expectations of some improvement in global economic growth. Despite devastating bushfires and a subdued growth outlook even the Australian share market made it to a record high in February. Against this backdrop, returns from government bonds were subdued.
This now seems like it was a different world as it all started to fade and ultimately reverse as the coronavirus epidemic started to become a problem in China in January. Initially it was hoped it would be contained to China (which successfully controlled it allowing a reopening of its economy from March) but from late February the number of cases escalated in Europe then the US, Australia and ultimately emerging countries, resulting in severe lockdowns driving sharp economic contractions in economic activity. So, between 20th February and 23rd March share markets collapsed by around 35% dragging down commodity prices. This also saw the $US surge and the Australian dollar plunge to around $US0.55.
However, from late March shares staged a rebound driven by policy stimulus, a decline in new covid cases, economic reopening and a rebound in economic data. From their March lows to June highs global shares rose 40% & Australian shares rose 35% and commodity prices and the $A also rebounded.
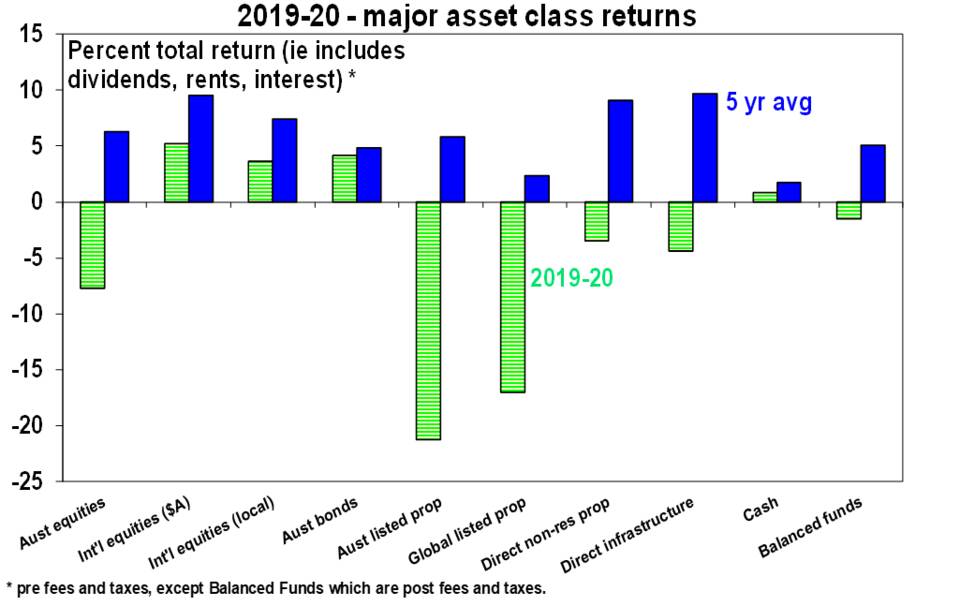
So, despite this wild ride, for the financial year as a whole global shares returned 5.2% in Australian dollar terms. This was led by the US share market which outperformed due to a heavy tech and health care exposure, a relatively low exposure to cyclical shares and massive Fed quantitative easing. Australian shares didn’t fare so well & still lost 7.7% for the financial year.
Cash and bank deposits had very low returns as the RBA cut the cash rate to 0.25% in March. But bonds had reasonable returns as plunging yields provided capital growth for investors. Despite the plunge in interest rates and bond yields, listed property saw double digit losses as the coronavirus driven slump in economic activity pushed up vacancies and depressed rents in retail and office properties. Returns on airports were similarly depressed weighing on direct infrastructure returns.
This all saw small negative returns for balanced growth superannuation funds of around -1.5% after fees and taxes. Of course, it would have been much worse were it not for the June quarter rebound in shares. The hit to super returns also followed several years of strong returns and the five-year average is just over 5% which is not so bad given (pre tax) bank deposit rates averaged around 2% and inflation averaged 1.5%.
Source: Thomson Reuters, AMP Capital
Like shares, Australian residential property had a roller coaster ride – first rising 10% on rate cuts and the Federal election before starting to slow as coronavirus hit.
Key lessons for investors from the last financial year
These include:
-
Maintain a well-diversified portfolio – while shares and listed property had a rough ride, bonds and exposure to global shares and foreign currency provided some stability.
-
Timing markets is hard – while it always looks easy in hindsight, getting out in February at the top and then getting back in March at the low would have been very hard to time.
-
Beware the crowd at extremes – as is often the case shares hit bottom in March at a time of extreme investor pessimism.
-
Turn down the noise – the noise around coronavirus is at fever pitch making it very hard to maintain focus on long term investing, so the best thing is to turn it down a notch.
-
Don’t fight the Fed – despite near zero interest rates and high public debt levels, policy stimulus can still be applied on a massive scale and still impacts investment markets.
The negatives
There are a bunch of threats which are likely to lead to a further correction in shares in the short term, ongoing bouts of volatility and constrained returns. Here are the big ones.
-
First, while some countries have got new coronavirus cases well down, it’s still on the rise globally particularly in emerging countries and the US and Victoria have seen a resurgence in cases. This is threatening a return to economically debilitating country wide lockdowns (as opposed to targeted measures). Even partial lockdowns will slow the recovery – eg, our rough estimate is that the new six-week lockdown of Melbourne, which accounts for about 20% of Australian GDP will knock nearly 1% off Australian GDP this quarter, which will slow the recovery (but not derail it as it should be offset by growth in other states).
-
Second, the shutdowns will leave lasting collateral damage in terms of bankruptcies and higher unemployment as the embrace of technology has been sped up, companies cut costs and skills atrophy, all of which will weigh on growth.
-
Third, in Australia the main collateral risk is that the combination of high unemployment, a collapse in underlying housing demand on the back of a plunge in immigration and a depressed rental market drive a sharp collapse in home prices triggering negative wealth effects.
-
Fourth, the run up to the US election has the potential to drive increased share market volatility if it looks increasingly likely that Biden will win and raise taxes, and the risk is probably greater if President Trump decides he has nothing to lose and ramps up tensions with China and maybe Europe. With betting markets favouring a clean sweep by the Democrats some of the former is probably already priced, but an intensification of trade wars is probably not.
-
Finally, shares are expensive on traditional metrics like PEs.
The positives
However, there are a bunch of positives providing an offset.
-
First, several Asian countries have shown its possible to control the virus – notably China, South Korea, Taiwan and Japan. Maybe the SARS experience helps along with the culture of wearing masks. Surely, we can learn from them.
-
Second, progress is continuing to be made in terms of vaccines and treatments for coronavirus. I am a bit sceptical about a vaccine, but the latter may be contributing to lower death rates. If deaths remain low compared to the first wave there is less risk of a return to hard lockdowns (Victoria excepted!) and less self-isolation.
-
Third, policy makers remain committed to do whatever they can to support businesses, incomes and jobs with record levels of fiscal stimulus relative to GDP and massive monetary stimulus. This is different to normal recessions where it takes longer for policy makers to swing into action. To this end policy stimulus will be extended in the US and in Australia (with the Treasurer talking about another phase of income support and possibly bringing forward tax cuts).
-
Fourth, a range of economic indicators have seen a Deep V rebound from shutdown lows starting in China and then in developed countries, suggesting significant pent up demand. This is most evident in business conditions PMIs but also in retail sales. On balance we see a gradual bumpy economic recovery from here. Australian GDP is expected to contract -4.5% this year and grow 4% next year.
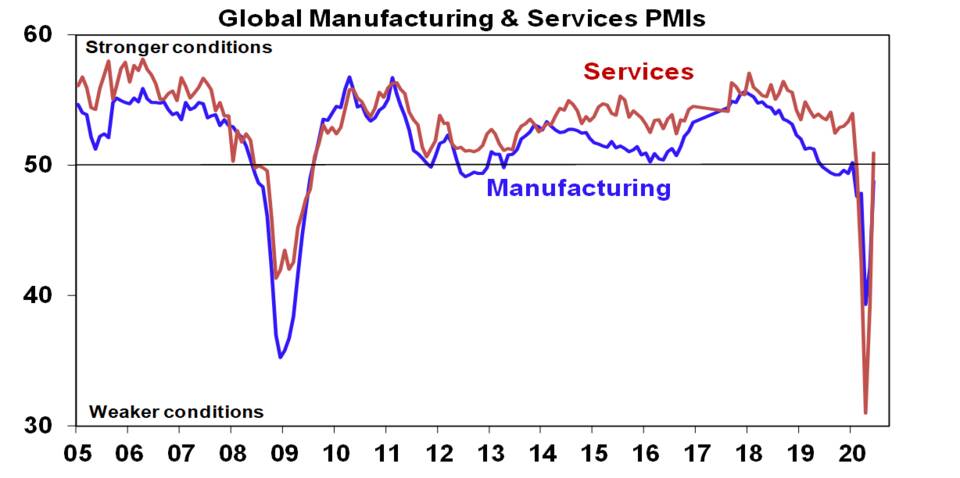
Source: Bloomberg, AMP Capital
-
Finally, the plunge in interest rates and bond yields have increased the present value of shares and other growth assets, which explains why price to earnings multiples are so high. Or looked at another way, shares remain attractive despite lower earnings and dividends because the alternatives like bank deposit rates are even less attractive.
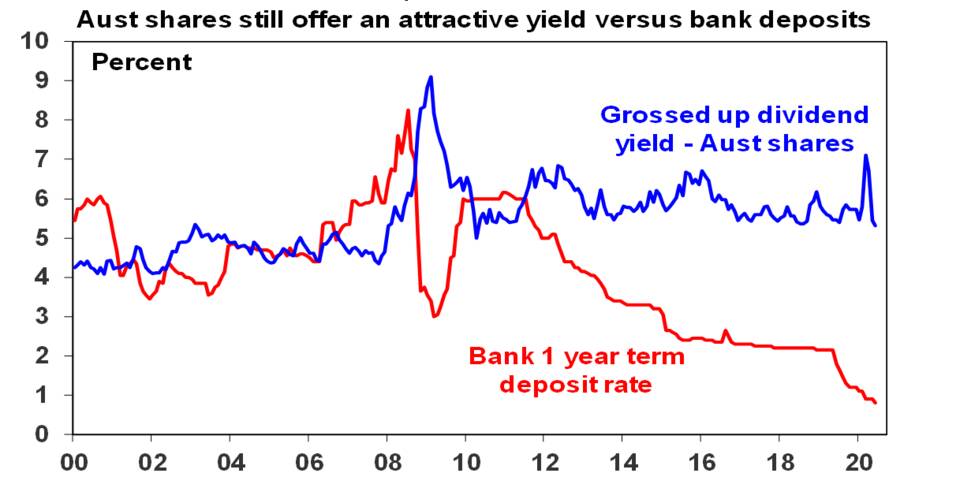
Source: RBA; AMP Capital
What about the return outlook?
With coronavirus risks still high, investment markets may see more volatility. But over the next 12 months returns from a well-diversified portfolio are likely to be constrained but okay.
-
After a strong rally from March lows shares remain vulnerable to short term setbacks given uncertainties around coronavirus and US/China tensions. But on a 6 to 12-month view shares are expected to see reasonable returns helped by a pick-up in economic activity & massive policy stimulus.
-
Cash and bank deposit returns are likely to be poor at less than 1% as the RBA is expected to keep the cash rate at 0.25%. Investors still need to think about what they really want: if it’s capital stability then stick with cash, but if it’s a decent income flow then consider the alternatives.
-
Low starting point yields are likely to result in low returns from bonds once the dust settles from coronavirus.
-
Unlisted commercial property and infrastructure are ultimately likely to benefit from a resumption of the search for yield, but the hit to economic activity and hence rents from the virus will weigh heavily on near term returns.
-
Home prices are expected to fall by around 5 to 10% into next year as higher unemployment, a stop to immigration and the weak rental market impact.
-
Although the $A is vulnerable to bouts of uncertainty about the global recovery and US/China tensions, a continuing rising trend is likely if the threat from coronavirus recedes.
Things to keep an eye on
The key things to keep an eye on are: coronavirus hospitalisations and deaths, as a guide to the degree of isolation; global business conditions PMIs and unemployment; US election prospects; and Australian house prices.
Source: AMP Capital July 8th 2020
Important notes: While every care has been taken in the preparation of this article, AMP Capital Investors Limited (ABN 59 001 777 591, AFSL 232497) and AMP Capital Funds Management Limited (ABN 15 159 557 721, AFSL 426455) (AMP Capital) makes no representations or warranties as to the accuracy or completeness of any statement in it including, without limitation, any forecasts. Past performance is not a reliable indicator of future performance. This article has been prepared for the purpose of providing general information, without taking account of any particular investor’s objectives, financial situation or needs. An investor should, before making any investment decisions, consider the appropriateness of the information in this article, and seek professional advice, having regard to the investor’s objectives, financial situation and needs. This article is solely for the use of the party to whom it is provided and must not be provided to any other person or entity without the express written consent of AMP Capital.
The US presidential election – implications for investors
Investor focus on the US election waned earlier this year after socialist Bernie Sanders dropped out of the Democratic primary race in favour of moderate Joe Biden. At the same time coronavirus became the main focus for markets. However, markets may soon start to pay more attention as the election is rapidly approaching, while Joe Biden is a moderate, he
Read More
Investor focus on the US election waned earlier this year after socialist Bernie Sanders dropped out of the Democratic primary race in favour of moderate Joe Biden. At the same time coronavirus became the main focus for markets. However, markets may soon start to pay more attention as the election is rapidly approaching, while Joe Biden is a moderate, he is proposing higher taxes and more regulation and President Trump is not having a good run. Trump’s re-election chances have fallen with a majority of surveyed Americans disapproving of his handling of the pandemic and recent civil unrest at a time when the US has plunged into its deepest recession since the 1930s. The historical record indicates incumbent presidents tend to lose when there is a recession in the two years before the election and unemployment has gone up.
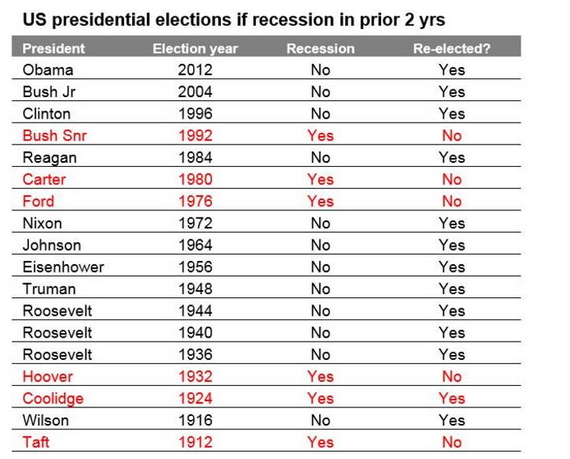
Source: Strategas
Normally at this point past presidents seeking re-election have started to see an upswing in approval, but this is not evident yet for Trump. Rather, consistent with the above, according to Real Clear Politics’ average of polls Trump’s approval rating has fallen to 41.2% over the last two months, his disapproval rating is edging above its 2019 high, opinion polls have Biden leading Trump by around 9 points and Biden is ahead in all 6 “battleground states”, the ‘Predict It’ betting market, which had Trump ahead of Biden up until late May, now has Biden with a 23 point lead and also now has Democrats winning the presidency, the House and the Senate. The Democrats already have control of the House and are likely to retain that, but they need three seats to then along with the Vice President, gain a majority of the Senate. A clean sweep for the Democrats would remove the Senate as a blockage to higher taxes.
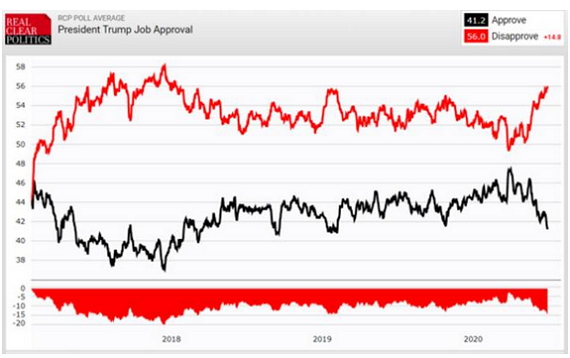
Source: Real Clear Politics
However, it would be wrong to write Trump off. Polls and betting markets were not so reliable in the 2016 election, there are still four months to go to the election & ongoing civil unrest could see him garner support as a “law and order president” as Nixon did in 1968. And Trump rates more highly on the economy than Biden and this may get a boost if the economy continues to reopen and recover. A rebound in the economy is Trump’s best hope which partly explains why he cheered on reopening from the end of April. However, the rebound in US coronavirus cases in many states in the last few weeks puts all this at risk.
Key Biden policy directions versus Trump
Taxation: Biden plans to raise the corporate tax rate to 28% (reversing half of Trump’s cut to 21%), return the top marginal tax rate to 39.6% (from 37%) and tax capital gains and dividends as ordinary income.
Infrastructure: Biden plans to spend $1.3trn over 10 years.
Climate policy: Biden aims for the US to reach net zero emissions by 2050 by raising the cost of fossil fuels & boosting the development of alternatives (possibly with a carbon tax).
Regulation: Biden is likely to end the era of deregulation.
Healthcare: Biden wants to strengthen Obamacare and limit drug prices.
Trade and foreign policy: Biden would likely de-escalate tensions with Europe and strengthen the alliance, work with international organisations like the World Trade Organisation, work to re-establish the nuclear deal with Iran and adopt a more diplomatic approach to dealing with trade & other issues with China (working with Europe and Asian allies in the process). By contrast a re-elected Trump is likely to double down on his trade war with China and possibly elsewhere including Europe.
Budget deficit: For the near term, the budget deficit is likely to remain high whoever wins, but historically they have fallen under Democrats after rising under Republicans. That said, if the economy proves slow to recover Joe Biden may be more likely to respond with large public sector spending programs aided by ongoing Fed quantitative easing in order to deal with ongoing high levels of spare capacity and unemployment.
Economic impact
On their own higher corporate and top marginal tax rates, increased regulation and an increased cost of carbon which will weigh on energy companies when they are already struggling are negative for the growth outlook. For example, the rise in the corporate tax rate would knock around 6% off earnings per share for S&P 500 companies. In particular, they may reverse some of the supply side boost provided by Trump. However, as with all things economic its never as simple as that.
-
First, the negative impact of tax hikes and increased regulation in the short term could be more than offset by increased infrastructure spending (particularly if some of the revenue comes from those with high saving rates).
-
Second once in office Biden may dampen down his planned tax hikes, particularly if the economy is still weak as is likely.
-
Third, raising taxes on top earners while a negative for incentive may help reduce inequality which has been a key driver of the populist backlash of recent years and has arguably been made worse by Trump.
-
Fourth, Biden’s trade and foreign policy focussed more on strengthening ties with Europe and a diplomatic approach to dealing with China may substantially reduce a source of angst and uncertainty under Trump (which is likely to intensify if he is re-elected).
-
Finally, more stable and predictable policy making reliant on expert advice under Biden may provide a more certain environment for business and so result in increased business investment despite a rise in the corporate tax rate. Don’t forget that the uncertainty caused by Trump’s trade wars offset the boost to investment from his tax cuts.
So, on balance I see no reason to expect a weaker economic and share market outlook under a Biden presidency.
Likely market reaction
Firstly, despite the heightened policy uncertainty the election year is normally an okay year for US shares.
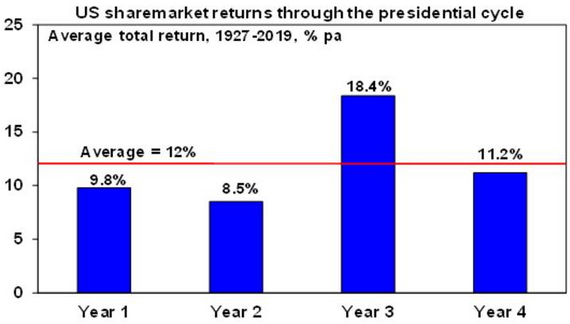
Source: Bloomberg, AMP Capital
Since 1927, the election year, or year 4 in the presidential cycle, has had an average total return of 11.2% pa, which is only just below the average return for all years. Of course, this year is complicated by the coronavirus hit to growth and so may well be weak regardless of the election.
Second, the run up to the election could see increased share market volatility if Trump’s prospects look bleak for two reasons: investors may start to fret about the prospects of increased taxes and regulation under a Biden presidency, particularly if it looks like Democrats will win control of the Senate; and Trump may reason that he will have nothing to lose by seriously ramping up tensions with China (and maybe Europe) in a way that threatens the economic outlook, but with the prospect of shoring up his base and rallying Americans around the flag. However, while there may be short term jitters ahead of the election, for the reasons noted in the last section, there is no reason to expect a weaker economy and hence share market under a Biden presidency. Investors may ultimately welcome more reasoned and predictable policy making.
Third, historically US shares have done best under Democrat presidents with an average return of 14.6% pa since 1927 compared to an average return under Republican presidents of 9.8% pa. This has been evident in recent years with good average annual returns under President’s Obama (14.8% pa) and Clinton (19.1% pa) versus terrible returns under President G W Bush (-0.6% pa) but strong returns under President Trump’s first three years (16.3% pa).
However, the best average result has actually occurred when there has been a Democrat president and Republican control of the House, the Senate or both. This has seen an average return of 16.4% pa. By contrast the return has only averaged 8.9% pa when the Republicans controlled the presidency and Congress.
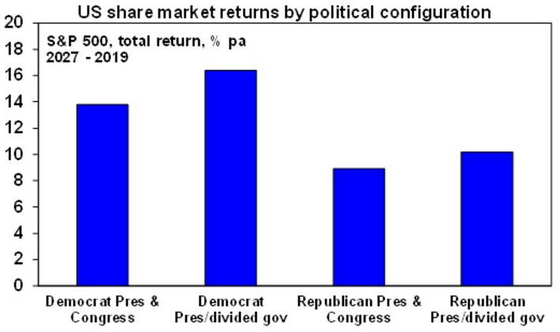
Source: Bloomberg, AMP Capital
Concluding comment
The run up to the US election has the potential to drive increased share market volatility if it looks increasingly likely that Biden will win and raise taxes and regulation and the risk is probably greater if President Trump decides he has nothing to lose and so ramps up tensions with China and maybe Europe. This would weigh on global and Australian shares and the Australian dollar given Australia’s exposure to China. However, this is likely to be short lived as there is no reason to expect a weaker economy and hence share market under a Biden presidency and he is likely to take a less disruptive approach to trade and foreign policy issues.
Source: AMP Capital 30 June 2020
Important notes: While every care has been taken in the preparation of this article, AMP Capital Investors Limited (ABN 59 001 777 591, AFSL 232497) and AMP Capital Funds Management Limited (ABN 15 159 557 721, AFSL 426455) (AMP Capital) makes no representations or warranties as to the accuracy or completeness of any statement in it including, without limitation, any forecasts. Past performance is not a reliable indicator of future performance. This article has been prepared for the purpose of providing general information, without taking account of any particular investor’s objectives, financial situation or needs. An investor should, before making any investment decisions, consider the appropriateness of the information in this article, and seek professional advice, having regard to the investor’s objectives, financial situation and needs. This article is solely for the use of the party to whom it is provided and must not be provided to any other person or entity without the express written consent of AMP Capital.

