

Olivers Insights
Share market correction
Share markets have seen a bit of volatility and a pullback over the past month. This has been particularly so for Australian shares. This note looks at the key drivers and whether it’s just a correction or a new bear market.
Download pdf
Drivers of recent volatilityOur view for this year has been
Read More|
Share markets have seen a bit of volatility and a pullback over the past month. This has been particularly so for Australian shares. This note looks at the key drivers and whether it’s just a correction or a new bear market. |
|

Drivers of recent volatility
Our view for this year has been that shares would have positive but more constrained returns than seen over 2012 and 2013 and that volatility would increase. Our basic reasoning was that with shares no longer dirt cheap, investors would have to depend more on earnings growth for share market gains and this would be more constrained and uncertain. Until recently it has been relatively calm though despite a range of worries and deep scepticism amongst many commentators. Lately though, it seems the worry list has intensified and this has been reflected in increased volatility.
The list of worries includes the following:
-
Top of the list has been unease about the gradual shift at the US Fed towards eventual monetary tightening. Ultra easy Fed policy has been a key source of support for the global economy and investment markets. Investors are naturally concerned about what will happen when this ends with the Fed’s third round of QE set to end later this month and the Fed talking about raising rates next year.
-
The global economic recovery has proved yet again to be fragile and uneven: with the Eurozone flirting with deflation; Japan struggling after a sales tax hike; the Chinese economy going through another soft patch; and emerging markets generally remaining subdued.
-
Meanwhile a range of geopolitical threats are causing nervousness including: the escalating involvement of the US and its allies in the conflict with IS in Iraq and Syria; the conflict in Ukraine; the protests in Hong Kong accentuating concerns regarding China; & the worsening Ebola pandemic in Africa & the arrival of cases in the US.
-
A range of “technical” concerns regarding US shares have added to these worries including: the absence of a “decent” correction since 2012 and low levels of volatility (or VIX) leading to fears investors may be complacent and the narrowing breadth of the US share market rally.
-
Finally, we have been going through a seasonally weak period of the year for shares. The September quarter is historically the weakest quarter of the year.

Source: Bloomberg, AMP Capital
While US and global shares have had only modest pullbacks of around 3 to 4%, Australian shares have been particularly hard hit with a fall of 7% reflecting the overlay of global concerns along with:
-
A sharp fall in the iron ore price and commodity prices generally on China worries;
-
Increasing talk that Australian banks will be forced to increase their capital ratios; and
-
Foreign investors retreating to the sidelines as the $A falls. They are 30-40% of the market and it’s quite normal for them to pull back as the $A falls as they fear a double hit to the value of their investments. Indeed $US based investors lost 12% in Australian shares last month.
The correction in shares could go further: US shares, which tend to lead global markets, are only off slightly so far whereas corrections often go to 5 to 10%; nervousness is likely to intensify in the run up to the end of QE3 later this month; nervousness in Europe may well continue until uncertainty is cleared up around banks with the ECB to announce results of stress tests later this month; and finally seasonal weakness often runs into October. However, we view this as a correction, not the start of a new bear market.
A correction, not a new bear
There are several reasons why what we are seeing is likely a correction, rather than a bear market. First, valuations are not extreme.

Source: Bloomberg, AMP Capital
This is evident in the previous chart which is based on a range of measures including a comparison of the yield on shares with that on bonds. Recent share market weakness has pushed valuations well into cheap territory again.
Second, the global economic cycle is a long way from posing a major threat to shares. The global economy is growing, but it’s uneven and sub-par. This is a blessing in disguise:
-
While the US looks to have recovered from a soft patch early this year, growth in Europe, Japan and China is dragging the chain. Europe is unlikely to slide back into recession with the ECB doing just enough to support growth but weak credit demand and a reluctance to ease fiscal policy growth will remain constraints. Meanwhile, China is doing better than most other regions but its stop/go approach to supporting growth in the face of pressure for long term reforms is likely to see growth stuck around 7%.

Source: Bloomberg, AMP Capital
-
As a result global spare capacity and excess savings remain intense so inflationary pressures remain tame and bond yields low.
-
In many ways the world resembles the 1990s after the early 90s recession with the US being a growth leader, other regions lagging and disinflationary pressure keeping a lid on inflation.
-
The overall result is that global growth is strong enough to boost profits but a long way from the boom conditions that cause escalating inflation. In other words, the global growth cycle is still in the “sweet spot”.
As a result, global monetary policy is set to remain easy.
-
While the US is edging towards monetary tightening, Europe, Japan and China are a long way from tightening and if anything are likely to see further easing.
-
This means the US dollar will likely remain under upwards pressure, which in turn will have the impact of importing low inflation into the US and delaying/limiting the extent of US rate hikes once they do start to get underway (as occurred in the second half of the 1990s).
-
Finally, although the Fed will likely end QE3 this month, a 15-20% fall in US shares as we saw in 2010 and 2011 with the ending of QE1 and QE2 is unlikely as the US economy is now on a much sounder footing.
Finally, we are still a long way from the sort of investor exuberance seen at major share market tops. It seems everyone is talking about share market corrections and crashes. In Australia, the amount of cash sitting in the superannuation system is still double average levels seen prior to the GFC and Australians continue to prefer bank deposits and paying down debt to shares and superannuation. There is still a lot of money that can come into equity markets as confidence improves.

Source: Westpac/Melbourne Institute, AMP Capital
So absent a left field shock the most likely outcome is that, while shares could see more downside in the next month, this is likely to be limited with the bull market to continue.
The threat from geopolitics and pandemics
Perhaps the main potential source of left field shocks are the current geopolitical threats, but our reading is that these are unlikely to pose a fundamental threat to global growth:
-
The Islamic State seems unlikely to threaten oil supplies and while a terror attack is a risk, it’s worth noting that the progression of such attacks last decade seemed to have less impact on markets as investors got used to them.
-
The threat from Ukraine may be receding.
-
The protests in Hong Kong are certainly a risk to China, but there is a good chance that they will peter out as the people of Hong Kong grow frustrated at the disruption they pose to their ability to go about their business.
-
The “arrival” of Ebola cases in the US and Spain is worth watching, but our base case is that it should be easier to contain in western countries with modern medical facilities and higher standards and ease of hygiene.
What does this mean for Australian shares?
If global shares have more short term downside then so too will Australian shares. However:
-
The Australian share market is now quite cheap again with the forward PE now back below 14 times.
-
The fall in the $A will further help the economy avoid recession as mining investment slows and provide a boost to corporate earnings as each 10% fall in the $A adds around 3% to earnings.
-
Interest rates are set to remain at generational lows with inflation pushing back towards the low end of the RBA’s target range according to the TD Securities Inflation Gauge and the RBA looking at using credit controls to slow investor demand for housing rather than rate hikes.
As such Australian shares are likely to see a strong rally into year end. Just bear in mind though that Australian shares are no longer the relative outperformer they were last decade. This decade is likely to see continued underperformance versus global shares as the commodity price super cycle is now going in reverse resulting in a headwind for the local share market and the falling $A (which we see heading down to $US0.80 or lower) will boost the value of offshore shares.
Concluding comments
The rough patch we have seen in shares lately could go a bit further. However, the bull market will likely remain intact thanks to a lack of overvaluation, the benign economic cycle, easy monetary conditions and a lack of investor euphoria.
Dr Shane Oliver
Head of Investment Strategy and Chief Economist
AMP Capital
Important note: While every care has been taken in the preparation of this article, AMP Capital Investors Limited (ABN 59 001 777 591, AFSL 232497) and AMP Capital Funds Management Limited (ABN 15 159 557 721, AFSL 426455) makes no representations or warranties as to the accuracy or completeness of any statement in it including, without limitation, any forecasts. Past performance is not a reliable indicator of future performance. This article has been prepared for the purpose of providing general information, without taking account of any particular investor’s objectives, financial situation or needs. An investor should, before making any investment decisions, consider the appropriateness of the information in this article, and seek professional advice, having regard to the investor’s objectives, financial situation and needs. This article is solely for the use of the party to whom it is provided.
Australian house prices – a bit too hot in parts
As the mining investment boom deflates, in order for Australia to rebalance its economy, a pick-up in demand for homes and house prices in response to lower interest rates, sending a signal to home builders to build more homes was essential. Fortunately, it’s occurred. The RBA (belatedly in my view) got rates down, home buyers returned, home prices rose and
Read More
IntroductionAs the mining investment boom deflates, in order for Australia to rebalance its economy, a pick-up in demand for homes and house prices in response to lower interest rates, sending a signal to home builders to build more homes was essential. Fortunately, it’s occurred. The RBA (belatedly in my view) got rates down, home buyers returned, home prices rose and we are now in the midst of a dwelling construction boom. The housing sector is doing its part! But it seems that there is nothing that gets Australians going more than what’s happening with house prices. Are they in a bubble? Is negative gearing to blame? Or is it foreign buying? Will it burst? Should the Reserve Bank slow it down? Is housing a good investment? This note looks at the current state of play in the Australian residential property market. |
|

Australian housing remains overvalued
Australian housing remains overvalued on most measures. But then again this has been an issue for more than a decade. For example, while a bit more extreme than my own view at the time, the OECD estimated that Australian house prices in 2004 were 51.8% overvalued. This compared to just 1.8% for US housing and 32.8% for the UK. While real house price weakness through 2010 to 2012 saw the degree of overvaluation diminish, the problem is returning with a vengeance:
-
According to the 2014 Demographia Housing Affordability Survey the median multiple of house prices to household income in Australia is 5.5 times versus 3.4 in the US.
-
On the basis of the ratio of house prices to rents adjusted for inflation relative to its long term average, Australian houses are 30% overvalued and units 17% overvalued.
-
The ratios of house prices to incomes and rents in Australia are 23.5% and 40.9% above their long term averages respectively, which is at the higher end of OECD countries. This contrasts with the US, which is near the lower end in the OECD.

Source: OECD, AMP Capital
-
And on my favourite measure, real house prices have been running above trend since 2003.

Source: ABS, AMP Capital
What’s to blame for high house prices?
There are two main drivers of the surge in house prices over the last two decades. The first was the shift to low interest rates. Lower rates enabled Australian’s to borrow more for a given level of income and so pay each other more for homes. As can be seen the shift in house prices from below trend to above (as derived from the last chart) has gone hand in hand with an increase in the ratio of household debt to income.

Source: ABS, RBA, AMP Capital
The trouble is that the shift to low interest rates occurred in many other countries and most did not have anywhere near the surge in house prices or household debt Australia had, implying a heavy speculative element in driving prices higher as well. I have long thought this surge in household debt and relative house prices represents Australia’s Achilles’ heal. Should anything go wrong with the ability of households to service their debt Australia would be at risk. Fortunately it’s hard to see the trigger for this in anything but a small way.
The second reason is a lack of supply. While the US saw a property price surge into 2006 matched by a supply surge, supply in Australia has been subdued due to restrictive land supply policies and high stamp duty and infrastructure charges. The National Housing Supply Council estimated a few years ago that since 2001 Australia had a cumulative net shortfall of over 200,000 dwellings. Reflecting this, residential vacancy rates remain relatively low.

Source: REIA, AMP Capital
Given the supply shortfall, most of the scapegoats that various commentators have come up with to explain high home prices are a sideshow. Foreign and SMSF buying is no doubt playing a role in some areas but looks to be small. Negative gearing is more contentious, but it’s likely that curtailing access to it when stamp duty remains very high will have a negative impact on the supply of property to the extent that it will have the effect of reducing the after tax return to property investment. Restricting negative gearing for property would also distort the investment market as it would still be available for other investments.
Rising risks
Our assessment is that the Australian property market is not at the bubble extreme it was at a decade ago: the overvaluation is a bit more modest; annual housing credit growth for owner occupiers and investors is running at around one third the pace seen in 2003; Australians don’t seem to be using their houses as ATMs against which debt can be drawn suggesting they are less comfortable regarding the outlook and debt; and the home price gains now have been over a shorter period and are concentrated in just Sydney & Melbourne. However, danger signs are emerging:
- After a cooler period during the first half of the year the property market seems to be hotting up again. National average home prices rose at an annualised 16.8% pace over the 3 months to August according to RP Data and auction clearance rates are at or above last year’s highs.

Source: Australian Property Monitors, AMP Capital
-
The proportion of housing finance commitments going to investors is now back to around the 50% high seen a decade ago, suggesting that the market is becoming more speculative. And there are signs that home buyers are starting to extrapolate recent strong price gains into the future which is very dangerous.
-
Finally, The Block is back on top as the most watched show on TV highlighting a return to very strong community interest in the property market.
Taken together these indicators warn that the housing market is getting a bit too hot.
Policy implications
The heat in the home buyer market is clearly starting to concern the Reserve Bank with its Financial Stability Review indicating that it’s becoming concerned about speculative activity in the property market and the risks this poses to the broader economy when the property cycle eventually turns down. Normally with the property market hotting up the RBA would start to think about raising interest rates but right now it’s loath to do this given uncertainty regarding the rest of the economy and the risk a rate hike would put upwards pressure on the still too high $A.
As a result APRA is more closely monitoring the banks and the RBA and APRA are now discussing steps that could be taken to ensure sound lending practices are maintained with a focus on investors. The latter would involve the use of macro-prudential controls to slow the housing market – which is really just a fancy term for the old fashioned credit rationing that used to be applied prior to the 1980s. This could involve limits on loan to valuation ratios, forcing banks to put aside more capital or forcing banks to impose tougher tests when granting loans. Such approaches all have problems: they tend to work against first home buyers; if they target investors as looks likely they work against a group of lower risk borrowers; people can start to find their way around them; and their impact is hard to gauge.
The best approach is for the RBA to first ramp up its efforts to warn home buyers of the need to be cautious. But if that fails in quickly cooling the property market, expect an announcement from APRA and the RBA on lending restrictions likely targeting investors in the next few months.
Housing as an investment
Notwithstanding the rising risk of macro prudential controls, in the short term further gains in house prices are likely until the RBA starts to raise interest rates probably around mid-next year, soon after which another 5 to 10% property price down cycle is likely to start.
Beyond the short term it’s worth noting residential property has provided a similar long term return as Australian shares, with both returning around 11 to 11.5% pa since the 1920s. They are also complimentary to each in terms of risk and liquidity and are lowly correlated. All of which means there is a case for investors to have exposure to both.
At present though, housing looks somewhat less attractive as a medium term investment. The gross rental yield on housing is around 3.2% and for units is around 4.4% giving an average of just 3.8%. After costs this is just below 2%. Shares & commercial property both offer much higher yields.
Medium term capital growth is also likely to be limited, with the overvaluation likely to see real house prices stuck in a 10% or so range around a broadly flat trend. This is consistent with the 10-20 year pattern of alternating secular bull and bear phases evident in the second chart in this note.
Taken together this suggests that a realistic expectation for total returns from residential property over the medium term is just around 4 to 5% pa.
Dr Shane Oliver
Head of Investment Strategy and Chief Economist
AMP Capital
Important note: While every care has been taken in the preparation of this article, AMP Capital Investors Limited (ABN 59 001 777 591, AFSL 232497) and AMP Capital Funds Management Limited (ABN 15 159 557 721, AFSL 426455) makes no representations or warranties as to the accuracy or completeness of any statement in it including, without limitation, any forecasts. Past performance is not a reliable indicator of future performance. This article has been prepared for the purpose of providing general information, without taking account of any particular investor’s objectives, financial situation or needs. An investor should, before making any investment decisions, consider the appropriateness of the information in this article, and seek professional advice, having regard to the investor’s objectives, financial situation and needs. This article is solely for the use of the party to whom it is provided.
The Fed, US rates & what it means for investors
The impending end of the US Federal Reserve’s quantitative easing (QE) program and when it will start to raise interest rates are looming large for investors. Very easy global monetary conditions, led by the Fed, have been a constant for the last six years helping the global recovery since the GFC. But with the US economy on the mend the
Read MoreIntroduction
|
The impending end of the US Federal Reserve’s quantitative easing (QE) program and when it will start to raise interest rates are looming large for investors. Very easy global monetary conditions, led by the Fed, have been a constant for the last six years helping the global recovery since the GFC. But with the US economy on the mend the Fed is edging towards returning monetary policy to more “normal” conditions and this was evident in the Fed’s September meeting. After gradually tapering its QE program all year it’s on track to end next month and attention is now shifting to the first interest rate hike. What will this mean for the US and global economy and for investment markets? This note takes a Q&A approach to the main issues. |
|

How did we get here?
It’s worth putting things in context and recalling how we got to this period of extraordinary easy monetary conditions. At its simplest it was just part of the cycle: growth weakened and so monetary conditions were eased. But the GFC related slump was deeper than normal leaving households and businesses far more cautious. So once interest rates hit zero and it was apparent the recovery was still sub-par, the focus shifted to measures to boost the supply of money. This became known as quantitative easing and involved the Fed printing money and using this to buy government bonds and mortgage backed debt. It helped growth by cutting borrowing costs, injecting cash into the economy, forcing investors to take on more risks, and to the extent it drives shares higher, it helped build wealth that helped spending.
Has ultra-easy US money worked?
The short answer is yes. A range of indicators suggest the US economy is now on a sounder footing: bank lending is strengthening; the housing construction recovery is continuing; consumer spending growth is reasonable; business investment looks stronger; business conditions indicators are strong; employment is back above its early 2008 high and unemployment has fallen to 6.1%. In particular, after a contraction in GDP in the March quarter, US growth bounced back strongly in the June quarter and solid growth looks to be continuing in the current quarter.

Source: Bloomberg, AMP Capital
How will the Fed tighten?
Reflecting the success of extraordinary monetary easing its little wonder the Fed is edging towards starting to return monetary conditions to “normal”. In the past doing this was easy as the Fed would just start raising interest rates. Now it’s more complicated. The first step was the tapering of its QE program. QE3 started at $US85bn a month in bond purchases in 2012 and following the start of tapering in December last year has now been cut to $US15bn a month. It’s now on track to end at the Fed’s late October meeting.
The second will be to actually tighten. This will come in the form of raising interest rates and reversing its QE program (ie unwinding the bonds it holds). Raising interest rates is simple, but unwinding its bond holding is a bit more complicated. At this stage it looks like it will primarily aim to do this by not replacing bonds as they mature.
How long till the first hike & what's "normal"?
For some time the Fed has said that it expects a “considerable time” between the end of QE and the first rate hike. This has been taken to mean around six months or more and so if QE ends in October this means the first hike will occur around the June quarter next year. While the Fed is still retaining the “considerable time” language its clear from Fed Chair Yellen’s comments that the timing of the first rate hike is conditional on how the economy is performing. Our best guess though remains that the first hike will come in the June quarter. While the economy is on the mend, there remain several reasons why the Fed is not in a great hurry:
-
Growth is still far from booming and the difference between actual and potential GDP is around 4%.
-
Labour force underutilisation, which includes unemployment and those wanting to work longer, at 12% is well above the 9.4% average that applied when the Fed started raising rates in 1994, 1997, 1999 and 2004.
-
Wages growth remains very weak at just 2.1% year on year, which is where it’s been for the last four years now.
-
Inflation on the Fed’s preferred measures is just 1.5%.
Finally, global economic conditions are still subdued including in Europe and the emerging world and this is a dampener on demand for US exports.

Source: Bloomberg, AMP Capital
Reflecting this, the Fed can afford to take its time and when it does start to hike next year the process is likely to be gradual. In the past the “normal” or neutral level for the Fed Funds rate was thought to be around 4.5%, but Fed officials now put it at around 3.75% reflecting a more constrained growth environment due to more cautious attitudes towards debt and slowing labour force growth. So the Fed Funds rate may not rise that much above 3.75% in the upcoming tightening cycle, but it will take several years to get there.
What about the impact on the US economy?
Just remember that the Fed is only edging towards rate hikes because the US economy is stronger and so it can now start to be taken off life support. After the efforts of the last few years the last thing the Fed wants to do is to knock the economy back down again. Historically, it is only when interest rates rise above neutral and above the level of long term bond yields (which are now 2.6%) that the US economy starts to slow. At present we are still a long way from that.
What about the impact on the end of QE?
The more immediate issue is the end of QE next month. A concern for investors is that when QE1 ended in March 2010 and when QE2 ended in June 2011 they were associated with 15 to 20% share market falls. See the next chart.

Source: Bloomberg, AMP Capital
However, while the ending of QE3 may add to volatility it’s very different to the abrupt and arbitrary ending of QE1 and QE2. Back then the US economy was much weaker and global confidence was hit by the Eurozone crisis. Now the US economy is on a sounder footing.
What about the impact of rate hikes?
Shares – just as talk of tapering upset shares around the middle of last year (with a 5-10% correction), so too talk and then the initial reality of rising US interest rates could cause a similar upset. However, the historical experience tells us that the start of a monetary tightening cycle is not necessarily bad for shares. The next table shows US shares around past Fed tightening cycles. The initial reaction after three months is mixed with shares up half the time and down half the time. But after 12 and 24 months a positive response dominates. The reason is because in the early phases of a tightening cycle higher interest rates reflect better economic and profit growth. It’s only as rates rise to onerous levels to quell inflation that it becomes a problem. But that’s a fair way off.

Source: Thomson Reuters, AMP Capital
It’s also worth noting that the rally in shares over the last five years is not just due to easy money. It has helped, but the rally has been underpinned by record profit levels in the US.
Bonds – the commencement of a monetary tightening cycle in the US is expected to put upwards pressure on US and hence global bond yields in response to uncertainty as to how high rates will ultimately go and as to how quickly the Fed will reduce its bond holdings. A 1994 style bond crash is a risk, but unlikely as the US/global economy is not as strong as back then. What’s more the monetary tightening will not be synchronised with Europe, Japan and China possibly easing further. As such the back up in bond yields is likely to be gradual and the broad environment will remain one of low interest rates and bond yields for some time yet.
US dollar – the combination of anticipated then actual tightening of US monetary policy at a time of easy/easing monetary policy in many other parts of the world will likely put further upwards pressure on the value of the US dollar.
Emerging market assets – tightening US monetary conditions could weigh on some emerging countries that are dependent on foreign capital inflows. It remains a time to be selective when investing in emerging market shares.
What about the impact on Australia?
The gradual move towards US monetary tightening has taken pressure off the $A allowing it to resume its downtrend which is likely to take it down to $US0.80 over the next year or two. This is necessary to deal with Australia’s high cost base and weakening export prices. While the Australian share market could underperform as the $A heads down as foreigners stay away, ultimately it will provide a huge boost as it helps trade exposed sectors become more competitive and boosts the value of foreign sourced earnings. Roughly speaking each 10% fall in the $A adds about 3% to earnings.
Concluding comments
With the US economy on a sounder footing, the Fed is getting closer to a tightening cycle. While this could contribute to short term share market volatility, the tightening is likely to be gradual given the constrained global economic recovery & we are a long way from tight monetary conditions that will seriously threaten the cyclical rally in shares.
Dr Shane Oliver
Head of Investment Strategy and Chief Economist
AMP Capital
Important note: While every care has been taken in the preparation of this article, AMP Capital Investors Limited (ABN 59 001 777 591, AFSL 232497) and AMP Capital Funds Management Limited (ABN 15 159 557 721, AFSL 426455) makes no representations or warranties as to the accuracy or completeness of any statement in it including, without limitation, any forecasts. Past performance is not a reliable indicator of future performance. This article has been prepared for the purpose of providing general information, without taking account of any particular investor’s objectives, financial situation or needs. An investor should, before making any investment decisions, consider the appropriateness of the information in this article, and seek professional advice, having regard to the investor’s objectives, financial situation and needs. This article is solely for the use of the party to whom it is provided.
Profits and the Australian economy – not bad!
The slowdown in June quarter GDP growth to just 0.5% quarter on quarter, or just 2% on a US style annualised basis, against the backdrop of weak commodity prices, the end of the mining investment boom and rising unemployment may add to consternation regarding the Australian economic outlook. And yet the local share market has been performing well. Is the
Read More|
The slowdown in June quarter GDP growth to just 0.5% quarter on quarter, or just 2% on a US style annualised basis, against the backdrop of weak commodity prices, the end of the mining investment boom and rising unemployment may add to consternation regarding the Australian economic outlook. And yet the local share market has been performing well. Is the outlook as bad as some fear or have shares got it right? Yet again the share market seems to have taken comfort from recent earnings results so I’ll start there. |
|

Profits not booming, but look reasonable
The June half profit reporting season that just ended was preceded by nervousness associated with the falling iron ore price and the blow to consumer confidence associated with the Budget. In the event though solid growth was confirmed for 2013-14 and consensus earnings expectations for the current financial year were affirmed. In terms of specifics:
-
54% of companies exceeded expectations, which is the best result in nine years. This is a welcome outcome for investors who were probably fearing more misses;

Source: AMP Capital
-
68% of companies have seen their profits rise from a year ago (compared to a norm of 66%);
-
65% of companies have increased their dividends from a year ago (up from around 60% in the last two years); and
-
60% of companies saw their share price outperform the market the day they released results, the best in 4 years.

Source: AMP Capital
Key themes have been:
-
strong profit growth of 25% for resources after a 19% profit slump as costs fell and volumes rose;
-
financials doing well with 11.5% profit growth, helped by 9% growth from the banks and a 34% surge for insurers;
-
ongoing cost control making up for still soft revenue growth resulting in 4% profit growth for industrials;
-
mixed results for cyclicals – good for Boral, Stockland & Harvey Norman, not so good for JB HiFi; and
-
strong dividend growth reflecting investor interest in income, strong cash flow growth and corporate confidence in earnings prospects. Dividends grew 7% after 11% growth in 2012-13.
Consensus expectations for the current financial year are for 5% earnings growth, which is unchanged from the start of the reporting season and presents a relatively low hurdle.

Source: UBS, AMP Capital
This reflects a slowing in resources profit growth to just 3% as lower commodity prices feed through partly offset by higher export volumes; bank and financials seeing profit growth slowing to 5%, but a pickup in profit growth for industrials ex-financials to 8.5%. Clearly the latter is dependent on some pick-up in economic growth.
Soft June quarter GDP, but ok outlook
The slowdown in economic growth seen in June quarter may add to concerns about the economy. Particularly so with Australian Bureau of Statistics (ABS) business investment intentions data pointing to a fall in business investment this financial year of 9 to 10%. However, the broad outlook remains for a gradual improvement in growth. The poor GDP growth seen in the June quarter is pay back for the much stronger than expected 1.1% rise seen in the March quarter. This reflected noise in the timing of exports and imports such that trade boosted growth by 1.4 percentage points in the March quarter and detracted 0.9 percentage points in the June quarter. Given this it makes sense to average the two quarters giving average quarterly growth of 0.8%, or 3.2% annualised, which is actually pretty good.
Of course, spending growth averaged over the two quarters is just 2.2% annualised which is hardly great. However, signs continue to mount that thanks to the fall in interest rates to record lows and to a lesser degree the lower $A, the economy is rebalancing towards more broad based growth.
-
A housing construction boom is now underway with home building up 8.6% over the last year and more on the way.

Source: Bloomberg, AMP Capital
-
Business confidence has risen to solid levels and while consumer confidence took a hit from the Budget cutbacks scare, it seems to be clawing its way back up.

Source: Bloomberg, AMP Capital
-
A range of forward looking labour market indicators – ANZ and SEEK job ads, skilled vacancies and the NAB business survey are pointing up for jobs.

Source: ABS, NAB, AMP Capital
-
Lower interest rates, rising wealth levels and rising housing construction is likely to drive a pick-up in retail sales with household equipment leading the charge.
-
While the investment outlook for mining and manufacturing is bleak the outlook for investment in other industries is improving. Investment intentions for what the ABS calls “other selected industries” points to a 9% to 10% gain this financial year. And the NAB business survey’s investment intentions index has actually started to rise pointing to stronger investment ahead.

Source: ABS, NAB, AMP Capital
-
Finally, we are also coming into the third and final phase of the resources boom. We will see increased export volumes as projects complete and reduced capital goods imports as resource investment slows.
Drawing these factors together our assessment remains that underlying demand and growth in Australia is gradually on the mend and should be running around trend of just above 3% through next year.
Not "dog days"
The key to the Australian economy right now is rebalancing. The mining investment boom and associated surge in interest rates and in the $A that were necessary to make way for it, led to a dramatically imbalanced economy with half of growth coming from mining investment at one point. This clearly adversely affected big parts of the non-mining economy. With mining investment now fading, lower interest rates and in time further declines in the $A are allowing the non-mining economy to bounce back. This process is slow – and it would be aided by a reinvigorated economic reform agenda – but the indicators above suggest it’s underway.
Implications for investors
First, the outlook for the economy is not nearly as gloomy as frequent headlines suggest. Profits are likely to record modest but reasonable growth over year ahead.
Second, interest rates are likely to remain on hold. Growth is not bad enough and there are enough signs rate cuts are working to argue against rate cuts. But the high level of uncertainty regarding the economic outlook, the still too high $A and low inflation argue against rate hikes. The most likely outcome is that rates will be on hold well into next year.
Finally, the combination of rising economic growth and continuing low interest rates should underpin a pick-up in non-resources earnings growth over the year ahead, which in turn should support further gains in the Australian share market. Our year-end target for the ASX 200 remains 5800.
Dr Shane Oliver
Head of Investment Strategy and Chief Economist
AMP Capital
Important note: While every care has been taken in the preparation of this article, AMP Capital Investors Limited (ABN 59 001 777 591, AFSL 232497) and AMP Capital Funds Management Limited (ABN 15 159 557 721, AFSL 426455) makes no representations or warranties as to the accuracy or completeness of any statement in it including, without limitation, any forecasts. Past performance is not a reliable indicator of future performance. This article has been prepared for the purpose of providing general information, without taking account of any particular investor’s objectives, financial situation or needs. An investor should, before making any investment decisions, consider the appropriateness of the information in this article, and seek professional advice, having regard to the investor’s objectives, financial situation and needs. This article is solely for the use of the party to whom it is provided.
The global economic outlook – implications for investors
As we approach mid-year it’s worth reviewing the outlook for shares particularly with numerous warnings of corrections and crashes. Our view for this year has been that share market gains would be positive, but more constrained than seen in the last two years, and that volatility would increase – including the likelihood of a 10-15% correction along the wPhase 1
Read More|
As we approach mid-year it’s worth reviewing the outlook for shares particularly with numerous warnings of corrections and crashes. Our view for this year has been that share market gains would be positive, but more constrained than seen in the last two years, and that volatility would increase – including the likelihood of a 10-15% correction along the wPhase 1 is driven by an unwindingay. In the event gains in shares have been more constrained, with global shares (in local currency terms) up 4.5% year to date and Australian shares up 1.5%. However, volatility has been relatively low. This note looks at the major regions in terms of growth, inflation and interest rates and what it means for investors. |
|

The US – looking good but not booming
After a contraction in the March quarter driven by mostly temporary factors, the US economy rebounded in the June quarter and looks on track for growth of around 3% in the current quarter. The jobs market and business investment are improving and the shale oil boom is providing a long term boost both directly and indirectly via cheap electricity costs for business. However, while the US is looking a lot stronger it’s a long way from booming, let alone overheating, with growth seemingly stuck in a 2-3% range as the housing recovery and consumer spending have slowed a bit of late.

Source: Bloomberg, AMP Capital
Which brings us to what the Federal Reserve will do. On the one hand US growth has improved enough to allow the Fed to continue “tapering” its quantitative easing program which means it’s on track to end probably in October. On the other hand it’s unclear that conditions are strong enough to warrant interest rate hikes just yet. This is something the Fed is grappling with, but the conclusion seems to be that – with inflation remaining low at just 1.5% on the Fed’s preferred measure, wages/labour cost growth stuck around 2% and broad measures of labour market slack (ie allowing for the unemployed, underemployed and discouraged workers) remaining high – its unlikely to rush into raising rates.

Source: Bloomberg, AMP Capital
Our assessment is that the Fed is gradually inching towards an interest rate hike, but it’s probably not going to occur until sometime in the June quarter next year.
The Eurozone – better but not great
The Eurozone returned to growth about a year ago but it is far from robust and stalled in the June quarter with weakness in Germany, Italy and France. Uncertainty regarding Russian sanctions and Ukraine are not helping. What’s more bank lending growth has remained negative and inflation has fallen to just 0.4% year on year. This has all led to concerns that Europe is sliding into Japanese style stagnation and that the ECB needs to do more.

Source: Bloomberg, AMP Capital
Our assessment though is that Europe is gradually mending: growth has returned to Spain, Ireland, Portugal and Greece; these countries have all made significant structural reforms to their economies and France and Italy look to be gradually heading down that path; the troubled countries have all seen their bond yields collapse, eg Spain’s 10 year bond yield is now just 2.17%; the ECB announced further stimulus in June, but looks to be ready to launch into quantitative easing involving the purchase of private debt in the next few months; and bank lending should improve once the ECB’s bank stress tests are out of the way in a few months.
Japan – Abenomics on track
Japan’s growth was hit in the June quarter by the pull- forward effect of the April sales tax hike. However, a range of indicators suggest that despite the volatility the Japanese economy has weathered the sales tax hike well with ultra-easy monetary policy and economic reforms providing confidence growth will bounce back from the current quarter.

Source: Bloomberg, AMP Capital
However, given the uncertainty, the Bank of Japan will either have to maintain its very easy monetary conditions or possibly have to ease further.
China running hot and cold
For the last three years now Chinese economic data has been running hot and cold every six months leading to periodic worries about growth. Another slowdown in the Chinese property market is adding to these concerns.

Source: Bloomberg, AMP Capital
With the Chinese Government repeatedly indicating that there is a floor to growth of around 7%, and supporting this by mini-stimulus measures as they have done this year, our assessment remains that the Chinese economy is on track for growth of around 7.5%. But don’t count on more.
Emerging world
The emerging world more generally is a lot messier than it used to be. Of the major’s, China and Mexico look ok and the election of reform oriented governments in India and Indonesia is positive, but Brazil looks to have lost the plot under the current Government, and Russia already weakened looks to have shot itself in the foot over Ukraine. A lack of structural reforms over the last decade has led to lower growth potential in the emerging world. That said it’s still on track for growth around 4.5% this year and next.
Global growth – two steps forward, one back
Bringing this together, global business conditions indicators are consistent with good but not booming growth.

Source: Bloomberg, AMP Capital
Although global growth is likely to pick up, it’s hard to describe global conditions as synchronised and the global economic expansion remains very much a process of two steps forward, one step back. This was clearly evident in the first half of the year with the US and Japan both having negative quarters, China slowing in the first quarter and Europe stalling in the June quarter. And of course geopolitical events continue to wax and wane and the threat from Ebola remains in the background – all of which impart a deflationary impact in terms of their dampening impact on confidence and spending. Against this backdrop it is hard to see the Fed wanting to rock the boat prematurely with talk of interest rate hikes, let alone actual hikes, and the ECB, Bank of Japan and People’s Bank of China are likely to maintain ultra-easy policy or ease further.
Investment implications
There are several implications for investors. First, gradually improving global growth, still benign inflation and easy monetary conditions tell us we are still in the sweet spot of the economic cycle which augurs well for growth assets.
Second, the desynchronised global economic and monetary cycles confirm that the “risk off, risk on” phenomenon of a few years ago where all growth assets move up and down together has faded. This should make it easier for fund managers and investors to benefit from opportunities in individual regions, assets or stocks. Eg we think there is currently good value in Chinese shares, European shares and commodities. The divergence in monetary cycles is also likely to mean upwards pressure on the $US but downwards pressure on the Yen and Euro.
Thirdly, the constrained global growth cycle provides a reminder not to expect double digit gains from growth assets year after year. It will still be a relatively constrained world in terms of sustainable returns.
Finally, the big thing globally to keep an eye out for will be when the Fed will start to raise interest rates. This, or rather its anticipation, will likely cause a few bumps (just like last year’s taper tantrum did), but it’s still a fair way off and when it does come its unlikely to spell the end of the cyclical bull market in shares as it will be a long while before monetary conditions actually become tight.
Dr Shane Oliver
Head of Investment Strategy and Chief Economist
AMP Capital
Important note: While every care has been taken in the preparation of this article, AMP Capital Investors Limited (ABN 59 001 777 591, AFSL 232497) and AMP Capital Funds Management Limited (ABN 15 159 557 721, AFSL 426455) makes no representations or warranties as to the accuracy or completeness of any statement in it including, without limitation, any forecasts. Past performance is not a reliable indicator of future performance. This article has been prepared for the purpose of providing general information, without taking account of any particular investor’s objectives, financial situation or needs. An investor should, before making any investment decisions, consider the appropriateness of the information in this article, and seek professional advice, having regard to the investor’s objectives, financial situation and needs. This article is solely for the use of the party to whom it is provided.
The latest Ebola outbreak – implications for investors
The last few weeks have seen a range of factors causing volatility in investment markets including concerns that the Fed might start to raise interest rates earlier than expected, worries about the lack of strength in Europe, Russian trade sanctions and the conflicts in Ukraine, Iraq and the Middle East. In the background have also been concerns about the worsening
Read More|
The last few weeks have seen a range of factors causing volatility in investment markets including concerns that the Fed might start to raise interest rates earlier than expected, worries about the lack of strength in Europe, Russian trade sanctions and the conflicts in Ukraine, Iraq and the Middle East. In the background have also been concerns about the worsening Ebola outbreak in West Africa with the risk it could cause a global pandemic. This has been heightened after the World Health Organisation (WHO) declared the outbreak an “international public health emergency”. While this is first and foremost a human crisis, understandably there is some concern this could turn into a global pandemic scare first affecting travel related stocks but then having a broader economic impact. That said, recent experiences with SARS, bird flu and swine flu highlight that worst case pandemic fears don’t always eventuate. |
|

Some background on Ebola
Here is a summary of information regarding Ebola:
- Ebola virus disease affects humans and other primates. Flu like symptoms appear two days to three weeks after infection and then move on to nausea, vomiting and diarrhoea and reduced function of the liver and kidneys and bleeding. The mortality rate is around 60 to 65%.
- Since the disease was first identified in 1976, there have been several outbreaks which usually start with human contact with an infected animal’s body fluids. Transmission between humans occurs via contact with an infected person’s body fluids. Airborne transmission has not been observed. As a result the potential for widespread transmission is considered to be low.
- Large scale epidemics have mainly taken place in poor isolated areas of Africa lacking in modern medical support and poor hygiene.
- No vaccine is available and treatment usually involves supporting the patient and the administration of medications to control bleeding and prevent secondary infections but the scale of the latest outbreak appears to have helped clear the way of use of unproven drugs.
- Prevention includes wearing protective clothing around patients, isolating them and quarantining affected areas.
- The 2014 outbreak is the worst to date affecting Guinea, Sierra Leone, Liberia and Nigeria. As of August 13 there were 2127 cases and 1145 deaths although this likely understates the true position.
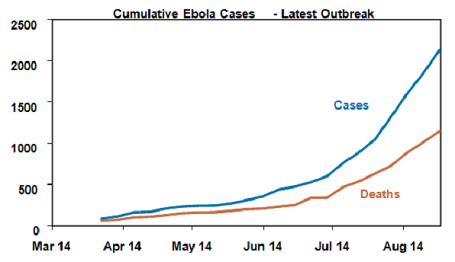
Source: World Health Organisation, AMP Capital
- On August 8 WHO declared the latest Ebola epidemic to be an “international public health emergency” which has the effect of mobilising global resources to combat it.
- Cordoning off affected areas and border closures (eg, Liberia) and screening measures are now becoming common. Flights to affected areas are being suspended.
Past experiences
To provide some context it is worth reviewing past pandemics – both real and feared. There were three influenza pandemics in the last century: 1918-19, 1957 and 1968. The 1957 and 1968 pandemics are estimated to have killed up to 4 million people. However, the 1918 Spanish flu pandemic was the most severe. While the mortality rate was low, up to 50 million people died worldwide. With a big proportion of the population staying at home, economic activity was severely disrupted, although this was compounded by the ending of World War I. US industrial production slumped 18% between March 1918 and March 1919. Australian real GDP slumped 5.5% in 1919-20 (but then rebounded 13.6% in 1920-21). The share market impact is hard to discern given the volatility associated with the ending of WWI, however US and Australian share markets rose through much of the pandemic period.
The SARS outbreak of 2003 is perhaps a more useful guide. After emerging in China around February 2003, SARS infected about 8000 people (mostly in Asia) in 30 countries over a five month period and had a mortality rate of about 10%. While the number infected was not that great, SARS had a big negative impact on the countries most affected as people stayed home for fear of catching it. GDP in Hong Kong and Singapore slumped by over 2% in the June quarter of 2003 as retail sales fell, workers stayed home and travel dried up. Growth then subsequently rebounded.
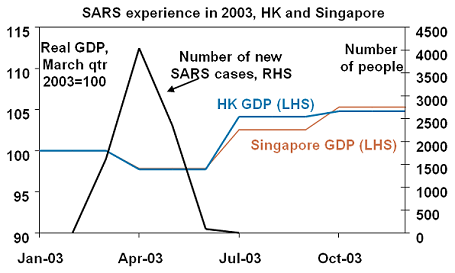
Source: Thomson Financial, AMP Capital Investors
Reflecting SARS, Asian shares fell in April 2003, even though global shares started to move out of a three year bear market from March. The April 2003 low in Asian shares coincided with signs the number of new cases was peaking, and this was well ahead of the economic recovery.

Source: Thomson Financial, AMP Capital Investors
Most pandemics have taken six to 18 months to run their course and usually peter out as measures are taken to slow their spread (eg, hygiene, quarantining, banning gatherings, preventing travel). SARS ended quicker due to the nature of the virus and rapid action by authorities.
In 2005 and early 2006, there was significant concern that a severe strain of bird flu (called H5N1), which was resulting in human casualties, mainly in parts of Asia where people had contact with chickens, would mutate into a form that was readily transmissible between humans. However, this didn't really eventuate and as such the economic impact was modest although it did cause bouts of volatility in share markets in 2005 and early 2006.
Similarly concern that the spread of swine flu would become a global pandemic rattled share markets for a while around April 2009 but quickly faded. The WHO was subsequently criticised for becoming too alarmist as it had declared the outbreak a “public health emergency.”
The economic and financial impact
The severity of the latest Ebola outbreak tells us there is reason for concern, but history tells us it might all come to nothing. Given the range of possibilities, the best way to get a handle on the economic and investment market impact of Ebola is to consider several scenarios. We suggest three.
1. Containment to Africa – the number of cases continues to rise for a few months but it remains mainly contained to West Africa.
- The global economic impact would be minor as the affected countries are of minor global economic significance.
- There might be bouts of share market nervousness (particularly airline stocks), but these would be limited.
2. Spread globally but contained – a significant number of Ebola cases appear in western countries from travellers returning from Africa but quick action by health authorities contains the outbreak to, say, a few thousand cases and there is no widespread transmission in western countries.
- News of cases popping up in western countries would cause significant uncertainty which might have a small negative impact on economic activity. The travel industry is most likely to be affected (much as occurred with SARS) as people stop travelling and there may also be some effect on economic activity as people avoid crowds. But the impact should be small and short-lived.
- Share markets are likely to fall on news of a spread to western countries but the fall is likely to be limited to a normal correction after which markets would rebound.
3. Global pandemic – Ebola spreads globally turning into a global pandemic, against which available medicine has little initial impact and attempts at containment are unsuccessful resulting in millions of deaths.
-
This scenario would see a major negative impact on economic activity. Global travel would virtually cease. Many would simply not come into work – a reasonable estimate is around 20% of workers, although this might be spread over time. This would see a sharp slump in GDP and the onset of a global recession. Australia would not be immune.
-
Share markets would likely fall sharply – maybe by 20% or so – reflecting the huge economic and profit uncertainty. Cash would be the place to be for investors.
-
However, if history is any guide economic activity would rebound quickly once it’s clear the pandemic is under control. Share markets are likely to anticipate this and rebound even as economic conditions remain bleak.
Concluding comments
While there is reason for concern and it is easy to dream up nightmare scenarios, the experience with SARS, the pandemonium over bird flu with “predictions” it could kill as many as 150 million people and the mini panic regarding swine flu (for a while I always packed Tamiflu when travelling overseas!) tell us that the worst case fears of pandemics usually don’t come to pass. Hopefully the same will apply to the latest Ebola outbreak. It is not easily transmissible and should be more easy to contain if it makes its way to western countries with modern medical facilities and higher standards (and ease of) hygiene.
As such, our base case scenario (with 90% probability) is that Ebola remains essentially contained to Africa. This suggests that while there might be a bit of short term volatility around Ebola scares there is unlikely to be a major impact on share markets. However, since the risk is not insignificant it will be necessary for investors to keep a close eye on how the latest outbreak develops. The key for investors at this stage is to be alert, but not alarmed.
Dr Shane Oliver
Head of Investment Strategy and Chief Economist
AMP Capital
Important note: While every care has been taken in the preparation of this article, AMP Capital Investors Limited (ABN 59 001 777 591, AFSL 232497) and AMP Capital Funds Management Limited (ABN 15 159 557 721, AFSL 426455) makes no representations or warranties as to the accuracy or completeness of any statement in it including, without limitation, any forecasts. Past performance is not a reliable indicator of future performance. This article has been prepared for the purpose of providing general information, without taking account of any particular investor’s objectives, financial situation or needs. An investor should, before making any investment decisions, consider the appropriateness of the information in this article, and seek professional advice, having regard to the investor’s objectives, financial situation and needs. This article is solely for the use of the party to whom it is provided.

