

Olivers Insights
Why I love dividends and you should too
Up until the 1950s most share investors were long term investors who bought stocks for their dividend income. This changed in the 1960s as bond yields rose on the back of inflation and investors started to shift focus to capital growth. However, thanks to the volatility seen over the last decade or so, and an increased focus on investment income
Read More|
Up until the 1950s most share investors were long term investors who bought stocks for their dividend income. This changed in the 1960s as bond yields rose on the back of inflation and investors started to shift focus to capital growth. However, thanks to the volatility seen over the last decade or so, and an increased focus on investment income as baby boomers retire, interest in dividends has been on the rise. Investor demand for dividends is clearly evident in Australia with even the big resource stocks starting to heed the call. This is a good thing because dividends are good for investors in more ways than just the income they provide. |
|

It’s well-known Australian companies pay out a high proportion of earnings as dividends. This is currently 75%, and it’s averaged around this since the late 1980s. Banks, telcos, consumer stocks and utilities are the big dividend payers. By contrast in the major global markets dividend payout ratios range from 31% in Japan to 49% in the UK.
However, some argue that dividends are irrelevant and simply don’t matter – as investors should be indifferent as to whether an investment pays a dividend, or whether the company retains earnings that are reinvested to drive earnings growth. Or worse still, some argue that high dividend pay outs are a sign of poor long term growth prospects or that they are not sustainable. And of course, some just see dividends as boring relative to the excitement that can come from speculating on moves in share values. My assessment is far more favourable.
Dividends are cool
There are lots of reasons to love dividends and here they are. First, dividends do matter in terms of returns from shares. For the US share market it has been found that higher dividend pay outs lead to higher (not lower) earnings growth.¹ This is illustrated in the next chart which shows that for the period since 1946 whenever US companies have paid out a high proportion of earnings as dividends (the horizontal axis) this has tended to be associated with higher growth in corporate profits (after inflation) over the subsequent 10 years (vertical axis).

Source: Global Financial Data, Thomson Reuters, AMP Capital
And of course higher growth in company profits contributes to higher returns from shares over the long term. This all suggests dividends do matter & the higher the better (within reason). There are several reasons why this is the case:
-
when companies retain a high proportion of earnings there is a tendency for poor investments which subsequently leads to poor earnings growth;
-
high dividend pay outs are indicative of corporate confidence about future earnings (otherwise companies would not feel comfortable in paying them);
-
high dividend pay outs are a positive sign as they indicate earnings are real, ie backed by cash flow.
The bottom line is that strong dividend pay outs are more likely to be consistent with strong, not weak, earnings growth. The higher dividend yield and pay out ratios for Australian companies, compared to mainstream global share markets, is a positive sign for relative returns from the Australian share market on a medium term basis – particularly at a time when the boost to national income from the terms of trade is going in reverse.
Secondly, concerns about the sustainability of dividends fly in the face of all the evidence that companies like to manage dividend expectations smoothly. They rarely raise the level of dividends if they think it will be unsustainable. As can be seen below, dividends move roughly in line with earnings but are a bit smoother. For an investor this means the flow of dividend income is relatively smooth.

Source: Thomson Reuters, AMP Capital
Thirdly, decent dividend yields provide security during uncertain times. As can be seen in the next chart dividends provide a stable contribution to the total return from shares over time, compared to the year-to-year volatility in capital gains. Of the 11.8% pa total return from Australian shares since 1900, just over half has been from dividends.

Source: Global Financial Data, AMP Capital Investors
Fourthly, investor demand for stocks paying decent dividends will be supported over the years ahead as more baby boomers retire and focus on income generation.
Fifthly, with the scope for capital growth from shares diminished thanks to relatively high price to earnings ratios compared to 30 years ago, dividends will comprise a much higher proportion of total equity returns than was the case in the 1980s and 1990s globally and in Australian shares up until 2007. Around half of the total return from Australian shares over the next 5 to 10 years is likely to come from dividends, once allowance is made for franking credits.
Finally, and for some most importantly, dividends provide good income. Grossed up for franking credits the annual income flow from dividends on Australian shares is currently around 5.7%. That’s $5700 a year on a $100,000 investment in shares compared to $3500 a year on the same investment in term deposits (assuming a term deposit rate of 3.5%).
Another angle on dividend income
The next chart illustrates just how powerful investing for dividend income (without even really trying) can be relative to investing for income from bank term deposits. It compares initial $100,000 investments in Australian shares and one year term deposits in December 1979. The term deposit would still be worth $100,000 (red line) and last year would have paid $4,150 in interest (red bars). By contrast the $100,000 invested in shares would have grown to $1,054,000 (blue line) and would have paid $45,000 in dividends before franking credits (blue bars). This would translate to around $59,650 if franking credits are allowed for. The reason for the difference is over time an investment in shares tends to rise in value, whereas an investment in term deposits is fixed.

Source: RBA, Bloomberg, AMP Capital
New highs
Finally, while we all bemoan the fact that Australian shares are still trading around 20% below their 2007 all-time high, once reinvested dividends are allowed for (ie looking at the ASX 200 accumulation index) the Australian share market is now above its all-time high. In other words an investor who (god forbid) put all their money into the market at the peak in 2007 would now be in the black if they had reinvested dividends along the way.

Source: Bloomberg, AMP Capital
Why dividend imputation is important
Which brings us to the topic of dividend imputation. This arrangement was introduced in the 1980s and allows Australians to claim a credit for tax already paid on their dividends in the hands of companies as corporate earnings and effectively boosts the average dividend yield on Australian shares by around 1.5 percentage points. However, in recent times it has been subject to some questioning with the interim report of the Financial System Inquiry questioning whether dividend imputation was creating a bias to invest in domestic equities and adversely affecting the development of the corporate bond market. Meanwhile, some such as Treasury argue that it along with other tax concessions (like negative gearing) primarily benefit the rich.
The trouble is that dividend imputation actually corrects a bias by removing the double taxation of earnings – once in the hands of companies and again in the hands of investors. It also encourages corporates to give decent dividends to shareholders as opposed to irrationally hoarding earnings. Interest on corporate debt never suffered from double taxation as it is paid out of pre-tax corporate earnings. And all such concessions encourage savings in the face of Australia’s relatively high marginal tax rates. The removal of dividend imputation would not only reintroduce a bias against equities but substantially cut into the retirement savings and income of Australian investors, discourage savings and lead to lower returns from Australian shares. So hopefully common sense will prevail and dividend imputation will not be tampered with.
Concluding comments
Dividends are often overlooked. But they provide a great contribution to returns, a degree of protection during bear markets and a great income flow. Investors should always allow for them in their investment decisions.
Dr Shane Oliver
Head of Investment Strategy and Chief Economist
AMP Capital
¹ See R.D.Arnott and C.S.Asness, “Surprise! Higher Dividends = Higher Earnings Growth”, Financial Analysts Journal, Jan/Feb 2003. Of course it’s become a bit complicated for US shares in recent times as the tax system effectively encourages companies to return capital to investors as buy backs as opposed to dividends, which might be argued to be the same thing.
Important note: While every care has been taken in the preparation of this article, AMP Capital Investors Limited (ABN 59 001 777 591, AFSL 232497) and AMP Capital Funds Management Limited (ABN 15 159 557 721, AFSL 426455) makes no representations or warranties as to the accuracy or completeness of any statement in it including, without limitation, any forecasts. Past performance is not a reliable indicator of future performance. This article has been prepared for the purpose of providing general information, without taking account of any particular investor’s objectives, financial situation or needs. An investor should, before making any investment decisions, consider the appropriateness of the information in this article, and seek professional advice, having regard to the investor’s objectives, financial situation and needs. This article is solely for the use of the party to whom it is provided.
The medium term return potential for major assets – still constrained
Most investment analysis and commentary is focused on the here and now and the implications for investment markets just a little bit ahead. But getting a handle on the return potential for major asset classes over the medium term, ie the next five years or so, is of value from several perspectives. First, such return projections are a critical driver
Read More|
Most investment analysis and commentary is focused on the here and now and the implications for investment markets just a little bit ahead. But getting a handle on the return potential for major asset classes over the medium term, ie the next five years or so, is of value from several perspectives. First, such return projections are a critical driver of the strategic asset allocation (SAA) to each asset class (shares, bonds, property, etc) within traditional diversified investment funds. |
|

Second, and more fundamentally, it gives a great guide to return potential between asset classes, which helps inform asset allocation generally. For example we use medium term return projections as part of our Dynamic Asset Allocation process.
Finally, it can help provide a guide to what sort of returns investors can expect beyond the short term. After a couple of years of double digit returns from shares and balanced growth superannuation funds there may be a temptation to assume we have now returned to a world of ongoing double digit returns. But this could be mistaken if it’s not sustainable.
This note takes a look at the medium term return potential for major asset classes and what that means for investors.
Getting a handle on return potential
The first thing to note is that simply taking a long term average of historical returns for each asset class and using that as a guide may be use, but often offers little guide to their medium term outlook given the significant impact of starting point valuations (eg, if current yields are significantly lower than normal then this will constrain returns relative to any long term norm) and the broad economic environment. Another approach may be to come up with a bunch of themes and start from there. But without a framework in which to place them this can simply lead to a muddle.
So our approach is to go back to basics, recognising firstly that the components of the return flowing from an asset are the yield (or income flow) it provides and capital growth and secondly that the starting point yield is key, ie, the higher the better. Then apply themes around this where relevant. We also prefer to avoid a reliance on forecasting and to keep the analysis as simple as possible. Complicated adjustments can lead to compounding forecasting errors without any value in terms of the broad message.
-
For equities, a simple model of current dividend yields plus trend nominal GDP growth (as a proxy for earnings and capital growth) does a good job of predicting medium term returns. This approach allows for current valuations (which are picked up via the yield) but avoids getting too complicated1. The next chart shows this approach applied to US equities, where it can be seen to broadly track big secular swings in returns.

Source: Thomson Reuters, Global Financial Data, AMP Capital
-
For property, we use current rental yields and likely trend inflation as a proxy for rental and capital growth.
-
For unlisted infrastructure, we use current average yields and capital growth just ahead of inflation.
-
For bonds, the best predictor of future medium term returns is the current five year bond yield. In other words capital growth is zero because if a five year bond is held to maturity its initial yield will be its return.
Medium term return projections
This framework results in the return projections shown in the next table. The second column shows each asset’s current income yield, the third their five year growth potential and the final column their total return potential. Note that:
-
We assume central banks meet their inflation targets over time, eg, 2.5% in Australia and 2% in the US.
-
We allow for forward points in the return projections for global assets based around current market pricing – which adds 1.8% to the return from world equities (Australian interest rates above that in other advanced countries) but detracts 1.9% from emerging equities.
-
The Australian cash rate is assumed to average 3.5% over the next five years. This is one asset where the current yield is of no value in assessing the asset’s medium term return potential because the maturity is so short. So we assume a medium term average. Normally, for cash this would be around a country’s medium term nominal growth rate, but we have made an allowance to adjust for higher than normal bank lending rate margins over the cash rate and higher debt to income ratios which have increased the interest sensitivity of households, and in turn pulled down the neutral cash rate.
-
The Australian equity return adjusted for franking credits (that adds about 1.4% pa) is shown in brackets.

# Current dividend yield for shares, distribution/net rental yields for property and 5 year bond yield for bonds. ^ Includes forward points. * With franking credits added in. Source: AMP Capital
Thematics
Several themes have been reflected in these projections:
-
Low inflation – while inflation worries abound reflecting the quantitative easing programs of the last few years, this is likely to be offset by continued global excess savings and spare capacity along with central banks being mandated to meet inflation targets.
-
Aging populations – resulting in slower labour force growth than seen over the last twenty or so years and a demand for yield bearing assets with less focus on capital growth.
-
Slower household debt accumulation – the surge in household debt growth seen in the decades prior to the GFC looks to have run its course with tougher bank lending standards and more cautious consumer attitudes.
-
The commodity super cycle has turned down – on the back of slower growth in China and increased commodity supply. This will act as a constraint on growth for some emerging markets (eg South America) but benefits commodity user regions (such as Asia, Europe and Japan). It also means the terms of trade has gone from a tailwind for Australian growth and profits to a headwind. To allow for this we have reduced nominal capital growth potential by 0.5% pa for Australian shares.
-
Technological innovation – with its intensified focus on labour saving (eg robotics, 3D printing) it is likely good for productivity and corporate margins but ambiguous for consumer spending.
-
Reinvigorated advanced countries versus emerging markets – while the emerging world still has a higher growth potential (reflecting its lower starting point) it’s likely to be slower over the decade ahead than last decade reflecting a slowdown in economic reforms but at the same time the US, Europe and Japan appear to be reinvigorating themselves after a tough decade (or two in the case of Japan).
-
A multi-polar world – the end of the cold war and the stabilising influence of the US as the dominant power helped drive globalisation and the peace dividend post 1990. Now China’s rise and Russia’s retreat are arguably resulting in a more difficult environment geo-politically.
-
Backtracking on free markets in parts of the world – a greater scepticism of unfettered markets and increased focus on regulation post the GFC.
Most of these will likely have the effect of constraining returns. But not universally so. Technological innovation remains positive for profits and the renaissance in the US, Europe and Japan is very positive.
Observations
Several observations flow from these projections.
-
While advanced countries may have exited a secular bear market, return potential is still constrained. The starting point for returns today is less favourable than when long term bull markets started in bonds and equities in 1982 (with much lower investment yields today) & the thematic backdrop is less favourable. Our medium term return projections imply a 7.7% pa return from a diversified mix of assets. This is well below the 11.9% pa return Australian super funds saw over the 1982-2007 period which was underpinned by the combination of high starting point investment yields and very favourable investment thematics with the shift from high to low inflation, deregulation, easy credit, globalisation, the peace dividend, the IT revolution, favourable demographics and finally for Australia a surge in commodity prices.
-
Sovereign bonds offer low return potential – after a thirty year secular decline in bond yields the combination of very low yields and the risk they will rise resulting in capital loss implies low medium term return potential.
-
Unlisted commercial property & infrastructure continue to come out well reflecting their relatively high yields – but don’t forget their illiquidity.
-
Australian shares stack up well on the basis of yield, but it is hard to beat Asian ex-Japan shares for growth potential and traditional global shares offer improved prospects.
Implications for investors
There are several implications for investors:
-
First, have reasonable return expectations. The world is in far better shape today than at any time since the GFC but don’t expect year after year of double digit returns.
-
Second, asset allocation remains critical reflecting: the relatively constrained medium term return potential; a likely wide range in returns between major asset classes; continued bouts of volatility (eg as extreme monetary policy conditions in the US and elsewhere are eventually unwound); and as the correlation between bonds and equities remains low (in the absence of a common driver like falling inflation provided in the 1980s and 1990s).
-
Third, there is still a case for a bias towards Australian shares, particularly for yield focused investors, but with traditional global shares looking a bit healthier after a long tough patch have a bit more offshore. Asian ex-Japan shares are preferred relative to emerging market shares generally.
-
Fourth, focus on assets providing decent sustainable income as it provides confidence regarding returns. Commercial property, infrastructure, quality yield shares and investment grade credit stack up well here.
Dr Shane Oliver
Head of Investment Strategy and Chief Economist
AMP Capital
1For example, adjustments can be made for: dividend payout ratios (but history shows that retained earnings often don’t lead to higher returns at the country level so the dividend yield is the best guide); the potential for PEs to move to some equilibrium level over time (but this relies on forecasting the equilibrium PE correctly which can be hard and in any case extreme dividend yields send a strong enough valuation signal anyway); and adjusting the earnings/capital growth assumption for some assessment regarding profit margins (but again this has been shown to be very hard to get right at the country level, eg US profit margins have been strengthening for decades and it’s hard to see what will turn this around). So we prefer to keep any reliance on forecasts to a minimum and to keep it simple.
Important note: While every care has been taken in the preparation of this article, AMP Capital Investors Limited (ABN 59 001 777 591, AFSL 232497) and AMP Capital Funds Management Limited (ABN 15 159 557 721, AFSL 426455) makes no representations or warranties as to the accuracy or completeness of any statement in it including, without limitation, any forecasts. Past performance is not a reliable indicator of future performance. This article has been prepared for the purpose of providing general information, without taking account of any particular investor’s objectives, financial situation or needs. An investor should, before making any investment decisions, consider the appropriateness of the information in this article, and seek professional advice, having regard to the investor’s objectives, financial situation and needs. This article is solely for the use of the party to whom it is provided.
Investment outlook after another solid financial year
The past financial year saw another 12 months of strong returns. Returns of around 20% from shares, solid returns from property assets and good returns from bonds saw balanced growth superannuation funds return around 13% on average. This was the second year in a row of double digit gains. By contrast the return from cash was poor and average 12
Read More|
The past financial year saw another 12 months of strong returns. Returns of around 20% from shares, solid returns from property assets and good returns from bonds saw balanced growth superannuation funds return around 13% on average. This was the second year in a row of double digit gains. By contrast the return from cash was poor and average 12 month bank term deposits returned less than 4%. |
|


Source: Thomson Reuters, AMP Capital
As always there has been plenty to fret about, including:
-
The mid 2013 “taper tantrum” in the US, with investors fearing the Fed’s decision to start winding down its quantitative easing program would threaten the US economy and shares;
-
The US Government shutdown and debt default worries in October and the March quarter economic contraction;
-
The slow recovery and deflation worries in Europe;
-
Fears of a sales tax hike driven recession in Japan;
-
Another bout of hard landing worries regarding China centred on the property and shadow banking sectors;
-
Worries about the impact on emerging countries of Fed tapering;
-
Geopolitical worries regarding Syria, Ukraine and Iraq;
-
Ongoing worries as to how Australia will fare as the mining boom fades and whether the May Budget will worsen the economic outlook; and
-
The last six months has seen intensifying concerns that share markets are set for a fall.
But these concerns were offset by a range of factors:
-
A continuing improvement in the global economy;
-
The Fed’s tapering has clearly been contingent on improving growth with a rate hike still a fair way off;
-
Further easing measures by the European Central Bank;
-
Little global economic damage from geopolitical risks;
-
Continuing record monetary stimulus in Japan;
-
A stabilisation in Chinese economic growth helped by various mini-stimulus measures;
-
No sign of capital flight from emerging countries and election optimism regarding India and Indonesia; and
-
Okay growth in Australia helped by low interest rates.
This has all seen growth assets boosted by a reasonable growth and profit outlook and bonds helped by continued easy monetary conditions. The latter has also seen an ongoing search for yield by investors. With shares no longer dirt cheap its likely returns will slow – indeed they have over the last six months. However, the cyclical bull market in shares likely has further to go. This along with reasonable returns from property assets should underpin further gains in diversified investment portfolios over the year ahead.
Equity valuations – ok
After strong gains through 2012 and 2013 shares are no longer dirt cheap. However, as can be seen in the next chart valuation measures (which are based on a range of measures including a comparison of the yield on shares with that on bonds) show shares are not expensive.
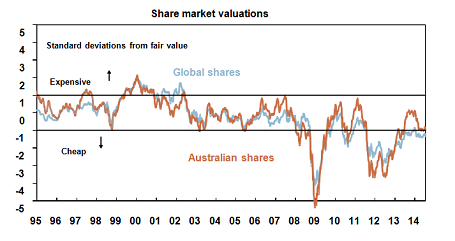
Source: Bloomberg, AMP Capital
Cyclical bull markets in shares invariably see three phases. First an unwinding of cheap valuations helped by low interest rates. The second is driven by stronger profits. And the third phase is a blow off as investor confidence becomes excessive pushing shares into expensive territory. Our assessment is that we are still in the second phase and as such the cyclical/profit backdrop remains critically important.
The economic cycle – slow improvement
We are still in the sweet spot of the global economic cycle. Growth is on the mend but only gradually such that spare capacity and excess savings remains immense so inflation remains tame, monetary conditions easy and bond yields low. In fact the March quarter growth soft patch seen in the US, Europe and China was more positive than negative because it wasn’t threatening but further pushed out the timing of any monetary tightening. By region:
-
After a contraction in the March quarter driven by mostly temporary factors, the US economy is continuing to improve and looks on track for circa 3% growth. The jobs market and business investment are improving and shale oil boom is providing a long term boost both directly and indirectly via cheap electricity costs for business.
-
Growth has returned to Europe. Ireland and Portugal have emerged from their bailout programs and structural reform seems to be on track. But growth is far from robust, inflation too low and uncertainty around the banks is likely to linger till later this year after the completion of the ECB’s bank asset quality review. All of which means continuing recovery but ongoing need for ECB support.
-
Japan appears to be weathering its sales tax hike well, with ultra easy money and economic reforms providing confidence growth will continue.
-
Chinese growth looks to be on track for around 7.5% helped by various mini-stimulus measures.
-
Emerging world growth generally isn’t as strong as it used to be but it looks to be stabilising around 5%.
Reflecting this, the global manufacturing conditions PMI is at levels consistent with good, but not booming global growth.
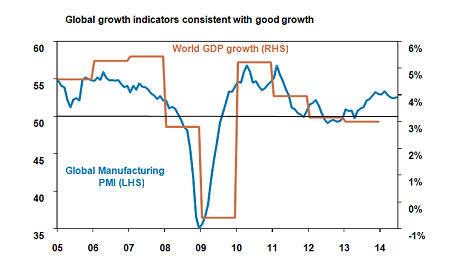
Source: Bloomberg, AMP Capital
This suggests global growth is likely to pick up a notch which should underpin a modest improvement in profit growth.
In Australia, while the mining investment slowdown, the impact on confidence from the May Budget and the too high $A pose a short term threat, underlying growth is likely to have picked up to a 3% pace by year end and continue through next year helped by a housing construction boom, a Senate induced softening in some of the harsher aspects of the Budget and strength in resource export volumes.
Monetary conditions to remain easy
When the Fed will start to raise interest rates and reverse its QE program has been a constant source of speculation. While such speculation may intensify over the next six months – resulting in bouts of volatility for investment markets – global monetary conditions are set to remain easy:
-
The tightening US jobs market indicates the first rate hike in the US is coming on to the horizon. But continuing high levels of excess capacity indicate it may still be 9-12 months away and will be a gradual process when it starts. In other words it will take a long time before US monetary policy is tight – with above “normal” interest rates and short term rates being above long term rates.
-
The ECB has only just eased monetary policy and has signalled it stands ready to do more, including via a quantitative easing program, if deflation risks don’t recede. Rate hikes are well over the horizon.
-
Unprecedented quantitative easing in Japan will continue until underlying inflation is firmly ensconced around 2% and there is still a way to go. Rate hikes are not in sight.
-
In Australia, the RBA is not expected to start raising rates till sometime next year. And as the Fed is likely to go first, the Australian dollar is likely to resume its downtrend.
While there will be a few bumps regarding the Fed (just like last year’s taper tantrum) the monetary backdrop is set to remain supportive for investment markets.
Investor sentiment a long way from excessive
We remain a long way from the sort of investor exuberance seen at major share market tops. It seems everyone is talking about share market corrections and crashes and tail risk hedging seems all the rage. In the US the mountain of money built up in bond funds during the post GFC “irrational exuberance for safety” has yet to really reverse.

Source: ICI, AMP Capital
And in Australia, the amount of cash sitting in the superannuation system is still double average levels seen prior to the GFC and Australians continue to prefer bank deposits and paying down debt to shares and superannuation. There is still a lot of money that can come into equity markets as confidence improves.

Source: Westpac/Melb Institute, AMP Capital
Concluding comments
After a bout of relatively smooth sailing there will inevitably be a correction at some point. There are plenty of possible triggers: geopolitical risks, the risk of an inflation/Fed rate hike scare, deflation in Europe, the property slowdown in China and in Australia the transition to more broad based growth. However, while investment returns are likely to slow, still reasonable share valuations, gradually improving economic conditions, easy monetary conditions and a lack of excessive optimism suggest further decent investment returns ahead.
Dr Shane Oliver
Head of Investment Strategy and Chief Economist
AMP Capital
Important note: While every care has been taken in the preparation of this article, AMP Capital Investors Limited (ABN 59 001 777 591, AFSL 232497) and AMP Capital Funds Management Limited (ABN 15 159 557 721, AFSL 426455) makes no representations or warranties as to the accuracy or completeness of any statement in it including, without limitation, any forecasts. Past performance is not a reliable indicator of future performance. This article has been prepared for the purpose of providing general information, without taking account of any particular investor’s objectives, financial situation or needs. An investor should, before making any investment decisions, consider the appropriateness of the information in this article, and seek professional advice, having regard to the investor’s objectives, financial situation and needs. This article is solely for the use of the party to whom it is provided.
The power of compound interest – an investor’s best friend
I reckon the first wonder of the investment world is the power of compound interest. My good friend Dr Don Stammer even goes so far to refer to it as the “magic” of compound interest because it almost is magical. Compound interest can be the worst nightmare of a borrower as interest gets charged on interest if it is not
Read More|
I reckon the first wonder of the investment world is the power of compound interest. My good friend Dr Don Stammer even goes so far to refer to it as the “magic” of compound interest because it almost is magical. Compound interest can be the worst nightmare of a borrower as interest gets charged on interest if it is not regularly serviced. But it’s the best friend of investors. Unfortunately for a variety of reasons some miss out on it. |
|

Compound interest – what is it?
But what is it and why is it so powerful? Compound interest is simply the concept of earning interest on interest. Or more broadly, getting a return on past returns. In other words any interest or return earned in one period is added to the original investment so that it all earns interest or a return in the next period. And so on. Its best demonstrated by some examples.
-
Suppose an investor invests $500 at the start of each year for 20 years and receives a 3% annual return. See Case A in the next table. After 20 years the investment will have increased to $13,838, for a total outlay (or $ Flow in the table) of $10,000. Nice, but hardly exciting as the return was only low at 3% pa.
-
But if the investor put the same flow of money in an asset returning 7% a year, after 20 years it will have grown to $21,933. See Case B. Not bad given the same total outlay of $10,000. And in year 20, annual investment earnings are now $1435, more than three and a half times the investment earnings in the same year in Case A of $403.
-
Finally, if the whole process was kicked off by a $2000 investment at the start of the first year, with $500 each year thereafter and still earning 7% per annum then after 20 years it will have grown to $27,737. Case C. By year 20 in this case the annual investment earnings will have increased to $1815.
These examples have been kept relatively simple in order to illustrate how compounding works. Obviously all sorts of complications can affect the final outcome including inflation (which would boost the results as the table uses relatively low returns for both the low and high risk asset), allowance for the more frequent compounding which actually occurs in investment markets as opposed to annual compounding in the table (which would also boost the final outcome) and the timing of the return from the high growth asset through time in that it won’t be a steady 7% year after year.

Source: AMP Capital
However, the power of compound interest is clear. From these examples, it is evident that it has three key drivers:
-
The rate of return – the higher the better.
-
The contribution – the bigger the better because it means there is more for returns to compound on. The $2000 upfront contribution in Case C boosted the outcome after 20 years by an extra $5804 compared to Case B. Not bad for just an extra $1500 investment.
-
Time – the longer the better because it means the longer the compounding process of earning returns on returns has to run. Time will also help smooth out any year to year volatility in returns. After 40 years the investment strategy in Case A will have grown to $38,832 but Case B will have grown to $106,805 and Case C will have grown to $129,267.
Compound interest in practice
This all sounds fine in theory, but does it really work in practice? It’s well-known that growth assets like shares and property provide higher returns than defensive assets like cash and bonds over long periods of time. This is because their growth potential results in higher returns over long periods of time which compensates for their higher volatility compared to more stable and less risky assets.
The next chart is my favourite demonstration of the power of compound interest in action for investors. It shows the value of $1 invested in 1900 in Australian cash, bonds and shares with earnings on each asset reinvested along the way. Since 1900 cash has returned 4.8% per annum, bonds have returned 6% pa and shares returned 11.9% pa.

Source: Global Financial Data, AMP Capital
Shares are clearly more volatile than cash and bonds. The arrows in the chart show periodic, often long bear markets in shares. However, the compounding effect of their higher returns over time results in much higher wealth accumulation from them. Although the return from shares is only double that of bonds, over 114 years the $1 invested in 1900 will have grown to $398,420 today, whereas the $1 investment in bonds will only be worth $750 and that in cash just $204.
Now of course, investors don’t (usually) have 114 years. But the next chart shows rolling 20 year returns from Australian shares, bonds and cash and it’s evident that shares have invariably outperformed cash and bonds over such a period.

Source: Global Financial Data, AMP Capital
Note that while the return gap between shares on the one hand and bonds and cash on the other has narrowed over the last 20 years this reflects the relatively high interest rates and bond yields of 20-30 years ago, which provided a springboard to relatively high returns from such assets. With bond yields and interest rates now very low such bond and cash returns are very unlikely to be repeated in the decade or so ahead.
Some issues
What about property? Over long periods of time Australian residential property has generated similar total returns (ie capital growth plus income) for Australian investors as Australian equities. For example since 1926 Australian residential property has returned 11.1% pa, which is similar to the 11.5% pa return from shares over the same period.
What about fees? Fees on managed investment products will clearly reduce returns over time, but less so for cash and fixed income products and for equities the fee impact will be offset by the impact of franking credits in the case of Australian shares (which amount to around 1.3% pa) and which has not been allowed for in the last two charts.
Are these returns sustainable going forward? This is really a separate topic, but the historical returns from the three assets likely all exaggerate their future medium term return potential. Cash rates and bank term deposit rates are likely to hover around 3-4%, current ten year bond yields around 3.4% suggest pretty low bond returns for the decade ahead (in fact just 3.4% for an investor who buys a ten year bond and holds it to maturity). And the Australian equity return may be closer to 9% pa, reflecting a dividend yield around 4.5% and capital growth of around 4.5%. But for shares this sort of return is still not bad and leaves in place significant potential for investors to reap rewards from the power of compounding over the long term.
Why investors often miss out
But if the power of compound interest is so obvious, what can cause investors to miss out. There are several reasons:
-
First investors may be too conservative in their investment strategy, opting for lower returning defensive assets like cash or bank term deposits. This may avoid short term volatility but won’t build wealth over the long term if that’s the objective.
-
Second, they leave it too late to start contributing to an investment portfolio or don’t contribute much initially. This makes it more difficult to catch up in later life and leaves investors more at the whim of financial market fluctuations during the catch up phase. Fortunately the Australian superannuation system forces Australian’s to start early in life, albeit the contribution rate is too low.
-
Third, they can adopt the right strategy to benefit from compound interest over the long term only to get thrown off during a bout of market volatility. This usually occurs after a steep slump in investment markets and sees the investor switch to cash only to return, if at all, after the market has already had a good recovery.
-
Finally, some investors have been sucked in over the years by promises of a “free lunch”, eg the 10% pa yield funds that were floating around prior to the GFC which then ran into trouble once the GFC hit and proved to be more risky than equities.
Implications for investors
There are several implications for investors looking to take advantage of the power of compound interest.
First, if you can take a long term approach, focus on growth assets like shares and property with a long term track record.
Second, start contributing to your investment portfolio as much as you can as early as possible.
Third, find a way to manage cyclical swings. For example, invest a bit of time in understanding that the investment cycle is a normal part of investment markets and partly explains why growth assets have a higher return in the first place. Or invest in funds that undertake dynamic asset allocation to help manage the investment cycle. Or both.
Finally, if an investment sounds too good to be true – implying some sort of free lunch – and/or you can’t understand it, then stay away.
Dr Shane Oliver
Head of Investment Strategy and Chief Economist
AMP Capital
Important note: While every care has been taken in the preparation of this article, AMP Capital Investors Limited (ABN 59 001 777 591, AFSL 232497) and AMP Capital Funds Management Limited (ABN 15 159 557 721, AFSL 426455) makes no representations or warranties as to the accuracy or completeness of any statement in it including, without limitation, any forecasts. Past performance is not a reliable indicator of future performance. This article has been prepared for the purpose of providing general information, without taking account of any particular investor’s objectives, financial situation or needs. An investor should, before making any investment decisions, consider the appropriateness of the information in this article, and seek professional advice, having regard to the investor’s objectives, financial situation and needs. This article is solely for the use of the party to whom it is provided.
Abenomics: good for Japan, good for investors and good for Australia
It’s now over 18 months since Japan embarked on a program designed to reinvigorate its economy under Prime Minister Shinzo Abe, which has become known as “Abenomics”. Growth has rebounded, deflation has given way to inflation and Japanese shares are up around 70%. But is Abenomics working or are we just seeing another cyclical bounce? And what does it mean
Read More|
It’s now over 18 months since Japan embarked on a program designed to reinvigorate its economy under Prime Minister Shinzo Abe, which has become known as “Abenomics”. Growth has rebounded, deflation has given way to inflation and Japanese shares are up around 70%. But is Abenomics working or are we just seeing another cyclical bounce? And what does it mean for investors? |
|

Three arrows
Since the Japanese bubble economy burst at the end of the 1980s, it has wallowed with sub-par growth, six recessions, chronic deflation and a secular bear market in shares and property. Many reasons have been given: a failure to realise how serious the problem was; a conservative approach to policy making; a focus by the dominant Liberal Democratic Party on protecting special interests; revolving door political leadership with 16 prime ministers since 1990; and a declining population. Regardless of the drivers, Shinzo Abe and the LDP were elected with a mandate to fix up Japan in December 2012 and with voters giving him control of the upper house of the Diet, Japan’s parliament, in July 2013.
Abe is both an economic rationalist and a Japanese nationalist. A key motivation is likely his desire to see Japan’s regional standing strengthened in the face of China’s rise and North Korean threats. He has acted very decisively. His policy response has been characterised by “Three Arrows”: fiscal stimulus, monetary stimulus and supply side economic reforms. All with the aim of boosting inflation to 2% pa and real economic growth to 2% pa.
Given Japan’s large public debt, any fiscal stimulus has to be modest and supply side reforms always take time so the initial focus has been on monetary stimulus. On this front, the approach has been very aggressive with the Bank of Japan announcing a 2% inflation target in January last year, Abe appointing ultra dove Haruhiko Kuroda as central bank governor and the BoJ announcing a massive quantitative easing program (pumping cash into the economy by purchasing $US75bn/month of assets using printed money) in April last year. Adjusted for the size of the economy this was more than double the size of the Fed’s then quantitative easing program and with the latter being reduced now swamps it. The program has seen the Yen fall by 21%.
The initial response has been positive with the economy growing 3% over the year to the March quarter and inflation (ex the impact of an April 1 sales tax hike) running at 2.2%. But concerns remain: that the sales tax hike from 5% to 8% will drive a slide back into recession as the last sales tax hike in 1997 arguably did; that boosting inflation has only led to a fall in real wages; that the BoJ’s success in achieving sustained inflation will depend on the Yen continuing to fall; that Japan’s poor fiscal position dooms it long term; and that the Government has not delivered enough in terms of the third arrow reforms. Let’s look at each of these in turn.
Japan weathering the sales tax hike well
A return to recession as followed the 1997 sales tax hike is unlikely because unlike in 1997 Japan now has quantitative easing, unemployment is falling, property prices are rising, bank lending is rising, banks now have small non-performing loans and business confidence has been rising.

Source: Bloomberg, AMP Capital
A range of indicators have bounced back solidly from their recent sales tax related fall:
-
The Economy Watchers outlook index is up strongly;

Source: Bloomberg, AMP Capital
-
The outlook components of the BoJ’s Tankan survey are strong and business investment plans have improved;
-
The unemployment rate has fallen to 3.5%, its lowest since 1997, and the ratio of job vacancies to applicants is at its highest since 1992.

Source: Bloomberg, AMP Capital
-
While overall household spending remains weak after the tax hike, retail sales rose solidly in May.
The overall impression is that the Japanese economy has weathered the sales tax hike reasonably well and that a rerun of the 1997 experience is unlikely.
Ending deflation is key
Rising real wages, when inflation was negative, didn’t exactly help Japan. Rather, deflation was the much bigger problem because it zaps spending – why spend or invest today when you know it will be cheaper tomorrow? The key was to first end deflation and institute an inflationary mindset and Japan has done this with the introduction of a 2% inflation target for the BoJ and backing this up with unprecedented monetary printing. Inflationary expectations are now starting to rise in response and with the labour market stating to look tight wages growth is likely to pick up. Large firms already seem to be starting to put through faster wage increases.
More domestic focus going forward
The decline in the Yen was clearly important in initially driving inflation higher. Our assessment is that a further decline in the Yen is likely – as the BoJ’s huge money printing program, which likely won’t be increased but will be extended beyond its two year timeframe, and the Fed’s taper means that the supply of Yen is rising relative to the supply of US dollars. However, with an inflationary mentality starting to become more entrenched a falling Yen won’t be as important in driving Japanese inflation going forward. In fact this is evident in a breakdown in the negative correlation between the Japanese shares and the Yen recently.
Japan’s fiscal problems bad, but not that bad
Japan’s public debt looks horrible with gross public debt of 244% of GDP (compared to just 31% in Australia!). However, it’s not nearly as bad as it looks. First, its gross public debt of 244% of GDP falls back to 137% once assets such as Japan’s foreign exchange reserves are allowed for. Second, Japan borrows from itself, with public borrowing being a mirror image of private sector savings. Thirdly, various reforms over the last decade will limit growth in pension and health spending. Fourthly, tax as a share of GDP is low by OECD standards in Japan and there is plenty of scope to further increase the sales tax rate from 8%. Finally, while some fret that rising bond yields will blow out Japan’s interest bill this won’t be a problem if the back up in yields reflects stronger growth & inflation as it will mean higher tax revenue.
Third arrow reforms are being understated
A critique of Abe seems to be that he has been lax in delivering “third arrow” reforms. But several points are worth noting. First, it was always second order. Japan’s problem is a lack of demand not supply, as evident in falling prices. And supply side reforms often make things worse before they get better. So it was right to first focus on reflation.
Second, Japan’s third arrow reforms may seem more like a “thousand needles” but they are adding up. A range of reforms have been announced in recent months, eg easing visa requirements, cuts to rice subsidies and eased factory regulations. On top of this the Government has released its “New Growth Strategy” which includes a range of measures including a plan to cut the corporate tax rate from currently 36% to in the 20-30% range, measures to boost female workforce participation and measures to allow more foreign workers in certain sectors. These are all far reaching and while one “big bang” reform should not be expected the gradualist “thousand needle” approach is very positive. For example, the cut to Japan's corporate tax rate could boost Japanese earnings per share by between 10 to 30 percentage points over the next 4 years.
Finally, Abe’s huge popularity, stable Government, control of both Diet houses and fading resistance to reform – e.g. farmers, who have been strong resisters of allowing a more efficient agricultural sector, now have an average age of 70 – means the reforms have a strong chance of success.
Good reason for optimism on Japan
Japan will not grow as fast as China as it is already a rich country and the success of Abenomics should not be judged mechanically by the 2% inflation and growth targets (as they are just lights on a hill). But when assessed broadly there are good reasons to believe Japan is throwing off the malaise of stop start growth and deflation seen over the last 20 years: the BoJ is doing all the right thinks to entrench inflation, the longer term reforms it is introducing are broad based and Abe appears to have the support required to deliver.
Implications for investors
There are two major implications for investors. First, a reinvigorated Japan is positive for Japanese shares. After a 57% gain last year, Japanese shares had become overbought and due for a correction, which is what we have seen this year with a 15% fall into April. Having worked off the excess, Japanese shares are now attractive again. While the boost to Japan’s economy and share market last year was driven more by monetary easing, economic reform looks likely to be a major driver over the longer term.
Second, Japan is still the world’s third largest economy, so stronger more sustainable growth in Japan is positive for the global economy at a time when Europe is gradually recovering and the pace of growth in the US is picking up. This in turn is positive for global shares generally.
Japan and Australia
Japan takes 16% of Australia's exports and is our second largest export market, so a continuing exit from deflation and stronger growth in Japan is positive for Australia. This also comes at a time when a free trade deal with Japan is being signed. While the trade deal does not change the near term growth outlook for either country, its benefits will accrue over time. The main beneficiaries are beef and dairy farmers, service industries (such as finance) and consumers as tariffs on imported cars, household and electronic goods from Japan fall to zero.
Dr Shane Oliver
Head of Investment Strategy and Chief Economist
AMP Capital
Important note: While every care has been taken in the preparation of this article, AMP Capital Investors Limited (ABN 59 001 777 591, AFSL 232497) and AMP Capital Funds Management Limited (ABN 15 159 557 721, AFSL 426455) makes no representations or warranties as to the accuracy or completeness of any statement in it including, without limitation, any forecasts. Past performance is not a reliable indicator of future performance. This article has been prepared for the purpose of providing general information, without taking account of any particular investor’s objectives, financial situation or needs. An investor should, before making any investment decisions, consider the appropriateness of the information in this article, and seek professional advice, having regard to the investor’s objectives, financial situation and needs. This article is solely for the use of the party to whom it is provided.
Share market risks
As we approach mid-year it’s worth reviewing the outlook for shares particularly with numerous warnings of corrections and crashes. Our view for this year has been that share market gains would be positive, but more constrained than seen in the last two years, and that volatility would increase – including the likelihood of a 10-15% correction along the wPhase 1
Read More|
As we approach mid-year it’s worth reviewing the outlook for shares particularly with numerous warnings of corrections and crashes. Our view for this year has been that share market gains would be positive, but more constrained than seen in the last two years, and that volatility would increase – including the likelihood of a 10-15% correction along the wPhase 1 is driven by an unwindingay. In the event gains in shares have been more constrained, with global shares (in local currency terms) up 4.5% year to date and Australian shares up 1.5%. However, volatility has been relatively low. |
|

Most concerns regarding the share market outlook relate to US shares. It invariably sets the direction for global share markets including Australia’s but many contend that at record highs it is overvalued and at risk of a crash.
Common concerns about US shares
There seem to be three commonly expressed concerns regarding US shares: record highs, valuations and complacency. Looking at each of these in turn: US shares are at record highs. Does this mean they are due for a bust? The following chart shows the US S&P 500 since 1990. It broke out to record highs last year and is now up 190% from its Global Financial Crisis (GFC) low in 2009.

Source: Bloomberg, AMP Capital
However, just because US shares are at a record high does not mean a crash is on the way. The breakout seen last year came after a 13 year secular bear market, which saw US shares stuck in a huge range. Our assessment is that US shares have entered a new secular bull market helped by a range of factors including an energy boom, a manufacturing renaissance and a return to better health for US debt measures. And as can be seen in the chart the surge in the share market has been supported by a surge in profits to record levels.
Are US shares way overvalued? Proponents of this view typically cite the following:
-
the ratio of share prices to the 10-year moving average of earnings (Shiller PE) is well above its long-term average;
-
the overvaluation is even worse if allowance is made for higher than average profit margins; and
-
the ratio of the market value of US listed company capital to its replacement cost (called Tobin’s Q) is well above its long-term average implying share prices have been pushed beyond levels justified by their asset base.
To be sure, these are valid concerns but while such valuation measures are useful they need to be treated with caution.
-
While the Shiller PE (next chart) at 23 times is well above its long-term average since 1881 of 16, the equilibrium PE has likely risen since the 1800s. During the last 100 years, shares have become easier and cheaper to trade and it’s become easier to assemble a well diversified portfolio, all of which has likely seen the equilibrium PE rise. On this basis, it’s noteworthy that the Shiller PE is only marginally above its long-term rising trend suggesting US shares are not particularly overvalued.

Source: AMP Capital
-
In a world of very low inflation, interest rates and bond yields, earnings yields on shares should be lower & price to earnings multiples higher than longer-term averages.
-
Although US profit margins are high, they have been high for a long time and attempts to forecast their return to some long-run average have failed. It’s debatable what the normal level should be and with falling capital prices and with a global supply of cheap labour it’s hard to know what will cause profit margins to fall.
-
Finally, there is reason to be sceptical of Tobin’s Q as it does not allow for a world where corporate capital is increasingly dominated by intellectual capital as opposed to physical capital.
Is the decline in volatility a major concern? The next chart shows the VIX index, which is a guide to expected volatility in the US share market implied by options.

Source: Bloomberg, AMP Capital
It is clearly very low and is consistent with the US share market having traded in a relatively narrow rising trend since mid-2012. There hasn’t been a 10% or more correction in US shares since mid-2012. In many ways this is a good thing. It is far better than the extreme volatility seen through the GFC and its aftermath and worrying about it is perhaps a bit like worrying that there is nothing to worry about! The concern, though, is that periods of low volatility can lead to a false sense of investor security and excessive risk taking, eg using high levels of gearing to buy overvalued assets.
However, the low level of volatility is arguably a rational reaction to the more stable macro-economic environment seen in more recent times. It is doubtful that risk taking has reached the extremes seen at previous major market tops and, as the 2004-07 period showed, volatility can remain at very low levels for a long time before it runs its course.
Broad cycle view
More generally, our view remains it’s too early in the investment cycle to expect a new bear market or crash. The normal play out for a cyclical bull market is as follows.
-
Phase 1 is driven by an unwinding of very cheap valuations helped by easy monetary conditions as smart investors start to snap up undervalued shares as investor sentiment moves from pessimism to scepticism.
-
Phase 2 is driven by strengthening profits. This is the part of the cycle where optimism starts to creep in.
-
Phase 3 sees euphoria with investors pushing cash flows into shares to extremes. The combination of tight monetary conditions, overvaluation and investor euphoria then sets the scene for a new bear market.
Our assessment remains that we are still in Phase 2. We still don’t see the signs of euphoria that become evident in Phase 3 as precursors to a new bear market.
- Price to earnings ratios based on forward earnings are around or below their averages seen during the low inflation era seen since the early 1990s.

Source: Thomson Reuters; AMP Capital
The gap between earnings yields and bond yields, a proxy for the excess return shares offer, remains above pre-GFC norms. This is reflected in our preferred valuation indicators, which show markets slightly cheap.

Source: Bloomberg, AMP Capital
-
Global economic indicators have been gradually heading higher, which should be supportive of earnings growth. US growth is rebounding from its March quarter soft patch, Japan seems to be weathering its April sales tax hike pretty well, European growth remains slow but atleast it is continuing and Chinese growth appears to have bottomed after slowing earlier this year with various ministimulus measures helping.
In Australia, a likely softening of some of the measures in the Federal Budget to allow it to pass through the Senate combined with continuing low interest rates, strong housing construction activity and strong resource export volumes should see the economy back on track by year end.
-
Global and Australian monetary policy remains easy and is likely to remain so for some time yet.
-
Finally, there is no sign of the investor exuberance usually seen at major market tops. Various surveys show that investor scepticism towards shares remains high. The mountain of money that built up in bond funds in the US has yet to fully reverse. In Australia, investors still prefer bank deposits over shares and the share of cash in the superannuation system remains double pre-GFC levels.
Concluding comments
None of this rules out a short term correction in shares and a return to more volatility. Numerous possible triggers for a correction exist including: a continued run of stronger US economic data raising concerns about an earlier Fed rate hike; risks around Ukraine and Iraq; maybe a return of worries about Europe on the back of European Central Bank bank stress tests and independence referendums later this year in Scotland and (possibly) Catalonia. And in Australia, we need to see confidence levels pick up. However, we still seem a fair way from a major market top in shares. As such, the cyclical bull market in shares likely has further to go. Our year-end target for the ASX 200 remains 5800.
Dr Shane Oliver
Head of Investment Strategy and Chief Economist
AMP Capital
Important note: While every care has been taken in the preparation of this article, AMP Capital Investors Limited (ABN 59 001 777 591, AFSL 232497) and AMP Capital Funds Management Limited (ABN 15 159 557 721, AFSL 426455) makes no representations or warranties as to the accuracy or completeness of any statement in it including, without limitation, any forecasts. Past performance is not a reliable indicator of future performance. This article has been prepared for the purpose of providing general information, without taking account of any particular investor’s objectives, financial situation or needs. An investor should, before making any investment decisions, consider the appropriateness of the information in this article, and seek professional advice, having regard to the investor’s objectives, financial situation and needs. This article is solely for the use of the party to whom it is provided.

