Provision Newsletter
Putting the global “debt bomb” in perspective – seven reasons to be alert but not alarmed
Here’s my forecast: “The global economy is going to have a significant downturn and record levels of debt are going to make it worse.” Sound scary enough? Put it in the headline and I can be assured of lots of clicks! I might even be called a deep thinker! The problem is that there is nothing new or profound in
Read MoreHere’s my forecast: “The global economy is going to have a significant downturn and record levels of debt are going to make it worse.” Sound scary enough? Put it in the headline and I can be assured of lots of clicks! I might even be called a deep thinker! The problem is that there is nothing new or profound in this. A significant economic downturn is inevitable at some point (it’s just the economic cycle), debt problems are involved in most economic downturns and such calls are a dime a dozen.

A standard scare now is that memories of the role of excessive debt in contributing to the GFC have worn thin and total global debt has pushed up to a new record high of over $US200 trillion – thanks largely to public debt in developed countries (with more to come in the US as Trump’s fiscal stimulus rolls out), Chinese debt and corporate debt (and household debt in Australia of course). Also, that its implosion is imminent and inevitable as interest rates normalise and that any attempt to prevent or soften the coming day of reckoning will just delay it or simply won’t work. However, in reality it’s a lot more complicated than this. This note looks at the main issues.
Global debt – how big is it and who has it?
Total gross world public and private debt is around $US171 trillion. Adding in financial sector debt pushes this over $US200 trillion but that results in double counting. Either way it’s a big and scary number. But it needs to be compared to something to have any meaning or context. A first point of comparison is income or GDP at an economy wide level. And even here new records have been reached with gross world public and private non-financial debt rising to a record of 233% of global GDP in 2016, although its fallen fractionally to 231% since. See the next chart.

Source: IMF, Haver Analytics, BIS, Ned Davis Research, AMP Capital
The next table compares total debt for various countries.

Source: IMF, Haver Analytics, BIS, Ned Davis Research, AMP Capital
The next chart shows a comparison of developed world (DM) and emerging world (EM) debt – both public and private.

Source: Haver Analytics, BIS, Ned Davis Research, AMP Capital
It can be seen that the rise in debt relative to GDP since the GFC owes to rising public debt in the developed world and rising private debt in the emerging world. Within developed countries a rise in corporate debt relative to GDP has been offset by a fall in household debt, so private debt to GDP has actually gone down slightly. And a rapid rise Chinese debt (particularly corporate) has played a role in the emerging world.
Of course, it needs to be mentioned that measures of gross debt exaggerate the total level of debt. For example, because of government holdings of debt instruments via sovereign wealth funds, central bank reserves, etc, net public debt is usually well below gross debt. In Norway net public debt is -91% of GDP and in Japan it’s 153% of GDP. But as an overview:
-
Japan, Belgium, Canada, Portugal and Greece have relatively high total debt levels;
-
Germany, Brazil, India and Russia have relatively low debt;
-
Australia does not rank highly in total debt – it has world-beating household debt but low public & corporate debt;
-
Emerging countries tend to have relatively lower debt, but rising private debt needs to be allowed for particularly in China, where corporate debt is high relative to GDP.
The bottom line is that global debt is at record levels even relative to GDP so it’s understandable there is angst about it.
Seven reasons not to be too alarmed about record debt
However, there are seven reasons not to be too alarmed by the rise in debt to record levels.
First, the level of debt has been trending up ever since debt was invented. This partly reflects greater ease of access to debt over time. So that it has reached record levels does not necessarily mean it’s a debt bomb about to explode.
Second, comparing debt and income is a bit like comparing apples and oranges because debt is a stock while income is a flow. Suppose an economy starts with $100 of debt and $100 in assets and in year 1 produces $100 of income and each year it grows 5%, consumes 80% of its income and saves 20% which is recycled as debt and invested in assets. How debt, debt to income & debt to assets evolves can be seen in the next table.
Debt ratios over time
Source: AMP Capital
At the end of year 1 its debt to income ratio will be 120%, but by the end of year 5 it will be 173%. But assuming its assets rise in line with debt its debt to asset ratio will remain flat at 100%. So the very act of saving and investing creates debt and {% rising debt to income ratios. 1 China is a classic example of this where it borrows from itself. It saves 46% of GDP and this saving is largely recycled through banks and results in strong debt growth. But this is largely matched by an expansion in productive assets. The solution is to spend more, save less and recycle more of its savings via investments like equity.
Third, the rapid rise in private debt in the emerging world is not as concerning as they have a higher growth potential than developed countries. Of course, the main problem emerging countries face is that they borrow a lot in US dollars and either a sharp rise in the $US or a loss of confidence by foreign investors causes a problem. This has started to be a concern lately as the $US is up 7% from its low earlier this year.
Fourth, debt interest burdens are low and in many cases falling as more expensive, long maturity, older debt rolls off. And given the long maturity of much debt in advanced countries it will take time for higher bond yields to feed through to interest payments. In Australia, interest payments as a share of household disposable income are at their lowest since 2003, and are down by a third from their 2008 high. There is no sign of significant debt servicing problems globally or in Australia.
Fifth, most of the post GFC debt increase in developed countries has come from public debt & governments can tax and print money. Japan is most at risk here given its high level of public debt, but borrows from itself. And even if Japanese interest rates rise sharply (which is unlikely with the BoJ keeping zero 10-year bond yields with little sign of a rise) 40% of Japanese Government bonds are held by the BoJ so higher interest payments will simply go back to the Government.
Sixth, while global interest rates may have bottomed, the move higher is very gradual as seen with the Fed and the ECB, Bank of Japan and RBA are all a long way from raising rates. What’s more, central banks know that with higher debt to income ratios they don’t need to raise rates as much to have an impact on inflation or growth as in the past.
Finally, debt alone is rarely the source of a shock to economies. Broader signs of excess such as overinvestment, rapid broad-based gains in asset prices and surging inflation and interest rates are usually required and these aren’t evident on a generalised basis. But these are the things to watch for.
Concluding comment
History tells us that the next major crisis will involve debt problems of some sort. But just because global debt is at record levels and that global interest rates and bond yields have bottomed does not mean a crisis is imminent. For investors, debt levels are something to remain alert too – but in the absence of excess in the form of booming investment levels, surging inflation and much higher interest rates, for example, there is no need to be alarmed just yet.
1.↩ [My favourite example of the complex relationships between income, saving and debt came from Bank Credit Analyst Research. Suppose there is an island with 100 people, each making 100 coconuts a year. Here’s three possibilities.
Case 1: Output is 10,000 coconuts with each person consuming 100. Saving and investment are zero and no debt is created.
Case 2: Each person consumes only 75 coconuts a year, selling the remainder to a plantation who buys them with a bank loan and plants them resulting in 2500 new coconut trees. Consumption is 7500 coconuts. Savings and investment are 2500 and debt has gone up by 2500 coconuts.
Case 3: Each person consumes 125 coconuts, by importing 25 each from foreign islands. Consumption is now 12,500 coconuts, savings is -2500 coconuts, investment is zero and the current account deficit is 2500. External debt goes up by 2500. This gets risky if the other islands want their coconuts back!
So debt can rise even if an economy lives within its means & invests for the future. ]↩
Source: AMP Capital 19 June 2018
Important note: While every care has been taken in the preparation of this article, AMP Capital Investors Limited (ABN 59 001 777 591, AFSL 232497) and AMP Capital Funds Management Limited (ABN 15 159 557 721, AFSL 426455) makes no representations or warranties as to the accuracy or completeness of any statement in it including, without limitation, any forecasts. Past performance is not a reliable indicator of future performance. This article has been prepared for the purpose of providing general information, without taking account of any particular investor’s objectives, financial situation or needs. An investor should, before making any investment decisions, consider the appropriateness of the information in this article, and seek professional advice, having regard to the investor’s objectives, financial situation and needs. This article is solely for the use of the party to whom it is provided.
Staring At A Screen All Day? Here Are 3 Things You Can Do To Protect Your Eyes
Our eyes are pretty amazing organs. We get to witness the outside world with them. Every day they are exposed to constant stimulation yet continue to work efficiently, for most of us.
The thing is, the stimulus that we are exposing our eyes to has changed drastically over the years. We are now in a digital age – A time where
Read MoreOur eyes are pretty amazing organs. We get to witness the outside world with them. Every day they are exposed to constant stimulation yet continue to work efficiently, for most of us.
The thing is, the stimulus that we are exposing our eyes to has changed drastically over the years. We are now in a digital age – A time where our digital screen time and lifestyle is slowing down our eye’s efficiency due to continuous stress on the eyes. One of the most common stressors to eye strain, blue light!
Visible light is defined by how long the wavelengths are and how much energy is produced. The longer the wavelength, the less energy is produced (safer), and the shorter the wavelength, the more energy is produced (potentially dangerous).
Here’s a quick breakdown on red light vs blue light:
-
Red light, like from a heating lamp, is an example of a long-wavelength, low-energy light.
-
Blue light, from digital devices like computer screens, phones, and TVs has the shortest wavelengths and is, therefore, the highest energy. Blue light is damaging to the eyes because, unlike other UV rays that are blocked by the cornea and the lens, virtually all visible blue light passes through and goes straight to the light-sensitive retina, causing damage that can lead to degenerative conditions and vision loss.
Naturally, we are exposed to small amounts of blue light from sunlight during the day, the damage comes when we have excessive exposure in front of electronic devices, especially at nighttime, which emits significant amounts of blue light. Staring at a screen for long periods of time can cause eye fatigue and other symptoms such as eyestrain, dry eyes, headache, fatigue, blurred vision, and difficulty focusing and sleeping.
A Harvard Medical School study found that blue light exposure at night suppressed melatonin production for about twice as long as the green light and shifted circadian rhythms by twice as much.
OK, we get it, there are 101 things you need to remember to do daily to maintain your health, and now you’ve got to think about how much time you’re spending staring at your screens? Before you panic, we want you to know there are some really simple things you can do to prevent the damage. Here’s how you can start:

1. Eat Foods For Eye Health
We love the saying “you are what you eat”! Some of the best foods you can include in your diet for eye health include:
-
Dark Leafy Greens: The carotenoids lutein and zeaxanthin are primarily found in green leafy vegetables, with kale and spinach topping the list of lutein-rich foods. Other healthy options include Swiss chard, collard greens, broccoli, and Brussels sprouts. Lutein and zeaxanthin are both important nutrients for eye health, as both of them are found in high concentrations in your macula — the small central part of your retina responsible for detailed central vision.
-
Orange Fruit & Vegetables: Think carrots, pumpkin, oranges and sweet potato. Eating a variety of these is going to give your body the nutrients it needs to maintain healthy eyesight. This is largely due to the high amounts of vitamin A, phytonutrients, vitamin C, lutein & zeaxanthin.
-
Healthy Fats: Since many of the vitamins are responsible for eye health are “fat-soluble nutrients” – that are absorbed best when eaten with a source of lipids (fats). Pair these vitamins with something like omega-3 foods (like salmon), coconut oil, olive oil, avocado, nuts and seeds for proper absorption.
2. Hello, New Computer And Phone Habits!
How much time do you spend on your phone, computer, or watching TV per day? Really think about this… It’s probably a lot more than you think. Young adults are spending about five hours per day on their phone, just their phone. If you work in front of a computer for eight hours per day, add that in plus whatever time you spend in front of a TV at night watching Netflix or FMTV 😉 That’s a fair chunk of your day!
Our tips: Take frequent breaks by looking away from the screen for 2 to 3 minutes every 15 to 20 minutes. Glare from digital screens can also have an effect on the eyes, so try to avoid overhead lights and use a desk lamp instead to control the glare that might come in from any nearby windows. Blue light blocker glasses are now widely available that can help filter the blue light coming from digital devices. You can also install blue light filters on most smartphones. Our biggest tip would be to challenge yourself to spend some time off your screen at night, especially 2-3 hours before bed – You may even notice a more restful nights sleep – Winning!
3. Change Up Your Lifestyle Habits
The smallest changes to our daily routine can help take stress off of our eyes. Start thinking about things like:
-
Wear sunglasses: Find yourself outdoors for long periods of time? Wearing sunglasses can help to protect your eyes from excessive exposure to UVA and UVB.
-
Stop smoking: No brainer here, but smoking cigarettes produces cyanide, which is damaging to the eyes.
-
Hydrate your eyeballs: Hold up on the staring competitions and blink – blinking is actually our eyes way of Move Move your body: Turns out, being active isn’t just good for your booty! Although exercise is considered beneficial for overall health, it can also help support healthy vision. Aim to be active for 30 minutes a day to feel the benefits, this will also get you away from the screens!
Source : Foodmatters June 2018
Reproduced with the permission of the Food Matters team. This article by Rachel Morrow was originally published at www.foodmatters.com/ /article/staring-at-a-screen-all-day-here-are-3-things-you-can-do-to-protect-your-eyes
Important:
This provides general information and hasn’t taken your circumstances into account. It’s important to consider your particular circumstances before deciding what’s right for you. Although the information is from sources considered reliable, we do not guarantee that it is accurate or complete. You should not rely upon it and should seek qualified advice before making any investment decision. Except where liability under any statute cannot be excluded, we do not accept any liability (whether under contract, tort or otherwise) for any resulting loss or damage of the reader or any other person.
Any information provided by the author detailed above is separate and external to our business and our Licensee. Neither our business, nor our Licensee take any responsibility for any action or any service provided by the author.
Any links have been provided with permission for information purposes only and will take you to external websites, which are not connected to our company in any way. Note: Our company does not endorse and is not responsible for the accuracy of the contents/information contained within the linked site(s) accessible from this page.
Superannuation and separation: Who keeps the money?
Depending on the situation, you might get some of your ex-partner’s super, or they may get some of yours.
A divorce from your husband or wife, or a separation from your de facto, could mean a division of your assets and debts, whether they’re held separately or together, and superannuation is no exception.
Another thing to note is even if one of you
Read MoreDepending on the situation, you might get some of your ex-partner’s super, or they may get some of yours.

A divorce from your husband or wife, or a separation from your de facto, could mean a division of your assets and debts, whether they’re held separately or together, and superannuation is no exception.
Another thing to note is even if one of you hasn’t contributed to super for many years, that person could still be entitled to a percentage of the other’s super.
We explain some of the key points below. And, if you’re a de facto couple living in Western Australia, remember different rules may apply as you’re not subject to the same superannuation splitting laws1.
How is super divided?
A superannuation agreement can be put in place before, during or after your relationship, as part of a broader ‘binding financial agreement’. This agreement can specify how super is to be split upon separation or divorce.
If you and your partner don’t have a binding financial agreement in place already but have agreed how you would like super to be split, an Application for Consent Orders can be filed in court without your attendance to formalise the arrangement you’ve both come to2.
If you can’t come to an arrangement together, you might instead look to obtain Financial Orders, under which a court hearing will determine how super is to be split between the two of you3.
Because there are rules around when super can be accessed (for instance, you may need to have retired from the workforce), remember that splitting super won’t necessarily result in an immediate cash payout, as super is treated differently to other assets and debts.
What does the process involve?
You may want or need to get information regarding the value of the superannuation that is to be split. And, you’ll need to provide various forms to the super fund to get this, which you can locate in the Superannuation Information Kit on the Federal Circuit Court of Australia website4.
You can do this if it’s your super fund, or your ex-partner’s super fund, but keep in mind fees for providing this information may be payable by the person who has requested the information5.
Depending on your circumstances, you may also wish to establish a ‘flagging agreement’ whereby the super fund is prevented from paying out any super until the flag is lifted, which may also result in a fee6.
Once the super splitting order is made, whether by consent or after a court hearing, you’ll also need to provide a copy of the order to the super fund for it to be effective7.
Splitting super – what to keep in mind
Some people prefer to avoid lengthy disputes by choosing to forgo some of their entitlements.
The trouble with doing this is that it may have significant financial consequences down the track, so it’s important to be armed with all the information you can to ensure the decisions you make are sound.
Working out what you’re entitled to can be complicated, which is why it’s important to seek legal advice, and regarding other financial matters please contact us on |PHONE| if we can be of asssitance .
1 Attorney-General’s Department – Superannuation splitting laws
2, 3, 4, 7 Federal Circuit Court of Australia – Family Law Matters (Superannuation)
5, 6 Attorney-General’s Department – Superannuation splitting frequently asked questions page 10, 21
The next rate move may be down
The next interest rate change may be down rather than up, as the Reserve Bank of Australia grapples with falling property prices and low inflation according to AMP Capital Head of Investment Strategy and Chief Economist, Shane Oliver.
Oliver’s view on the where the RBA may go with rates is in sharp contrast to the US where the Federal Reserve
Read MoreThe next interest rate change may be down rather than up, as the Reserve Bank of Australia grapples with falling property prices and low inflation according to AMP Capital Head of Investment Strategy and Chief Economist, Shane Oliver.

Oliver’s view on the where the RBA may go with rates is in sharp contrast to the US where the Federal Reserve has been raising rates since the end of 2015 and is expected to continue this trajectory this year.
“There is some risk the Reserve Bank might have to cut interest rates again,” says Oliver. “We are seeing home prices come off again in Sydney and Melbourne and obviously that will have a negative wealth effect.”
The two cities combined account for about 40 per cent of the Australia by population. That factor combined with the banking industry measures to tighten up lending standards around borrowers’ incomes and expenses may continue to impact property prices.
“If that gathers pace, and there is a risk there with the tightening of bank lending standards, then that might force the Reserve Bank’s hand into actually cutting again, because the tightening in lending standards is a defacto monetary tightening,” Oliver says.
The RBA on June 5 left rates on hold at 1.5 per cent for the twentieth meeting in a row. The last time it changed rates was a 25 basis point cut in August 2016.
In his monthly statement RBA Governor Philip Lowe noted housing credit growth had slowed in the past year, “especially to investors” and commented on the Australian Prudential Regulation Authority’s (APRA) measures to stem “the build-up of risk in household balance sheets.”
While a near-term rate cut is not the AMP Capital base case, Oliver describes it as “a risk worth keeping an eye on.”
“We have increased evidence that the housing cycle is starting to turn down, and this will lead to a loss of wealth, which has a negative impact on consumer spending at a time when wages growth is still very weak and inflation is very low.”
The prospect of a rate cut would be welcome news for many indebted home owners, and it may also be good for local bond investors by helping offset upwards pressure on bond yields coming from global sources.
“Having rates on hold for an extended period, with some risk of a rate cut, might keep Australian government bond yields relatively low compared to what we are seeing internationally,” says Oliver. “This in turn will help minimize the near-term potential for capital losses on Australian bonds.”
There is upwards pressure on bond yields in the US, but in Australia that upwards pressure is somewhat offset by the RBA keeping interest rates on hold. Oliver predicts that will help keep Australian bond yields comparatively lower.
In the US, the Fed lowered its benchmark rate to near zero after the global financial crisis began in 2008. It then began raising rates two and a half years ago when the economy started to strengthen and has now increased the rate seven times. It’s expected to raise rates again next week.
Source: AMP Capital 13 June 2018
Important note: While every care has been taken in the preparation of this article, AMP Capital Investors Limited (ABN 59 001 777 591, AFSL 232497) and AMP Capital Funds Management Limited (ABN 15 159 557 721, AFSL 426455) makes no representations or warranties as to the accuracy or completeness of any statement in it including, without limitation, any forecasts. Past performance is not a reliable indicator of future performance. This article has been prepared for the purpose of providing general information, without taking account of any particular investor’s objectives, financial situation or needs. An investor should, before making any investment decisions, consider the appropriateness of the information in this article, and seek professional advice, having regard to the investor’s objectives, financial situation and needs. This article is solely for the use of the party to whom it is provided.
How global trends are creating infrastructure opportunities
Infrastructure investing is changing fast as evolving global trends throw up new opportunities.
The rise of emerging Asian economies, climate change, technological disruption and the ageing demographic are transforming the demand for essential facilities across the developed world and beyond.
This is creating exciting investment opportunities for infrastructure investors who are examining this expanding asset class to capture global economic
Read MoreInfrastructure investing is changing fast as evolving global trends throw up new opportunities.

The rise of emerging Asian economies, climate change, technological disruption and the ageing demographic are transforming the demand for essential facilities across the developed world and beyond.
This is creating exciting investment opportunities for infrastructure investors who are examining this expanding asset class to capture global economic growth.
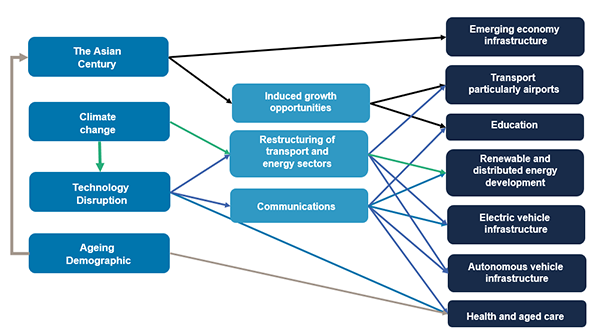
Source: AMP Capital
The Asian Century
The Chinese middle class has expanded enormously in recent years; from just 4% of its population in 2000, it is expected to reach 75% by 2022 according to McKinsey. Similar trends are becoming evident in India and south-east Asian economies. According to PwC, six of the world’s seven largest economies in 2050 will be current emerging economies; three of the top four being in Asia.
This is already fueling the infrastructure needs of those societies, as evidenced by the Chinese government’s One Belt One Road initiative. Fast rail links, the Hong Kong-Zhuhai-Macau Bridge and upgraded port facilities are all signs of this.
This trend is also impacting developed economies as the Asian middle class spends its new wealth in western countries. A university education in an English-speaking developed country is highly regarded across Asia. Education is now Australia’s largest service export.
This influx of international students is increasing the need for student accommodation attached to leading universities in countries such as Australia. This market expects a higher quality standard than traditional student housing, but its enhanced ability to pay gives rise to long-term high-yield investments that provide protection against inflation.
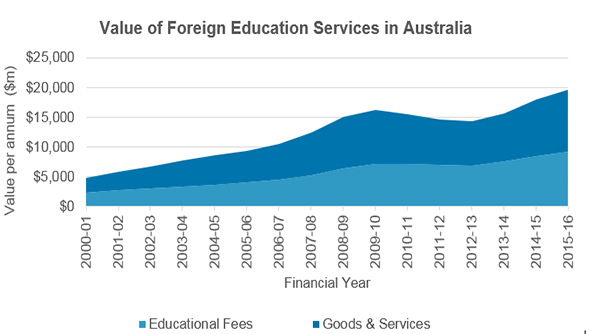
Source:ABS 5368.0.55.003
The emerging Asian middle class is also spending its new-found wealth on overseas travel. Long-haul air travel in the Asia Pacific region is forecast to grow in excess of 6% per year over the next 20 years.
Australian international airports have taken advantage of this, achieving some of the highest EBITDA growth amongst developed economy airports. A lack of spare capacity and technological improvements that enable more long-haul direct flights are boosting demand for new infrastructure projects to support this growing demand.
Climate change
The 2015 Paris Climate Change Agreement committed countries to take measures that would limit global warming to 2 degrees Celsius. This promise and the immediate impact of pollution are leading to the restructuring of transport and energy sectors.
Road congestion and pollution are leading to electric vehicles, greater experimentation with road charging, high-speed rail links and the expansion of mass transit networks in large urban areas. Such developments require large-scale construction projects and/or the handling of large volumes of data.
Climate change has also led governments to adjust the incentives that apply to energy supply in favour of renewables at the expense of fossil fuels. The profusion of wind, solar, hydro and tidal projects is well-established, however these are likely to continue to expand as their historic cost disadvantage continues to diminish.
Climate change also represents a challenge for the management and distribution of scarce urban water resources, in which private sector capital may well have a role to play.
Disruptive technology on a micro level is leading to energy cost savings for households when rooftop solar panels are integrated with advanced battery technology and connected to the electricity grid. Individual households have achieved cost savings in excess of 80% of their annual electricity bills through exploiting this technology.
Technology costs are expected to continue to fall, making such systems increasingly viable for the typical home owner. Furthermore, integration with network operations can improve grid productivity and also opens up an alternative power generation opportunity for infrastructure investors.
Technological disruption
Technological disruption is initiating a fourth industrial revolution as devices become automated and connected.
The decentralisation of work, energy and service provision is leading to more home working, energy self-sufficiency and local/home delivery. However these trends require ongoing investment in the data and logistical infrastructure required to support these lifestyle shifts.
Hybrid and electric cars and delivery trucks are already becoming a common sight across developed countries. Electric vehicles will be cheaper for consumers and permit the decarbonising of the transport sector.
Looking further ahead, automated vehicles (which will be overwhelmingly electrically-powered) will eventually deliver a more flexible alternative to conventional public transport methods and private car ownership.
However this will depend upon massive infrastructure capex to support the power and data transmission that will be required for the safe and reliable use of road space.
Ageing Demographic
Global fertility rates have halved since 1955 as much of the world has industrialised and life expectancy has risen in developing countries. However the demographic deficit is impacting low-nominal growth developed countries such as Japan and Italy as well as Russia and China. The size of Japan’s workforce has been declining since 1994 as demographics meet a cultural hesitation towards immigration.
This trend is leading to greater health spending; in the UK some 40% of the state-financed National Health Service is spent on the over-65s, a proportion that will continue to rise. Longer-term aged care facilities will also continue to see increasing demand.
These trends will lead to ongoing infrastructure capex as new facilities are established by both public and private sector providers.
Conclusions
A broad range of high-growth infrastructure investments will be generated by these major global structural themes.
Opportunities are most likely to arise in the transport, energy, data/communications and healthcare sectors.
While some of these opportunities, such as airports, will be quite familiar, others will be new, including disruptive technologies or those found in emerging economies. Sovereign and governance risks in these economies will require careful management and the selection of local partners.
These emerging opportunities will provide infrastructure investors with potentially higher returns (and potentially higher risks) which will complement conventional infrastructure investments. Success will depend upon good project selection and high levels of positive control to allow active ‘private equity-style’ asset management of investments.
The blending of higher return “new infrastructure” and traditional infrastructure will allow portfolio managers the ability to construct portfolios with a wide range of risk and return characteristics.
Source: AMP Capital 13 June 2018
Author: John Julian, Portfolio Manager, Core Infrastructure Fund
Important note: While every care has been taken in the preparation of this article, AMP Capital Investors Limited (ABN 59 001 777 591, AFSL 232497) and AMP Capital Funds Management Limited (ABN 15 159 557 721, AFSL 426455) makes no representations or warranties as to the accuracy or completeness of any statement in it including, without limitation, any forecasts. Past performance is not a reliable indicator of future performance. This article has been prepared for the purpose of providing general information, without taking account of any particular investor’s objectives, financial situation or needs. An investor should, before making any investment decisions, consider the appropriateness of the information in this article, and seek professional advice, having regard to the investor’s objectives, financial situation and needs. This article is solely for the use of the party to whom it is provided.
Investors win from commodities cash flow boom
Dermot Ryan, Portfolio Manager, Australian Equites, AMP Capital
Resource companies are enjoying a resurgence in profits based on higher commodity prices and lower unit costs.
Now many of you might think, “well we’ve had booms before.” The big difference this time is that there is still a strong focus on reducing the price of production, even as prices for raw commodities
Read MoreDermot Ryan, Portfolio Manager, Australian Equites, AMP Capital
Resource companies are enjoying a resurgence in profits based on higher commodity prices and lower unit costs.

Now many of you might think, “well we’ve had booms before.” The big difference this time is that there is still a strong focus on reducing the price of production, even as prices for raw commodities continues to increase.
In the mining boom pre-Global Financial Crisis (GFC) we saw a sharp run up in commodity prices, and companies scrambling over one another to get mines built as quick as possible – irrespective of costs. This led to greenfield expansion and large amounts of money being spent on labour, machinery and procurement and many of these didn’t get a good cost outcome.
Now, I think we are in one of the best periods for franked returns in the mining industry since the that last boom.
It is refreshing to see, in so many cases, mining companies returning money to investors through dividends and buybacks, rather than just being on a mad rush for growth.
Economic Growth
Global economic growth is running hot. In the US, business confidence and employment growth have been rising, and in much of Europe the recovery is underway.
From China, the world’s biggest commodities consumer, we are seeing a lot of demand for seaborne high-grade commodities, and they are also looking to improve their air quality and the environment, which means there may well be a substitution of lower grade Chinese raw materials for higher grade imports.
I think there are interesting opportunities across areas such as energy, iron ore, copper, and also specifically commodities related to electric vehicles. Lithium producers are the biggest winners from this, and there is also strong demand for cobalt and graphite.
As we go through this point in the cycle where demand is still high and interest rates haven’t yet risen there is an opportunity for companies that have de-geared their balance sheets to use some of that capital to invest back into their mines.
Mining expansion rarely comes cheap and the Reserve Bank of Australia has kept interest rates on hold for 21 months now. AMP Capital does not expect a rate rise until 2020. However, should the US Federal reserve raise rates quickly there could be risks for commodity prices and Asia demand.
Mining stock values
Valuations are still quite reasonable in the mining space as well because people want to see how sustainable commodity prices are at this level. It wasn’t that long ago after all, that larger companies found themselves too heavily in debt and struggling to refinance during the GFC.
Revenue & Earnings for the Australian Metals and Mining industry group

* Forecast estimates only for 2018 and 2019. Actual future results could differ materially from any forecasts, estimates, or opinions.
Source: Factset Industry Consensus Estimates
The winners are those who can add incremental production to existing plants and reduce their unit costs per commodity and come down the cost curve. This particularly favors companies with expandable tier one assets.
Now, we seem to be in a more considered period where most moving factors point towards better returns at any given commodity prices. This is really encouraging for Australian investors.
Companies too are much more focused on capital allocation and returning cash to shareholders. These periods of high dividends in deeply cyclical sectors like mining don’t last forever but can be enjoyed by investors in the current market.
Source: AMP Capital 13 June 2018
Author: Dermot Ryan, Portfolio Manager, Australian Equites, AMP Capital
Important note: While every care has been taken in the preparation of this article, AMP Capital Investors Limited (ABN 59 001 777 591, AFSL 232497) and AMP Capital Funds Management Limited (ABN 15 159 557 721, AFSL 426455) makes no representations or warranties as to the accuracy or completeness of any statement in it including, without limitation, any forecasts. Past performance is not a reliable indicator of future performance. This article has been prepared for the purpose of providing general information, without taking account of any particular investor’s objectives, financial situation or needs. An investor should, before making any investment decisions, consider the appropriateness of the information in this article, and seek professional advice, having regard to the investor’s objectives, financial situation and needs. This article is solely for the use of the party to whom it is provided.