

Olivers Insights
Expect slower medium-term returns
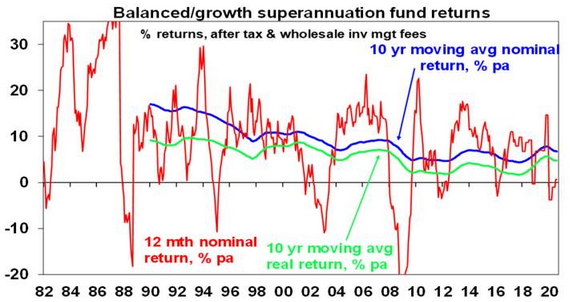
Despite a 35% or so plunge in share markets earlier this year; on the back of the pandemic and rough patches in 2018, 2015 and 2011, well diversified Australian investors have seen pretty good returns over the last 10 years. The median balanced growth superannuation fund returned 5.8% pa over the five years to August and 7.3% pa over 10
Read More
Despite a 35% or so plunge in share markets earlier this year; on the back of the pandemic and rough patches in 2018, 2015 and 2011, well diversified Australian investors have seen pretty good returns over the last 10 years. The median balanced growth superannuation fund returned 5.8% pa over the five years to August and 7.3% pa over 10 years and that’s after fees and taxes. While that’s dull compared to the double digit returns of the higher inflation world of the 1980s and 1990s, it’s pretty good once low inflation of 2% pa or less is allowed for.
Source: Mercer Investment Consulting, Morningstar, AMP Capital
However, investors need to allow that past returns have been boosted by a search for yield as interest rates have collapsed, which has pushed down yields and pushed up values for most assets. But this in turn points to eventually constrained returns.
Investing 101: lower yields = lower return potential
It’s pretty obvious that investment returns have two components: yield (or income flow) and capital growth. Also, the price of an asset moves inversely to its yield all other things being equal. For example, suppose an asset pays $10 a year in income and its price is $100 – this means an income flow or yield of 10%. If interest rates on bank term deposits are cut this will likely encourage increased investor interest in the asset as investors will like its high yield. Its price will then be pushed up – to say $120, which given the $10 annual income flow means that its yield will have fallen to 8.3% (i.e. $10 divided by $120). This is great for investors who were already in the asset as its value has gone up by 20%. But its yield is now pointing to lower potential returns going forward, unless the yield continues to fall, further boosting capital growth – but there is a limit to this.
The plunge in yields since the early 1980s
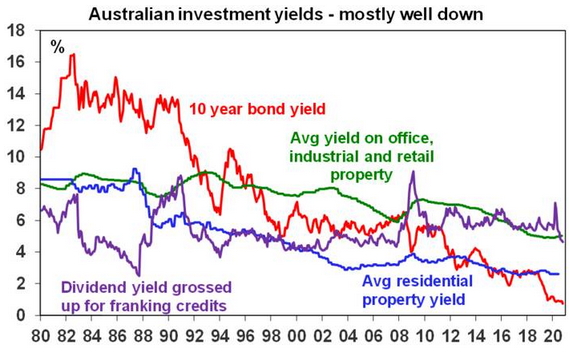
In the early 1980s, the RBA’s “cash rate” was around 14%, 1-year term deposit rates were nearly 14%, 10-year bond yields were around 13.5%, commercial and residential property yields were around 8-9% and dividend yields on shares were around 6.5% in Australia and 5% globally. This meant investments were already providing very high income so only modest capital growth was needed for growth assets to generate good returns. So, most assets had very strong returns and balanced growth; super fund returns averaged 14.1% in nominal terms and 9.4% in real terms between 1982 and 1999 (after taxes and fees).
But with the shift from very high inflation to very low inflation, the last 40 years has seen a collapse in yields. This was led by falling interest rates and bond yields and then yields on other assets were pushed down too as investors searched out higher yields which pushed their prices up and their yields down. Just as the GFC gave this a push along so has the coronavirus pandemic’s hit to the global economy. See the next chart.
Source: Bloomberg, REIA, JLL, AMP Capital
Today the cash rate is 0.25% (and likely to fall to 0.1% next month), 1-year bank term deposit rates are 0.75%, 10-year bond yields are 0.75%, gross residential property yields are around 3%, commercial property yields are around 5%, dividend yields are around 4.5% for Australian shares (with franking credits) but they are 2.25% for global shares. This points to a lower return potential for a diversified mix of assets.
More constrained capital growth
What’s more, the capital growth potential from growth assets is likely to be constrained relative to the past, reflecting a number of megatrends, some of which have been reinforced by the coronavirus pandemic:
-
An increasing reluctance by households to take on more debt.
-
An ongoing retreat from globalisation, deregulation and small government in favour of populist, less market friendly policies.
-
Rising geopolitical tensions – notably as the US attempts to constrain the rising power of China.
-
Aging populations and slowing population growth – resulting in slowing labour force growth.
-
Growing online retail sales and “work from home” will impact retail and office property space demand but I suspect this will see spending diverted to show up elsewhere in the economy.
Of course, continuing technological innovation and automation as well as rapid growth in Asia and China’s middle class will likely work to boost growth. But the net impact is likely to be more constrained global economic growth.
Medium-term (ie, 5 to 10 year) return projections
Our approach to get a handle on medium-term return potential of major asset classes is to start with current yields for each and apply simple and consistent assumptions regarding capital growth allowing for the above-mentioned megatrends. We also prefer to avoid forecasting and like to keep the analysis simple.
-
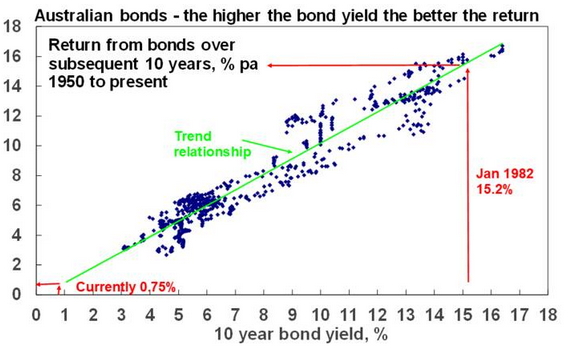
For bonds, the best predictor of future medium-term returns is current bond yields – as can be seen historically in the next chart. If a 10-year bond is held to maturity its initial yield (0.75% right now in Australia) will be its return over 10 years. We use 5-year bond yields as they more closely match the maturity of bond indexes.
Source: Global Financial Data, Bloomberg, AMP Capital
-
For equities, current dividend yields plus trend nominal GDP growth (a proxy for capital growth) does a good job of predicting medium-term returns1.
-
For property, we use current rental yields and likely trend inflation as a proxy for rental and capital growth. The surge in online spending and “work from home” means greater than normal uncertainty around these returns at present.
-
For unlisted infrastructure, we use current average yields and capital growth just ahead of inflation.
-
In the case of cash, the current rate is of no value in assessing its medium-term return. So, we allow for some rise in cash rates after 2023.
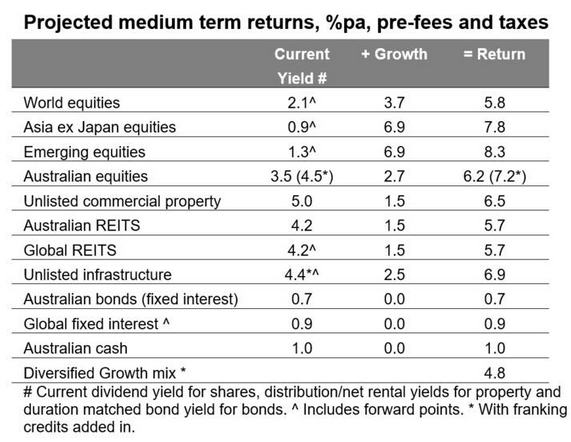
Our latest return projections are shown in the next table. The second column shows each asset’s current income yield, the third shows their 5-10 year growth potential, and the final column their total return potential. Note that:
-
We assume inflation averages around 1.5% p.a.
-
For Australia we have adopted a relatively conservative growth assumption reflecting slower productivity growth.
Source: AMP Capital
Key observations
Several things are worth noting from these projections.
-
The medium-term return potential has continued to fall due falling yields and reduced capital growth prospects. For a diversified growth mix of assets, it has fallen from 10.3% pa in March 2009 and 5.6% a year ago, to now just 4.8%.
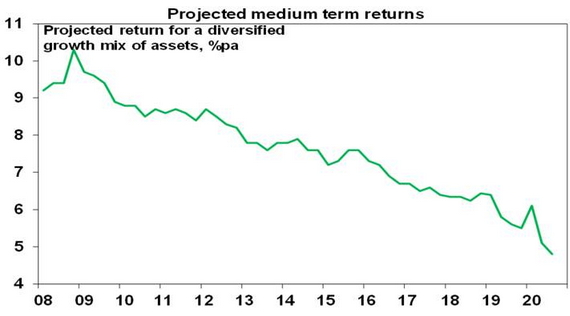
Source: AMP Capital
-
While past bond returns have been ok as yields fell pushing up bond prices, ultra-low yields now point to low returns.
-
Commercial property and infrastructure come out relatively well, but face greater than normal uncertainty in the demand for retail and office space & human transport infrastructure.
-
Australian shares stack up well on the basis of yield, but it’s still hard to beat Asian/emerging shares for growth potential.
-
The downside risks to our medium-term projections are that economies stay in recession longer driving another plunge in shares or that yields are pushed up to more normal levels as inflation rebounds causing large capital losses.
-
The upside risks are less obvious but could occur if we see improving global growth but inflation remaining very low.
Implications for investors
-
First, have reasonable return expectations. With low yields, low inflation and constrained growth it’s unreasonable to expect sustained double-digit or high single digit returns.
-
Second, remember that allocating more to growth assets to boost overall returns does mean taking on more risk.
-
Third, bear markets are painful and are hard to predict, but they do push up the medium-term return potential of shares and so provide opportunities for investors.
-
Fourth, some of the decline in return potential reflects very low inflation – real returns haven’t fallen as much – and 4.8% pa is still well above sub 1% bank term deposit rates.
-
Finally, focus on assets with decent sustainable income flow as they provide confidence regarding future returns.
1 Adjustments can be made for: dividend payout ratios (but history shows retained earnings often don’t lead to higher returns so the dividend yield is the best guide); the potential for PEs to move to some equilibrium level (but forecasting the equilibrium PE can be difficult and dividend yields send valuation signals anyway); and adjusting the capital growth assumption for some assessment regarding profit margins (but this is hard to get right). So, we avoid forecasting these things.
Source: AMP Capital 21 October 2020
Important notes: While every care has been taken in the preparation of this article, AMP Capital Investors Limited (ABN 59 001 777 591, AFSL 232497) and AMP Capital Funds Management Limited (ABN 15 159 557 721, AFSL 426455) (AMP Capital) makes no representations or warranties as to the accuracy or completeness of any statement in it including, without limitation, any forecasts. Past performance is not a reliable indicator of future performance. This article has been prepared for the purpose of providing general information, without taking account of any particular investor’s objectives, financial situation or needs. An investor should, before making any investment decisions, consider the appropriateness of the information in this article, and seek professional advice, having regard to the investor’s objectives, financial situation and needs. This article is solely for the use of the party to whom it is provided and must not be provided to any other person or entity without the express written consent of AMP Capital.
Nine keys to successful investing – and why they are more important than ever in the face of the coronavirus shock
As an investor its very easy to get thrown off by the ever present worry list surrounding investment markets that relates to economic activity, profits, interest rates, politics, etc. Or by the perennial predictions of an imminent crash. Or by talk of the next best thing that’s going to make you rich.
The investment world is far from predictable and neat.
Read MoreAs an investor its very easy to get thrown off by the ever present worry list surrounding investment markets that relates to economic activity, profits, interest rates, politics, etc. Or by the perennial predictions of an imminent crash. Or by talk of the next best thing that’s going to make you rich.

The investment world is far from predictable and neat. Its well known for sucking investors in during the good times and spitting them out during the bad times. Investing has become more difficult in recent years reflecting a surge in the flow of information and opinion. This has been magnified by a digital media where everyone is vying for attention and the best way to get this attention is via headlines of impending crisis. This all adds to uncertainty and potentially erratic investment decisions.
Against this backdrop I have written regularly over the years about nine key things for investors to bear in mind in order to be successful. But how does the coronavirus pandemic impact these? This note reviews each in view of the pandemic.
1. Make the most of the power of compound interest
The next chart is one of my favourites and shows the value of one dollar invested in 1900 in Australian cash, bonds and equities with interest and dividends reinvested along the way. That one dollar would be worth $242 today if it had been invested in cash. But if it had been invested in bonds it would be worth $1010 and if it was allocated to Australian shares it would be worth $575,575. Although the average return on shares (11.6% pa) is just double that on bonds (5.9% pa), the magic of compounding higher returns over long periods leads to a substantially higher balance. The same applies to other growth assets like property. So, the best way to build wealth is to take advantage of the power of compound interest and have a decent exposure to growth assets. Of course, the price for higher returns is higher volatility but the impact of compounding higher returns from growth assets is huge over long periods.
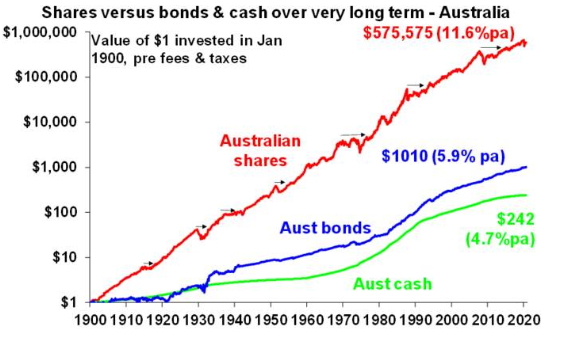
Source: Global Financial Data, AMP Capital
The coronavirus pandemic does nothing to change this, any more than previous setbacks like WW1 and Spanish Flu, the Great Depression, the 1973-74 bear market, the 1987 crash or the GFC did. The collapse in interest rates and earnings yields means the returns seen over the last 120 years will likely be a lot lower over the next decade. But this partly reflects the collapse in inflation (so in real returns thangs are not quite so bad). And without getting into forecasting, shares offering a dividend yield of 3.5% (4.5% with franking credits) should provide superior medium term returns and hence grow wealth far better than bonds where the ten year yield is 0.85% pa (which is the return you will get over the next ten years).
2. Don’t get thrown off by the cycle
Investment markets constantly go through cyclical phases of good times and bad. Some are short and sharp, some can spread over many years. But all eventually set up their own reversal – eg as falls make shares cheap and low interest rates help them rebound. The trouble is that cycles can throw investors off a well thought out investment strategy that aims to take advantage of longer-term returns. But they also create opportunities. Looked at in a longer term context the roughly 35% plunge and then rebound in shares associated with coronavirus was just another cyclical swing – albeit it occurred faster reflecting the unique nature of the shock which saw a faster than normal hit to economies and then faster than normal deployment of fiscal stimulus and monetary easing. The key was not to get thrown off when markets plunged into March.
3. Invest for the long term
Looking back, it always looks obvious as to why things happened. But that’s just Harry Hindsight talking! Looking forward no-one has a perfect crystal ball. As JK Galbraith observed “there are two kinds of forecasters: those who don’t know, and those who don’t know they don’t know.” Usually the grander the forecast the greater the need for scepticism as such calls invariably get the timing wrong or are dead wrong. If getting markets right were easy, then the prognosticators would be mega rich and would have stopped doing it. Related to this many get it wrong by letting blind faith – eg “there is too much debt” – get in the way of good decisions. They may be right one day, but an investor can lose a lot of money in the interim. The problem for ordinary investors is that it’s not getting easier as the world is getting noisier. This has all been evident through the coronavirus pandemic with all sorts of forecasts as to what it would mean, most of which provided little help in actually getting the market low back in March let alone the rebound. Given the difficulty in getting market moves right in the short-term, for most it’s best to get a long-term plan that suits your level of wealth, age, tolerance of volatility, etc, and stick to it.
4. Diversify
Don’t put all your eggs in one basket. Having a well-diversified portfolio will provide a much smoother ride. For example, global and Australian shares provide similar returns over the very long term but in the March quarter this year global shares in Australian dollars fell less than half as much as Australian shares. Similarly, income investors who just had a few Australian bank stocks would have been hard hit by bank dividend cuts earlier this year whereas those with a broader exposure to high dividend paying companies would have seen their dividend income hold up a lot better.
5. Turn down the noise
After having worked out a strategy that’s right for you, it’s important to turn down the noise on the information flow and prognosticating babble and stay focussed. The trouble is that the digital world we live in is seeing an explosion in information and opinions about economies and investments. But much of this information and opinion is of poor quality. As “bad news sells” there has always been pressure on editors to put the negative news on the front page of newspapers but there was hopefully some balance in the rest of the paper. But in a digital world each story can be tracked via clicks so the pressure to run with sensationalised and often bad news headlines is magnified. Hence click bait. This has gone into hyperdrive through the coronavirus pandemic – with a massively stepped up flow of economic information (eg the Australian Bureau of Statistics now publishes key jobs reports three times a month and there is now a focus on weekly economic statistics). This may be of use in providing timely information on how the economy is travelling but it’s also added immensely to the flow of information and often its contradictory. This is all leading to heightened uncertainty and shorter investment horizons which in turn can add to the risk that you could be thrown off well thought out investment strategies. The key is to turn down the volume on all this noise. This also means keeping your investment strategy relatively simple. Don’t waste too much time on individual shares or funds as it’s your high-level asset allocation that will mainly drive the return and volatility you will get. Here are several tips to help turn down the noise:
-
Put the latest worries in context – the global and Australian economies have had plenty of worries over the last century or so – from wars to depressions to pandemics – and yet long-term investment returns have been fine
-
Recognise that its normal for markets to swing from one extreme to another;
-
Focus on only a few reliable news services and turn all “notifications” on your smart device off.
-
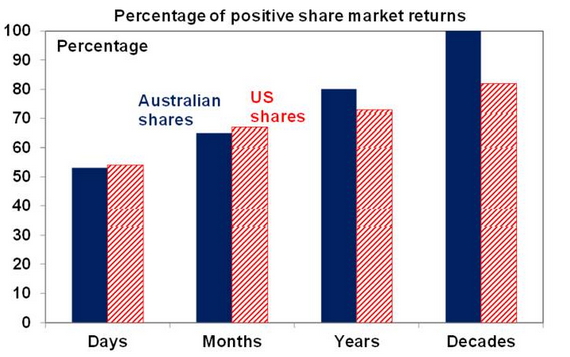
Don’t’ check you investments so much – on a day to day basis it’s a coin toss as to whether the share market will rise or fall but the longer you stretch it out between looking at your investments the more likely you will get positive news. See the next chart.
Source: Bloomberg, AMP Capital
6. Buy low, sell high
The cheaper you buy an asset (or the higher its yield), the higher its prospective return will likely be and vice versa, all other things being equal of course. So as far as possible it makes sense to buy when markets are down and sell when they are up. Unfortunately, many do the opposite, ie buying after a big rally and selling after a collapse…which just has the effect of destroying wealth. Selling at the panic low point in March would not have been a good move as it would have just locked in a loss – but of course it might have felt easy in the midst of the panic at the time. Again turn down the noise!
7. Beware the crowd at extremes
It often feels safe to be in a crowd and at times the investment crowd can be right. However, at extremes the crowd is invariably wrong – whether it’s at market highs like in the late 1990s tech boom or market lows like in March. The problem with crowds is that eventually everyone who wants to buy in a boom (or sell in a bust) will do so and then the only way is down (or up after crowd panics). As Warren Buffet has said the key is to “be fearful when others are greedy and greedy when others are fearful”. And coronavirus does nothing to change that.
8. Focus on investments with sustainable cash flow
If it looks dodgy, hard to understand or has to be based on obscure valuation measures then it’s best to stay away. If an investment looks too good to be true it probably is. By contrast, assets that generate sustainable cash flows (profits, rents, interest) and don’t rely on excessive gearing or financial engineering are more likely to deliver. Again, the coronavirus hit does nothing to change this.
9. Seek advice
Given the psychological traps we are all susceptible too (like the tendency to over-react to current investment market conditions, or to pay more attention to information and opinion that confirms our own views) and the increasing complexity of investing that makes it anything but easy, a good approach is to seek advice via an investment service or a coach such as a financial adviser, in much the same way you might use a specialist to look after your plumbing or medical needs. As with plumbers and doctors it pays to shop around to find a service or adviser you are comfortable with and can trust. Even I have a financial adviser to help deal with the complexity of investing.
Source: AMP Capital 14 October 2020
Important notes: While every care has been taken in the preparation of this article, AMP Capital Investors Limited (ABN 59 001 777 591, AFSL 232497) and AMP Capital Funds Management Limited (ABN 15 159 557 721, AFSL 426455) (AMP Capital) makes no representations or warranties as to the accuracy or completeness of any statement in it including, without limitation, any forecasts. Past performance is not a reliable indicator of future performance. This article has been prepared for the purpose of providing general information, without taking account of any particular investor’s objectives, financial situation or needs. An investor should, before making any investment decisions, consider the appropriateness of the information in this article, and seek professional advice, having regard to the investor’s objectives, financial situation and needs. This article is solely for the use of the party to whom it is provided and must not be provided to any other person or entity without the express written consent of AMP Capital.
Biden versus Trump – the US presidential election is looming as the next big event for investors
The US election is only a month away. Markets are now paying close attention to it for several reasons. First, Joe Biden is proposing higher taxes and more regulation. Second, the proximity of the election made worse by the move to replace Justice Ginsberg may have reduced prospects for needed fiscal stimulus. Third, increased use of postal voting could mean
Read MoreThe US election is only a month away. Markets are now paying close attention to it for several reasons. First, Joe Biden is proposing higher taxes and more regulation. Second, the proximity of the election made worse by the move to replace Justice Ginsberg may have reduced prospects for needed fiscal stimulus. Third, increased use of postal voting could mean it will take longer before the outcome is known. Finally, President Trump’s scorn for postal voting (which polls show 45% of Biden voters plan to use versus 10% of Trump voters!) looks to be setting up a challenge to the result if he loses and his refusal to guarantee a peaceful transfer, adds to uncertainty.

Polls and betting odds favour Biden
-
Real Clear Politics poll average has Biden ahead by 6 points. This is down from around 9 points since July as Trump got a boost as the daily number of new coronavirus cases fell from nearly 70,000 to 40,000 but it’s been pretty stable over the last two months. This contrasts with four years ago where polls mostly had Clinton ahead, but it was very volatile with Trump out front on several occasions. In late September 2016 Clinton was about 2.5 points ahead.
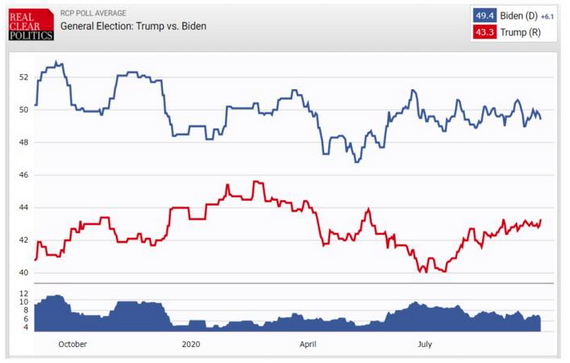
Source: Real Clear Politics
-
Biden’s lead averages about 3 points in battleground states.
-
The ‘Predict It’ betting market has Biden with a 17 point lead but has a Democrat clean sweep (where it wins the presidency, House and Senate) at around 50/50. The Democrats already have control of the House and are likely to retain that, but they need three seats with the Vice President, to gain a majority in the Senate. A clean sweep would remove the Senate as a blockage to higher taxes.
-
Nate Silver’s 538 election model that combines state polls with economic data puts a Biden win at 78% probability.
-
More shy Trump voters than Democrat voters in revealing their true intention adds to the uncertainty around polls.
-
The first debate didn’t offer anything new on the policy front and is unlikely to have changed things much.
The economy versus the virus
History indicates incumbent presidents tend to lose when there is a recession in the two years before the election.
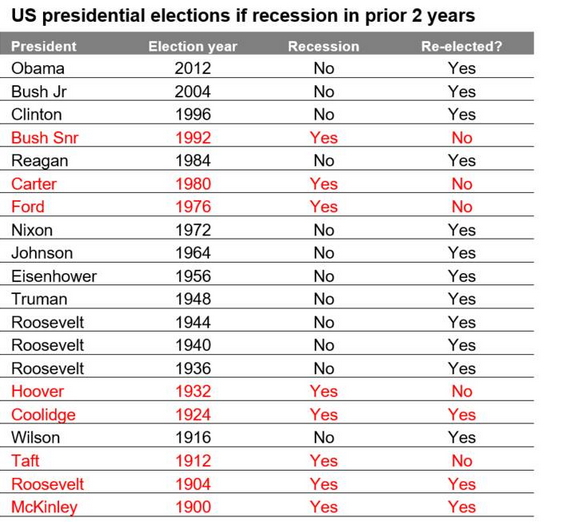
Source: Strategas
However, Trump’s best hope is for a rebound in the economy, with data pointing to an 8% rebound in September quarter GDP (due just before the election) thereby ending the recession. There has been a precedent for incumbent presidents being re-elected if the recession ends prior to election day. But it’s only 50/50 and was early last century – with Presidents McKinley in 1900, Roosevelt in 1904 and Coolidge in 1924 getting re-elected as recessions ended prior to the election but not so for Presidents Taft in 1912, Ford in 1976 and Carter in 1980. Working against this for Trump would be if the recent resurgence in US new coronavirus gathers pace resulting in renewed uncertainty about the economic outlook.
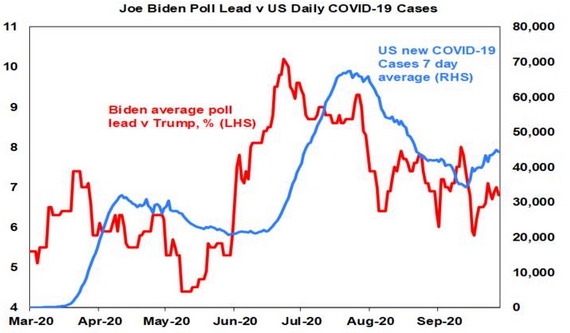
Source: RCP, ourworldindata.org, AMP Capital
The US share market is sending a more positive signal for Trump. It has been one of the best guides to the election outcome – if the S&P 500 is up over the 3 months prior to the election date the incumbent party tends to win and vice versa if it’s down. This has been 87% accurate since 1928 and 100% accurate since 1984. Right now, its up 1.2% since August 3rd!
Bottom line: Biden is ahead but its premature to write Trump off.
Key Biden policy directions versus Trump
Taxation: Biden plans to raise the corporate tax rate to 28% (from 21%), return the top marginal tax rate to 39.6% (from 37%) and tax capital gains and dividends as ordinary income.
Infrastructure: Both plan to spend $1trn or more over 10 years on infrastructure with Biden focussed on renewable energy.
Climate policy: Biden aims for the US to reach net zero emissions by 2050 by raising the cost of fossil fuels & boosting the development of alternatives (possibly with a carbon tax)
Regulation: Biden is likely to end the era of deregulation.
Coronavirus: Biden is likely to oversee a more robust, organised and consistent response to dealing with the virus.
Healthcare: Biden wants to strengthen Obamacare.
Trade and foreign policy: A re-elected Trump is likely to ramp up his trade war with China with “made in America” tax credits and more tariffs on imports on China and possibly elsewhere including Europe. By contrast, Biden would likely rebuild the alliance with Europe, work with international organisations like the World Trade Organisation, work to re-establish the nuclear deal with Iran and adopt a more diplomatic approach to dealing with issues with China (working with Europe and Asian allies).
Budget deficit: For the near term, the budget deficit is likely to remain high whoever wins, but historically they have fallen under Democrats after rising under Republicans. That said, if the economy proves slow to recover, Joe Biden may be more likely to respond with large public sector spending programs.
Economic impact of a Biden victory
Higher tax rates and more regulation under Biden would be negative for the growth outlook on their own. However, as with all things economic, it’s never as simple as that.
-
First, the negative impact of tax hikes and increased regulation in the short term could be more than offset by increased infrastructure spending.
-
Second, once in office Biden will likely delay or dampen down his planned tax hikes, given the weak economy.
-
Third, raising taxes on top earners, while a negative for incentive, may help reduce inequality.
-
Fourth, Biden’s trade and foreign policy focused on strengthening ties with allies and a diplomatic approach to China will reduce a source of angst and uncertainty under Trump (which will likely intensify if he is re-elected).
-
Finally, more stable and predictable policy making under Biden may provide a more certain environment for business and so result in increased business investment.
So, I see no reason to expect a weaker economic/investment outlook under Biden beyond near-term uncertainty.
Likely market reaction
Since 1927, the election year has been reasonable for shares with an average total return of 11.2% pa. Of course, this year is complicated by coronavirus & this election comes with greater than normal uncertainty. There are several points to note.
First, the next month or so could see continued volatility and the correction in shares may have further to run:
-
if it’s going Biden’s way investors are likely to fret more about the prospects of higher taxes & regulation, particularly if it looks like Democrats will win control of the Senate;
-
if it’s close and contested it may be a while before the winner is known and markets won’t like the uncertainty; and
-
Trump may also refuse to go peacefully as he’s signalled.
Second, while delays in counting postal votes may mean it takes longer to get a result (which under one scenario could see counting first go in Trump’s favour and then in Biden’s as more postal votes are counted), Trump’s refusal to guarantee to go peacefully should be taken “seriously but not literally” – it’s hard to see him starting a civil war and senior Republicans have not supported him on this with Senate majority leader McConnell saying “there will be an orderly transition just as there has been every four years since 1792.”
Third, if ultimately Trump is the winner, US shares may initially celebrate and outperform global and Australian shares but would be vulnerable next year as the trade war with China ramps up again. By contrast, after an initial negative reaction if Biden wins, for the reasons already noted, there is no reason to expect a weaker economy, and hence share market, under a Biden presidency.
Finally, historically US shares have done best under Democrat presidents with an average return of 14.6% pa since 1927 compared to an average return under Republican presidents of 9.8% pa. The best average result (16.4% pa) has actually occurred when there has been a Democrat president and Republican control of the House, the Senate or both.
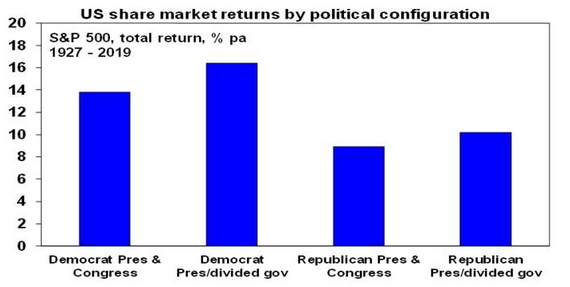
Source: Bloomberg, AMP Capital
Concluding comment
The US election has the potential to create further volatility in investment markets. A Trump victory will mean more of the same and at least initially would probably be more positive for US shares than global and Australian shares (all other things being equal). By contrast a Biden victory may add to short-term volatility but this is likely to be short lived as there is no reason to expect a weaker economy and hence share market under a Biden presidency and he is likely to take a less disruptive approach to trade and foreign policy issues.
Source: AMP Capital 30 September 2020
Important notes: While every care has been taken in the preparation of this article, AMP Capital Investors Limited (ABN 59 001 777 591, AFSL 232497) and AMP Capital Funds Management Limited (ABN 15 159 557 721, AFSL 426455) (AMP Capital) makes no representations or warranties as to the accuracy or completeness of any statement in it including, without limitation, any forecasts. Past performance is not a reliable indicator of future performance. This article has been prepared for the purpose of providing general information, without taking account of any particular investor’s objectives, financial situation or needs. An investor should, before making any investment decisions, consider the appropriateness of the information in this article, and seek professional advice, having regard to the investor’s objectives, financial situation and needs. This article is solely for the use of the party to whom it is provided and must not be provided to any other person or entity without the express written consent of AMP Capital.
Australia’s “eye popping” budget deficit and public debt blow out – can it be paid off? Does it matter?
Much concern has been expressed about the longer-term consequences of the blowout in budget deficits and public debt in response to the economic hit from coronavirus. This is understandable given their scale. In Australia, the Treasurer described the projected budget deficit for this financial year of $185bn as “eye watering”. That’s more than three times
Read MoreFrom “eye watering” to “eye popping”
Much concern has been expressed about the longer-term consequences of the blowout in budget deficits and public debt in response to the economic hit from coronavirus. This is understandable given their scale. In Australia, the Treasurer described the projected budget deficit for this financial year of $185bn as “eye watering”. That’s more than three times the previous record of $54.5bn seen at the time of the GFC and at 9.7% of GDP is the highest since the end of World War 2.

And that was back in July! When the latest update is unveiled in the Budget next month it’s likely to be an “eye-popping” $230bn or so on our estimates, reflecting additional stimulus (including the bring forward of tax cuts, investment incentives, more infrastructure spending and stimulus payments) and the further blow to tax revenue from Victoria’s second wave. And given the ongoing hit to tax revenue and need for more stimulus it’s likely to remain big for several years, even though some of the stimulus payment programs will end once the hit to the economy recedes (we are assuming a vaccine and/or antivirals are successfully deployed next year to control the virus). Our revised budget projections are shown below.
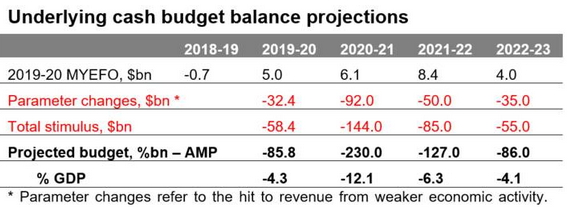
Source: Australian Treasury, AMP Capital
This is likely to see the Federal Government’s gross public debt rise from around 34% of GDP (or $684.3bn) in June to around 54% of GDP (or $1.1trn) in three years’ time.
Our view remains that the Government has done the right thing. Fiscal stimulus has been necessary to protect businesses, jobs and incomes from the impact of the shutdown and associated uncertainty and without it we would be seeing a much bigger hit to the economy and ultimately to the budget and a slower recovery. And further near-term stimulus will be necessary to boost demand. But what about the longer-term consequences? Will the debt ever be paid down? Will fiscal austerity crimp the economy? Or do we live with higher public debt indefinitely?
The post WW2 experience
The current situation is not new. A similar challenge was faced after WW2. During WW2 the Federal Government’s budget deficit increased to a record 27% of GDP as a result of war time expenses. This was more than double the likely peak in the budget deficit this year of around 12% of GDP. See next chart.
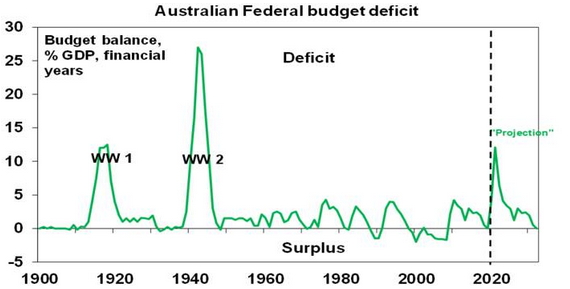
Source: RBA, Australian Treasury, AMP Capital
The huge war time budget deficits saw Federal gross public debt peak at 124% of GDP, which again is likely to far exceed the level it will reach in the years ahead. See next chart.
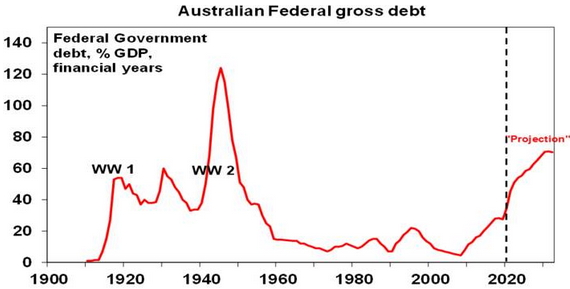
Source: RBA, Australian Treasury, AMP Capital
Interestingly the 1950s and 60s rarely saw balanced budgets let alone surpluses and so debt was not actually paid off. But the ratio of public debt to GDP fell sharply and by the early 1970s had fallen to 7% of GDP. The decline was facilitated by:
-
Low interest rates – between 1946 and 1970 10-year bond yields averaged just 4.5% pa; and
-
Strong nominal economic growth – between 1946 and 1970 nominal GDP growth averaged 10.1% pa.
See the circled area in the next chart.
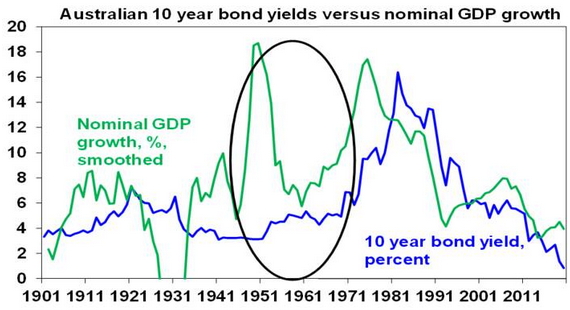
Source: RBA, ABS, AMP Capital
The low interest rates (helped by prudential regulations that forced financial institutions to hold a certain amount of their assets in government bonds) contained the interest burden on the debt and the strong level of nominal growth meant that the debt burden declined relative to the size of the economy.
The strong growth in the nominal economy reflected:
-
Strong real GDP growth – which averaged 4.4% over 1946 to 1970. This in turn reflected a huge increase in the population from the post war baby and immigration booms. Between 1946 & 1970 population growth averaged 2.2%pa. See the circled area in the next chart.
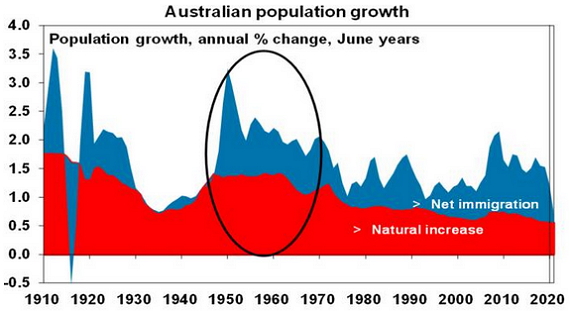
Source: ABS, AMP Capital
-
And protectionist policies were employed to expand Australia’s manufacturing base which in turn helped employ the expanding population and boost productivity.
-
Inflation averaging 5.6% pa over 1946 to 1970 – mainly due to the Korean War boom.
So Australia grew & inflated its way out of its WW2 debt burden.
Can Australia do it again?
The Federal Government has so far ruled out big spending cuts (beyond the eventual ending of pandemic emergency programs) and another deficit levy. And for good reason – if people start anticipating a hike in taxes or cuts to public services they will behave accordingly, and this will endanger the recovery. Rather the Government has emphasised a strategy to boost growth – with the focus likely to be on tax reform, industrial relations reform, education and training, deregulation and increased infrastructure spending. More on this is likely to be announced in the October Budget. However, while these things will help and should be done, it’s doubtful they will get us anywhere near the post war real GDP growth rate of 4.4% pa:
-
Removing niggly taxes like stamp duty will help but to get a big productivity boost from tax reform would require a big shift away from personal and company tax towards the less distortionary GST – and that’s unlikely to get up politically.
-
Much of the low hanging fruit from industrial relations reform and deregulation has likely already been picked.
-
More infrastructure spending will help but it’s hard to see it accelerating much from the boom of recent years.
-
There is no baby boom in prospect and high unemployment will make a quick return to high immigration levels unlikely, so population growth (which this year will be its slowest since 1917) is likely to stay well below pre-covid levels of 1.6% pa, let alone the 2.2% pa seen in the post war era.
-
Finally, while some production of medical essentials may be brought back onshore, a return to full scale protectionism looks unlikely and would be counterproductive anyway.
Higher inflation would help but the RBA has been struggling to achieve that for a while now and high levels of unemployment mean that it is likely still several years away at least.
So, a re-run of the post war experience, which saw the debt burden decline rapidly as growth took off, looks unlikely. The budget and public debt projections in the first two charts above assume the same profile for budget repair from 2023-24 as occurred over the 2010-11 to 2018-19 period, and suggests that budget balance is unlikely until around 2032 by which time Federal public debt may have risen to 70% of GDP or over $2 trillion. Hopefully it doesn’t take that long, but the key point is that based on last decade’s experience we likely have to get used to a long period of high public debt to GDP levels. This is not necessarily a big problem.
First, Japan, Europe and the US have been running high levels of public debt for years now without a major problem. In Japan gross public debt is already in excess of 200% of GDP, in the US its around 130% and Europe its nearly 100%.
Second, Australia’s starting point for net public debt last year was low at 23% of GDP compared with other advanced countries averaging 83%. And even with the projected blow out over the next few years it will still be relatively small. So, it’s not likely to be a drag on Australian assets versus other countries.
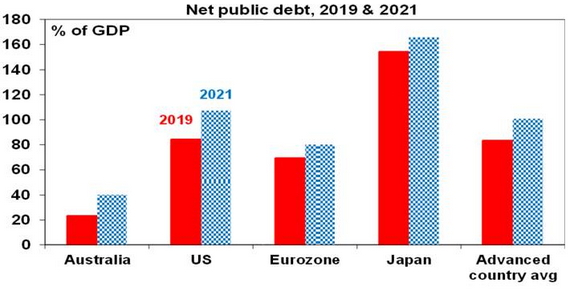
Source: IMF, AMP Capital
Third, one positive versus the post war period is that interest rates are even lower with the Government able to borrow for 10 years at 0.86% and for 3 years at 0.25%. This is well below what nominal economic growth is likely to be and so once budget deficits are reduced could help result in a faster decline in the public debt to GDP ratio than shown in the chart earlier.
Fourth, with Australia borrowing in Australian dollars and not dependent on foreign creditors, Australia is not at risk of a “foreign currency crisis” as a fall in the value of the $A will have no bearing on the Government servicing its debt.
Finally, it’s conceivable that if a problem arose the Government could cancel the bonds the RBA has purchased. This would mean a loss on the value of the government’s investment in the RBA, but it would be offset by a fall in its liabilities. Hence no big impact. The main constraint on this debt monetisation would be if inflation were to take off but that’s still a long way off.
Concluding comment
The bottom line is that the blow out in public debt is a concern and we may have to get used to a long period of relatively high public debt in Australia and in other developed countries. But this won’t necessarily cause a major problem.
Source: AMP Capital 22 September 2020
Important notes: While every care has been taken in the preparation of this article, AMP Capital Investors Limited (ABN 59 001 777 591, AFSL 232497) and AMP Capital Funds Management Limited (ABN 15 159 557 721, AFSL 426455) (AMP Capital) makes no representations or warranties as to the accuracy or completeness of any statement in it including, without limitation, any forecasts. Past performance is not a reliable indicator of future performance. This article has been prepared for the purpose of providing general information, without taking account of any particular investor’s objectives, financial situation or needs. An investor should, before making any investment decisions, consider the appropriateness of the information in this article, and seek professional advice, having regard to the investor’s objectives, financial situation and needs. This article is solely for the use of the party to whom it is provided and must not be provided to any other person or entity without the express written consent of AMP Capital.
Market outlook Q&A – disconnect to real economy, growth v value, vaccines, property, gold, inflation and other issues
In recently presenting a market outlook webinar we received lots of questions about the outlook but were unable to answer them all given time limitations. Here we try and cover the main questions investors have in a simple Q&A format.
Have markets disconnected from the real economy?Not necessarily. Share markets invariably lead the economic cycle. Shares led the coronavirus hit to
Read MoreIn recently presenting a market outlook webinar we received lots of questions about the outlook but were unable to answer them all given time limitations. Here we try and cover the main questions investors have in a simple Q&A format.

Have markets disconnected from the real economy?
Not necessarily. Share markets invariably lead the economic cycle. Shares led the coronavirus hit to the global economy when they plunged 35% into March. The rebound since then reflects the combination of government measures to minimise the economic damage, ultra-low interest rates which have made shares cheap, some slowing in new cases, positive signs for coronavirus treatments and vaccines and a rebound in a range of economic indicators (eg US GDP looks on track to rebound by around 7% this quarter). So, share markets are anticipating better conditions ahead and that economies will be able to withstand an eventual tapering of government support.
US shares are at all-time highs, what is the probability of a big move down versus a continuing rising trend?
Our base case with around 70% probability allows for a short term pullback in the next month or so then rotation away from US shares and relatively expensive technology and health care stocks into non-US shares and cyclical stocks and a continuing rising trend in shares on a 6-12 month view. This note provides our reasoning as to why the trend in shares likely remains up.
Our risk case with 30% probability is that share markets have another sharp leg down in the next few months with possible triggers being bad news regarding coronavirus, a renewed economic downturn, the US election, tensions with China or an unexpected rise in inflation/sharp rise in bond yields. Relatively expensive tech stocks could be at the centre of this.
Markets are often at all-time highs (as shares rise over time) so record levels do not necessarily mean a sharp fall is imminent.
Are technology/growth shares vulnerable to a crash?
The coronavirus shock has given US tech stocks – particularly mega cap names like Facebook, Apple, Amazon, Microsoft, Netflix and Google – and health care stocks a further boost. The tech heavy Nasdaq is up over 30% year to date and nearly 50% over 12 months. Not only have tech stocks been direct beneficiaries of the crises via stronger demand, but growth stocks with their long earnings streams benefit more from lower interest rates. This is different to the 1999/2000 tech boom as Nasdaq’s forward PE is now much lower at 32 times, tech sector earnings are now real and back then most share markets were expensive whereas that is not the case now. But there are several reasons to expect tech and growth stocks to underperform on say a 12 month horizon: their growth may slow as lockdowns ease; they are relatively expensive; interest rates may not fall much further; tech stocks are vulnerable to increased regulation and US/China tensions; and cyclical/value stocks should benefit as global growth recovers.
Will Australian shares continue to lag global shares?
Probably not. The main reason for the underperformance of Australian versus global shares in recent years is the strong outperformance by US shares. They have outperformed global and Australian shares this year and over the last few years. Eg over the last five years US shares returned 14.5%pa versus 7.5%pa for Australian shares. The US share market has a relatively higher exposure to growth stocks whereas non-US and Australian shares have a higher exposure to cyclicals (like industrials, resources & retailers) & financials. As the global economy recovers and interest rates bottom this will likely benefit cyclical sectors and financials and hence see non-US, including Australian shares, outperform. More money printing probably also helped in the US, but this will eventually slow.
How close is a vaccine? What is the market pricing?
We have seen positive news regarding vaccines (that they are safe at least initially and generate immune responses) and various treatments (eg, antivirals like Remdesivir and therapies like Dexamethasone which is a low-cost steroid). The University of Oxford/ AstraZeneca vaccine appears to be most advanced and some are already in production ahead of the completion of Phase 3 tests. However, mass deployment of a vaccine is unlikely until next year and they may not provide complete protection (more like a flu vaccine than a measles vaccine) and so may have to be combined with other treatments. The deployment of vaccines is partly but not fully factored into shares (eg, travel stocks are yet to recover much).
Are investors blind to massive levels of public debt?
Investors are well aware of the surge in public debt flowing from fiscal stimulus, but this is not necessarily as bad as it looks. First, it headed off a bigger hit to the economy and hence an even bigger blow out in public debt. Second, it makes sense for the public sector to borrow from the private sector to support the economy when the latter has cut spending. Third, public sector borrowing costs are ultra-low and often negative. Japan is an example where gross public debt in excess of 200% of GDP has not caused a major problem. It’s also conceivable that if a problem did arise, governments could simply cancel the bonds that their central banks now own (which would mean a loss for the investment in their central bank which is offset by a reduction in their debt liability – and so would have no major impact). Finally, in Australia public debt is relatively low. The real constraint to deficit financing is inflation, but its low.
Are bonds still a defensive asset to shares?
Yes. While bond yields are ultra-low and so offer very low medium-term returns, they are still a good diversifier to shares. For example, while Australian shares have lost about 8% year to date, bonds have returned around 4% and so having them in a portfolio has helped smooth out overall returns.
What tangible benefit is RBA quantitative easing?
The RBA’s use of printed money to boost liquidity in the economy by providing cheap loans to banks and buying bonds is keeping credit flowing and borrowing costs and the $A lower than otherwise. This helps indebted Australian households continue reasonable levels of consumer spending and helps businesses service their loans and employ people.
What is the risk of inflation v deflation?
Depleted inventories of some products (eg home goods & some foods) due to lockdowns and a switch in demand (from holidays & services to home goods) could boost inflation in some areas, but the main risk in the short term is low inflation or deflation due to lots of spare capacity evident in factories and in terms of unemployment keeping a lid on wages growth. This could be the case for one to three years. However, on a medium term view higher inflation is a bigger risk as the extra money being printed by central banks could at some stage be spent, central banks are now taking more risk with inflation and if the coronavirus shock to supply chains results in more production coming back onshore, particularly if protectionism increases.
Why didn’t QE after the GFC in the US boost inflation?
While narrow measures of money supply increased with QE it wasn’t lent out and post GFC fiscal austerity may also have headed off the impact on inflation. The same may happen this time, but huge fiscal stimulus is a big difference this time around so there is greater risk of inflation once spare capacity is used up, but that may be several years away.
Will the US dollar continue to fall?
Probably yes. The $US is a safe haven currency that often goes up in times of global uncertainty and declines when uncertainty abates. This reflects the relatively low cyclical exposure of the US economy. From its March coronavirus driven high the $US has fallen around 10% against major currencies and further downside is likely as the gap between US and global interest rates has collapsed, the $US is expensive, the Fed is printing more money than other central banks & a global recovery will reduce safe haven demand for the US dollar.
What does a falling $US mean for other assets?
A falling $US is a sign that global reflation is working and the global outlook is on the mend. This is positive for: commodity prices because they benefit from stronger global growth and are priced in US dollars; non-US share markets including Australian shares because they are more cyclical; and currencies like the $A. We expect the trend to remain up in the $A towards $US0.80 on a 6-12 month view helped by rising commodities and a return to a positive interest rate differential versus the US.
Should investors have gold & bitcoin?
Gold and bitcoin are expected to rise in value as the $US falls. But this is likely just another cyclical fall in the value of the $US rather than a sign of a new crisis – particularly with commodity prices rising too, which is a sign of stronger, not weaker, global growth. There may be a case for gold and bitcoin as a hedge against inflation but it makes more sense to have a well-diversified commodity exposure, neither gold or bitcoin produce any income which makes them very hard to value and there are lots of crypto currencies competing with bitcoin so their supply is unlimited. So, I am not really a gold or bitcoin bug!
What is the outlook for commercial property?
The hit to economic activity and specifically traditional bricks and mortar retail space demand and office space demand (following the surge in online retailing and working from home) and hence rents from the virus will weigh heavily on near term returns from retail and office property. Industrial property is a big beneficiary though. All will benefit from the continuation of low interest rates & the search for yield beyond the short term.
Why COVID might result in more Europe, not less?
The coronavirus shock had the potential to expose fault lines in Europe, but so far, its brought it closer together with the ECB’s latest QE program buying member nation’s bonds on the basis of need rather than some formula based on their weight in the Eurozone and agreement on a €750bn recovery fund much of which will be financed by the common issuance of bonds (which sounds like a step towards a common fiscal policy).
What impact might the US election have?
Shares tend to prefer incumbents and so with 87% accuracy since 1928 a rise in US shares in the 3 months prior to the election would point to a victory by Trump; but a fall would point to Biden. Trump’s low tax policies & antagonistic policies to China and to a lesser degree Europe and Japan would favour US over non-US shares and vice versa for a Biden victory. Historically though, US shares have performed best under a Democrat president with a divided Congress and second best under a Democrat clean sweep (see this note) and I see no reason to expect otherwise should Biden achieve the same, albeit markets may initially sell off. Of course, a contested election result would also cause short term uncertainty.
What is the risk of increased tensions with China?
Trump is trying to appear strong on China for political reasons ahead of the election as he knows there is votes in it; but does not want to go so far as to threaten the US economic recovery with say more tariffs and China is biding its time. What happens next year will depend on who wins the US election. Trump will potentially ramp conflict up in a way that could impact markets (although direct military conflict is unlikely) with trade, Taiwan and the South China Sea being the key issues to watch. Biden would likely take a more diplomatic approach.
If Australian house prices fall, what would it mean for banks?
A 10-15% fall (our expectation) is manageable and the associated rise in bad debts has already been provisioned by the banks. A 20% fall would likely mean more trouble for them.
When will the Australian economy recover?
Australia’s economy fell by -7% in the June quarter, or -6.3% over the year to June which is the biggest annual fall since the Great Depression. However, the June quarter fall was less than seen in most other comparable countries (eg, the US fell -9.1%, Japan -7.8%, Europe -12.1% and the UK -20.4%) thanks to better virus control, better policy stimulus & exposure to China. Most of Australia is already slowly recovering, but Victoria has been hard hit by its second virus wave which will likely delay a national recovery out to the December quarter.
Source: AMP Capital 03 September 2020
Important notes: While every care has been taken in the preparation of this article, AMP Capital Investors Limited (ABN 59 001 777 591, AFSL 232497) and AMP Capital Funds Management Limited (ABN 15 159 557 721, AFSL 426455) (AMP Capital) makes no representations or warranties as to the accuracy or completeness of any statement in it including, without limitation, any forecasts. Past performance is not a reliable indicator of future performance. This article has been prepared for the purpose of providing general information, without taking account of any particular investor’s objectives, financial situation or needs. An investor should, before making any investment decisions, consider the appropriateness of the information in this article, and seek professional advice, having regard to the investor’s objectives, financial situation and needs. This article is solely for the use of the party to whom it is provided and must not be provided to any other person or entity without the express written consent of AMP Capital.
Seven reasons why the trend in shares will likely remain up, albeit with bumps along the way
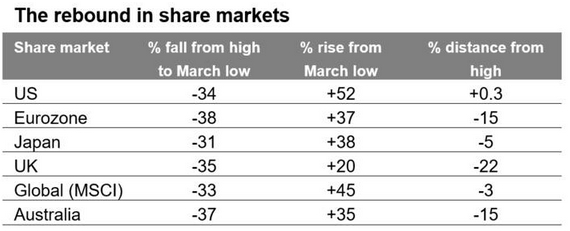
Share markets have had a spectacular rebound from their March lows. The rebound has been led by the US share market which is up 52% and has just risen above its February record high, making it the fastest recovery after a 30% or more fall on record. Other share markets have lagged but are still well up from their lows.
Read More
Share markets have had a spectacular rebound from their March lows. The rebound has been led by the US share market which is up 52% and has just risen above its February record high, making it the fastest recovery after a 30% or more fall on record. Other share markets have lagged but are still well up from their lows. This includes the Australian share market which recently rose to its highest level since early March.
Source: Bloomberg, AMP Capital
A common concern remains that the rebound is irrational. How can shares be so strong when June quarter GDP collapsed – by an average of -10% in developed countries and an estimated -7% in Australia – and coronavirus continues to reap havoc?
But as the investor Sir John Templeton once said: “bull markets are born on pessimism, grow on scepticism, mature on optimism and die of euphoria” and we have certainly seen the run up since March occur against the backdrop of a lot of pessimism. The plunge in shares into March led the coronavirus hit on the way down and surprised many at the severity of the fall and now it’s led on the way up despite lots of worries. It’s also worth noting that shares have spent much of the period since early June rangebound (and apart from the US share market, many still are) and this has helped correct the excessive speed of the run up into June that left shares technically overbought & due for a consolidation or correction.
More fundamentally though, the positives for shares continue to outweigh the negatives. Let’s start with the negatives.
The negatives
Several negatives continue to hang over shares and are often cited as the main reason to expect sharp falls ahead.
-
First, coronavirus has yet to come under control globally, particularly in emerging countries, and most developed countries have seen second waves. This poses the threat of a return to debilitating lockdowns and people behaving more cautiously. So far it’s seen the global reopening stall. In Victoria it’s been reversed, which will likely delay the recovery in Australian GDP into the December quarter.
-
Second, this is occurring at a time of a massive hit to economic activity and profits, and very high underlying unemployment. The US June quarter earnings reporting season saw earnings fall 32% year on year and 2019-20 earnings in Australia are expected to have fallen 22%, resulting in the worst slump since the 1990s recession, with 67% of companies to have reported June half earnings so far seeing a decline in earnings and 56% cutting dividends.
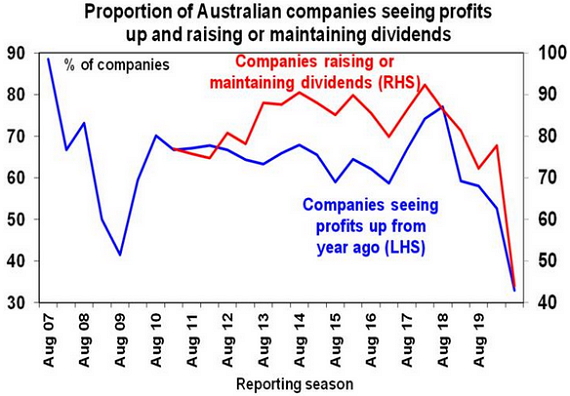
Source: AMP Capital
-
Third, the recovery going forward may be slow as some things will take longer to recover (eg, travel), some things may never fully come back (eg, a big shift to on-line shopping, working from home, education & health care) and businesses will use the uncertainty to accelerate cost savings. All of which will mean a long tail of unemployment and economic activity below its pre-coronavirus path.
-
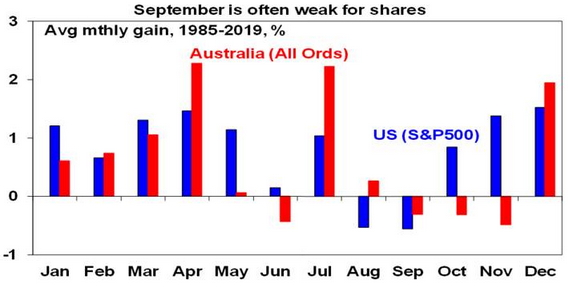
Fourth, we are now in a seasonally weak time of the year for shares, with August and September being the weakest months of the year on average for US shares. And consistent with this, the recent rise in the US share market to new highs has come on narrow participation amongst stocks suggesting the risk of another short-term correction.
-
Fifth, the run up to the US election has the potential to drive increased share market volatility if it looks likely that Biden will win and raise taxes, and if Trump decides he has nothing to lose and ramps up tensions with China & Europe.
-
Finally, shares are expensive on traditional metrics like PEs and more esoteric measures like the ratio of share market capitalisation to GDP and the market value of companies relative to the book value of their assets.
The positives
However, there are a bunch of positives providing an offset.
-
First, the second wave of new coronavirus cases in developed countries has been far less deadly than the first. This likely reflects more young people being infected, better testing, better protections for older people and better treatments. This in turn has seen most countries avoid a return to a full lockdown and limited the hit to confidence.

Source: ourworldindata.org; AMP Capital
-
A decline in new cases in the US has enabled the recovery there in high-frequency economic indicators like credit card spending and mobility to resume after a pause in July.
-
Second, there has been good progress in terms of vaccines and treatments. Several vaccines have seen promising results and are in Phase 3 trials to see if they provide protection. Note though that mass deployment is unlikely till next year & they may not provide complete protection (more like a flu vaccine than a measles vaccine) and may have to be combined with treatments (of which there has also been positive developments with Remdesivir and a steroid).
-
Third, easy monetary and fiscal policy is continuing to support economies, incomes and jobs in contrast to the situation when the first wave started in developed countries in late February. This is different to normal recessions where it takes longer for policy makers to swing into action.
-
Fourth, the fall in the “safe haven” US dollar and rising commodity prices (with metal prices back to their pre-coronavirus levels) is a sign of global reflation and recovery.
-
Fifth, a range of economic indicators have seen a Deep V rebound starting in China and then in developed countries, suggesting significant pent up demand and that people still want to spend. This is most evident in business conditions PMIs. While developed country PMIs were mixed in August (with Australia and Europe down, Japan flat and the US and UK up) they remain consistent with recovery and have enabled share markets to look through the June quarter slump in earnings (which itself has been less bad than feared). On balance we see a gradual economic recovery from here as some things take longer to return to normal.
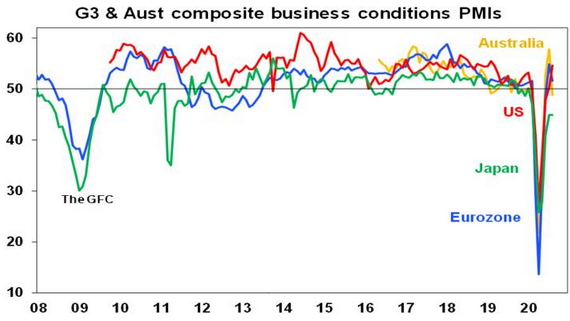
Source: Bloomberg, AMP Capital
-
Sixth, the plunge in interest rates and bond yields have increased the present value of shares, which explains why PE ratios are so high. So shares remain attractive despite lower earnings and dividends because the alternatives like bank deposit rates are even less attractive.
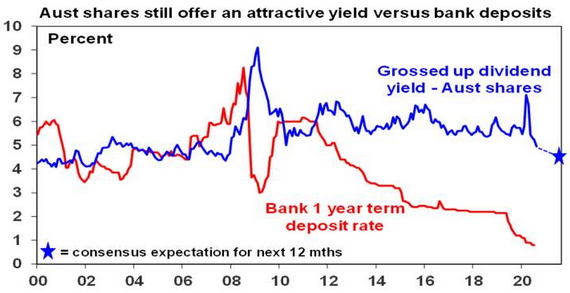
Source: RBA; Bloomberg, AMP Capital
-
Finally, investors are still cautious which is positive from a contrarian perspective. Despite day traders piling into some stocks retail investor sentiment is soft & there has continued to be fund flows out of equities in the US into bonds.
Concluding comment
On balance the positives dominate in our view. Shares remain vulnerable to short-term setbacks given uncertainties around coronavirus, the speed of economic recovery, the US election and US/China tensions. But the positives should keep any pull back to being a correction and on a 6 to 12-month view shares are expected to see reasonable returns.
But will the US share market continue to outperform?
As evident in the first table, US shares have outperformed since the March low. They have also outperformed year to date with US shares up 5.2%, but Eurozone shares down 13%, Japanese shares down 3.1% & Australian shares down 8.5%. The strong outperformance by the US share market reflects its relatively low exposure to cyclical sectors (like manufacturing, materials & financials) that were hit hard by coronavirus and a greater exposure to growth sectors like IT and health that benefit from coronavirus and very low interest rates. As the global economy gradually recovers and interest rates bottom, this will benefit cyclical sectors relative to IT and health which have become expensive and this will likely see US shares underperform relative to non-US shares, including Australian shares.
In terms of the US election, a Trump victory would likely benefit US shares (tax hikes averted) but a Biden victory would benefit non-US shares (more harmonious foreign and trade relations).
Source: AMP Capital 25 August 2020
Important notes: While every care has been taken in the preparation of this article, AMP Capital Investors Limited (ABN 59 001 777 591, AFSL 232497) and AMP Capital Funds Management Limited (ABN 15 159 557 721, AFSL 426455) (AMP Capital) makes no representations or warranties as to the accuracy or completeness of any statement in it including, without limitation, any forecasts. Past performance is not a reliable indicator of future performance. This article has been prepared for the purpose of providing general information, without taking account of any particular investor’s objectives, financial situation or needs. An investor should, before making any investment decisions, consider the appropriateness of the information in this article, and seek professional advice, having regard to the investor’s objectives, financial situation and needs. This article is solely for the use of the party to whom it is provided and must not be provided to any other person or entity without the express written consent of AMP Capital.

