

Olivers Insights
Shares climb a “wall of worry” – but is it sustainable?
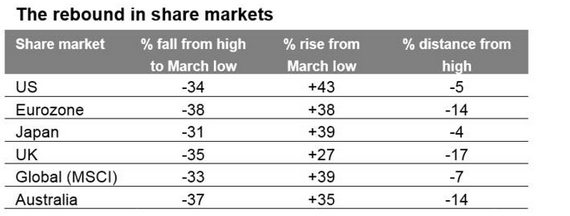
After a roughly 35% plunge from their February high point to their lows around 23 March on fears regarding of global recession on the back of the coronavirus shutdowns, share markets have since rebounded sharply, led by US shares. The rally has pushed the Australian ASX 200 back through 6000 for the first time since March.
Source: Bloomberg, AMP Capital
A common
Read More
After a roughly 35% plunge from their February high point to their lows around 23 March on fears regarding of global recession on the back of the coronavirus shutdowns, share markets have since rebounded sharply, led by US shares. The rally has pushed the Australian ASX 200 back through 6000 for the first time since March.
Source: Bloomberg, AMP Capital
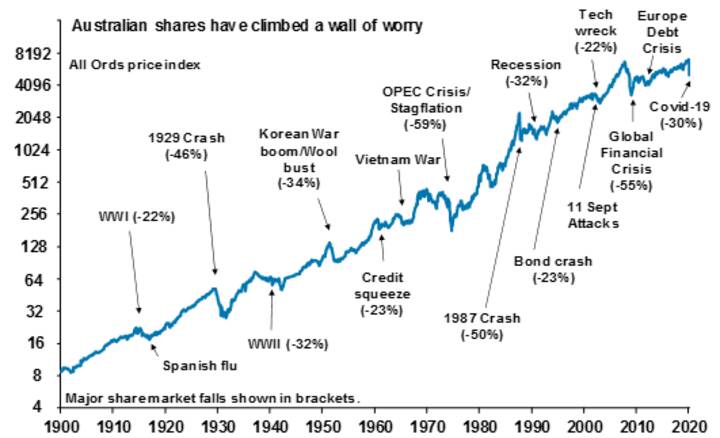
A common concern is that the rebound in share markets is “too optimistic” and “irrational” – how can share markets rebound so rapidly when economic conditions are so weak, coronavirus uncertainty remains high, the US is seeing civil unrest and US/China tensions are rising? I must admit that I have also been surprised by the speed of the rebound and think maybe the markets are ahead of themselves. But I have seen this happen before and it reminds me of the quotation from the investor Sir John Templeton “bull markets are born on pessimism, grow on scepticism, mature on optimism and die of euphoria” as this rally has occurred against a lot of pessimism with shares climbing a wall of worry. But as the quote reminds us, that’s what they often do. The plunge in shares into March led the coronavirus hit to activity & fear of recession on the way down and in the process surprised many at the severity of the fall and now it’s led on the way up despite still lots of worries.
Key drivers of the rally
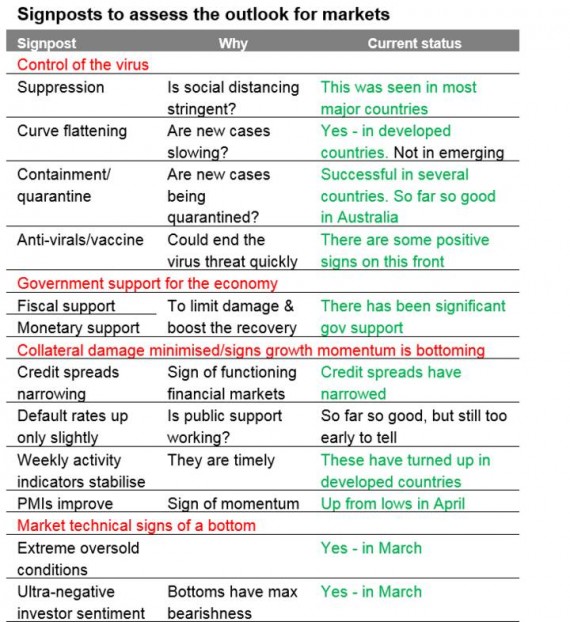
So what’s driven the rally? In early April we listed signposts to watch as to whether shares have bottomed. The key signposts are updated in this table.
Source: AMP Capital
Virtually all of the signposts now tick off positively for developed countries. These are highlighted in green. So, put simply the rebound in shares has been driven by a combination of:
-
Falling new coronavirus cases in developed countries.
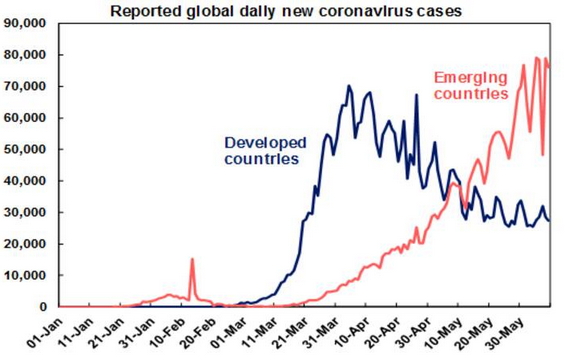
Source: ourworldindata.org, AMP Capital
-
Positive news regarding anti-virals and vaccines.
-
The reopening of developed countries as lockdown measures have been eased. This includes Australia which has gone from mildly severe lockdown to intermediate.
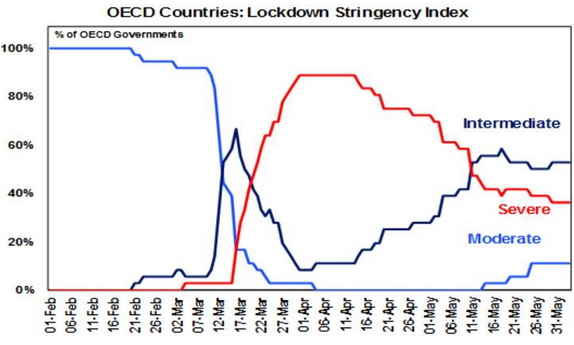
Source: Oxford University, AMP Capital
-
Massive fiscal and monetary support measures which have swamped those seen in the GFC. This has helped preserve businesses, jobs and incomes preventing defaults. Low interest rates also help make shares attractive for investors.
-
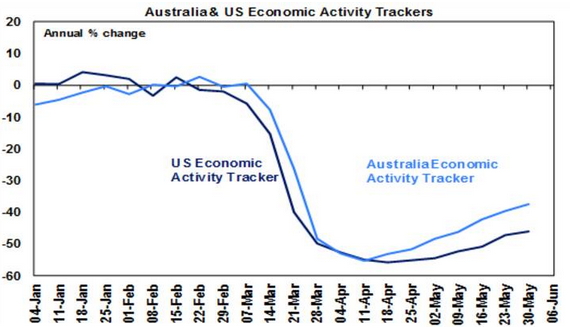
Green shoots of recovery. With the progressive relaxation of lockdowns, timely measures of economic data such as consumer confidence, restaurant bookings, retail foot traffic, credit card data, mobility indexes and jobs data suggest that US and Australian economic activity bottomed in April. See the next chart. Global business conditions indicators often referred to as PMIs also started to turn up in May after a plunge into April. This follows a similar pattern in China.
Source: AMP Capital
-
Investors being pessimistic and underweight shares after the plunge in March. This has meant there has been more investors who can be motivated to buy shares than sell.
These considerations have simply swamped concerns about civil unrest in the US (which now appears to be settling down anyway) and US-China tensions.
Confirmation from other markets
It’s not just shares that have rebounded as the rally has been confirmed by other growth sensitive assets/yields. In particular:
-
Oil and metal prices are up sharply from their lows.
-
Commodity currencies like the $A have rebounded at the same time that the safe haven US dollar has fallen.
-
Bond yield have lagged the upswing in share markets, but they have now started to rise, albeit they remain very low.
So why has the US share market led on the way up?
The US share market has a relative high exposure to tech and health care stocks that have been key beneficiaries of the coronavirus shock, Amazon is now 55% of retail stocks’ market capitalisation and the US has also seen more money printing or QE by the Fed compared to other countries including Australia. By contrast, non-US and Australian shares are more cyclical – but should start to benefit as the recovery continues.
Correction risk
After huge rallies most shares are technically overbought which could mean we see a correction over the next few months. But many shares in many share markets are at overbought extremes often seen in the aftermath of major bear market lows and this augurs well for returns on a 6-12 basis.
But what about the slump in earnings?
Earnings are taking a big hit from the impact to economic activity and this has seen earnings estimates slump and price to earnings multiples surge. This is clearly a concern but note a typical “cyclical” rebound in shares goes through three phases.
-
Phase 1 sees an unwinding of cheap valuations helped by easy monetary conditions but with receding downside risks causing some investors to snap up undervalued shares. This is the phase where shares climb a “wall of worry”.
-
Phase 2 is driven by strengthening profits.
-
Phase 3 sees euphoria with very bullish investors pushing shares to extreme levels. This is despite shares becoming expensive and central banks raising interest rates.
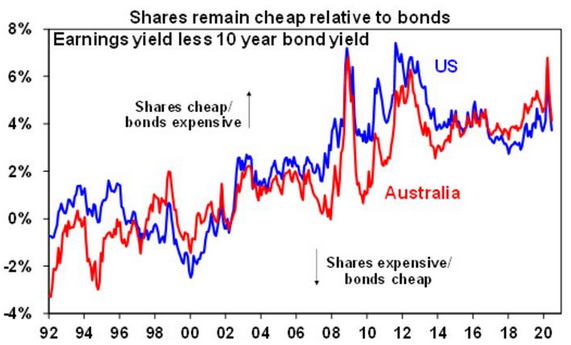
Right now, we are nearing the end of Phase 1. As economic conditions recover profits are likely to strengthen and we will move into Phase 2. While PEs are now high, it’s noteworthy that the equity risk premium which can be crudely measured as the gap between earnings yields (using forward earnings) and bond yields is still reasonable reflecting ultra-low bond yields. But an improvement in earnings will be a key thing to watch for.
Source: Thomson Reuters, AMP Capital
What are the key risks?
The three big risks are: a second wave of coronavirus cases (which should be able to be avoided with lots of testing, tracking and quarantining and even if it does occur may not have the same negative economic impact as any renewed lockdown is likely to be milder and deaths are likely to be lower given greater preparedness); collateral damage from the shutdowns resulting in a delayed or very slow recovery as bankruptcies surge and unemployment goes higher (so far so good – with government and central bank support hopefully heading this off); and risks around the US election (such as Trump ramping up tensions with China if he feels he has nothing to lose or investors fretting about higher taxes and more regulation under a Democrat victory across the Presidency, House and Senate).
Concluding comment
Shares are vulnerable to a short-term consolidation or pullback. But if we are right and April was the low in economic conditions then shares are likely to be higher on a 6 to 12-month horizon. The experience of the last few months highlights just how hard it is to time market bottoms – a good approach for long-term investors is to average in over several months after major falls.
Source: AMP Capital 10 June 2020
Important notes: While every care has been taken in the preparation of this article, AMP Capital Investors Limited (ABN 59 001 777 591, AFSL 232497) and AMP Capital Funds Management Limited (ABN 15 159 557 721, AFSL 426455) (AMP Capital) makes no representations or warranties as to the accuracy or completeness of any statement in it including, without limitation, any forecasts. Past performance is not a reliable indicator of future performance. This article has been prepared for the purpose of providing general information, without taking account of any particular investor’s objectives, financial situation or needs. An investor should, before making any investment decisions, consider the appropriateness of the information in this article, and seek professional advice, having regard to the investor’s objectives, financial situation and needs. This article is solely for the use of the party to whom it is provided and must not be provided to any other person or entity without the express written consent of AMP Capital.
The threat to Australian house prices from Coronavirus
The Australian housing market was boosted from mid-last year by the combination of the Federal election removing the threat of changes to negative gearing and capital gains tax, rate cuts and regulatory easing. So, after a 10% drop in average capital city prices into mid last year – the biggest fall in property prices for at least 40 years –
Read MoreThe Australian housing market was boosted from mid-last year by the combination of the Federal election removing the threat of changes to negative gearing and capital gains tax, rate cuts and regulatory easing. So, after a 10% drop in average capital city prices into mid last year – the biggest fall in property prices for at least 40 years – they have since rebounded by 9%. Our assessment was that price increases would slow from the pace seen since mid-year, but that the combination of low rates, solid population growth and the fear of missing out would still see solid price growth this year.

However, the coronavirus pandemic & associated shutdowns to economic activity now poses a significant threat to the outlook for property prices. The question is how big the threat is?
Social distancing will likely delay property transactions
The absence of many Chinese buyers flowing from travel bans appears to have had little impact on property demand with clearance rates remaining strong in February.
click to enlarge

Source: Domain, AMP Capital
However, auction clearance rates and sales momentum are showing some signs of slowing this month. This may reflect an increasing desire on the part of buyers and sellers to put property transactions on hold to avoid being exposed to the virus unnecessarily. Social distancing policies will only intensify this. On its own this may crash transactions but may just flatten price gains.
Recession is the big threat
However, it’s the likely recession that we have now entered due to coronavirus related shutdowns that imposes the big risk. We expect at least two negative quarters of GDP growth in the March and June quarters with the risk that the September quarter is also negative. And the contraction could be deep because big chunks of the economy will be largely shut – tourism, travel, and entertainment with a severe flow on to parts of retailing. The toilet paper, sanitiser and canned/frozen food boom may help supermarkets for a while – but as Deutsche Bank recently calculated for every $1 spent on such items there is $15 spent on things that are vulnerable to social distancing.
Past large share market falls have seen a mixed impact on property prices. The 1987 50% share market crash actually boosted home prices as investors switched from shares to property. But the key is what happens to unemployment as this often forces sales and crimps demand. Back in 1987 the economy remained strong and unemployment fell but the recessions of the early 1980s and early 1990s saw falls in average national capital city home prices of 8.7% and 6.2% respectively as unemployment rose. The GFC share market fall of 55% also saw a 7.6% home price fall, even though it wasn’t a recession, because unemployment rose from 4% to nearly 6%.
click to enlarge

Source: Core Logic, AMP Capital
So, a lot depends on how deep the recession is and how far unemployment rises. Our base case is for a rise in unemployment to around 7.5% which is likely to drive a 5% or so dip in prices ahead of a property market recovery into next year as the economy bounces back and pent up demand is unleashed again helped by ultra-low interest rates. Government and RBA measures to help struggling businesses and households through the coronavirus shutdown should help in preventing a really big rise in unemployment.
However, if the recession turns out to be long – pushing unemployment to say 10% or more – then this risks tripping up the underlying vulnerability of the Australian housing market flowing from high household debt levels and high house prices. The surge in prices relative to incomes (and rents) over the last two decades has gone hand in hand with a surge in household debt relative to income that has taken Australia from the low end of OECD countries to the high end.
click to enlarge

Source: OECD, RBA, AMP Capital
This is nothing new and we have long described it as Australia’s Achilles’ heel. Some things have given us a bit of confidence in recent times prices won’t just crash spontaneously.
-
First, the property market has been chronically undersupplied. Annual population growth since mid-last decade has averaged 373,000 people compared to 217,000 over the decade to 2005, which requires roughly an extra 75,000 homes per year. Unfortunately, the supply of dwellings did not keep pace with the population surge (next chart) so a massive shortfall built up driving high home prices. Thanks to the surge in unit supply since 2015 this has been reduced but capital city vacancy rates are still around their long-term average indicating a lack of over supply, although Sydney may be more at risk.
click to enlarge

Source: ABS, AMP Capital
click to enlarge

Source: REIA, AMP Capital
-
Second, talk of mortgage stress has been overstated. Despite some seeing negative equity into mid-last year and a significant proportion of borrowers switching from interest only to principle & interest loans over the last few years (which has seen interest only loans drop from nearly 40% of all loans to 18%) there has been no surge in forced sales and non-performing loans. While Australia saw a deterioration in lending standards with the last boom, it was nothing like other countries saw prior to the GFC. Much of the increase in debt has gone to older, wealthier Australians, who are better able to service their loans.
click to enlarge

Source: APRA, AMP Capital
We have always concluded that the combination of high prices and debt on their own won’t trigger a major crash in prices unless there are much higher interest rates or a recession. Unfortunately, we are now facing down the barrel of the latter. A sharp rise in unemployment to say 10% or beyond risks resulting in a spike in debt servicing problems, forced sales and sharply falling prices. This could then feedback to weaken the broader economy as falling home prices lead to less spending and a further rise in unemployment and more defaults and so on. This scenario could see prices fall 20% or so.
Bear in mind though that part of this would just be a reversal of the 9% bounce in average capital city prices seen since mid-last year.
It’s also not our base case but it highlights why governments and the RBA really have to work hard to avoid letting the virus cause a lot of company failures, surging unemployment and household defaults.
Source: AMP Capital 19 March 2020
Important notes: While every care has been taken in the preparation of this article, AMP Capital Investors Limited (ABN 59 001 777 591, AFSL 232497) and AMP Capital Funds Management Limited (ABN 15 159 557 721, AFSL 426455) (AMP Capital) makes no representations or warranties as to the accuracy or completeness of any statement in it including, without limitation, any forecasts. Past performance is not a reliable indicator of future performance. This article has been prepared for the purpose of providing general information, without taking account of any particular investor’s objectives, financial situation or needs. An investor should, before making any investment decisions, consider the appropriateness of the information in this article, and seek professional advice, having regard to the investor’s objectives, financial situation and needs. This article is solely for the use of the party to whom it is provided and must not be provided to any other person or entity without the express written consent of AMP Capital.
Five charts on investing to keep in mind in rough times like these
The coronavirus crisis is first and foremost a human crisis and my thoughts are particularly with those on the front line of this battle. But, of course, its impacting many aspects of life at present, including investment markets. Successful investing can be really difficult in times like the present when markets have collapsed into a bear market with falls globally
Read MoreThe coronavirus crisis is first and foremost a human crisis and my thoughts are particularly with those on the front line of this battle. But, of course, its impacting many aspects of life at present, including investment markets. Successful investing can be really difficult in times like the present when markets have collapsed into a bear market with falls globally of around 30% from their highs amidst immense uncertainty about the economic hit from coronavirus and how much policy stimulus and central bank support can head off collateral damage and boost an eventual recovery. Trying to work this out is driving huge volatility in investment markets making it very easy for short term traders to get whipsawed. I will be the first to admit that my crystal ball is even hazier than normal right now. As the US economist, JK Galbraith once said “there are two types of economists – those that don’t know and those that don’t know they don’t know.” And this is certainly an environment where much is unknown.

But while history does not repeat in that each cycle is different it does rhyme in that each has many common characteristics. So, while we haven’t seen a pandemic driven bear market before the basic principles of investing have not changed. This note revisits five charts I find particularly useful in times of stress.
Chart #1 The power of compound interest
This is my favourite chart. It shows the value of $1 invested in various Australian assets in 1900 allowing for the reinvestment of dividends and interest along the way. That $1 would have grown to $242 if invested in cash, to $1017 if invested in bonds and to $481,910 if invested in shares. While the average return since 1900 is only double that in shares relative to bonds, the huge difference between the two at the end owes to the impact of compounding – or earning returns on top of returns. So, any interest or return earned in one period is added to the original investment so that it all earns a return in the next period. And so on. I only have Australian residential property data back to 1926 but out of interest it shows (on average!) similar long term compounded returns to shares.
click to enlarge

Source: Bloomberg, AMP Capital
Key message: to grow our wealth, we must have exposure to growth assets like shares and property. While shares have collapsed lately amidst massive coronavirus uncertainty and the short-term outlook for Australian housing is vulnerable too, both will likely do well over the long-term.
Chart #2 Don’t get blown off by cyclical swings
The trouble is that shares can have lots of setbacks along the way as is evident during the periods highlighted by the arrows on the previous chart. Just like now. Even annual returns in the share market are highly volatile, but longer-term returns tend to be solid and relatively smooth as can be seen in the next chart. Since 1900, for Australian shares roughly two years out of ten have had negative returns but there are no negative returns over rolling 20-year periods.
click to enlarge

Source: Bloomberg, AMP Capital
The higher returns shares produce over time relative to cash and bonds is compensation for the periodic setbacks they have. But understanding that these periodic setbacks are just an inevitable part of investing is important in being able to stay the course and get the benefit of the higher long-term returns shares and other growth assets provide over time.
Key message: short-term sometimes violent swings in share markets are a fact of life but the longer the time horizon, the greater the chance your investments will meet their goals. So, in investing, time is on your side and it’s best to invest for the long-term when you can.
Chart #3 The roller coaster of investor emotion
It’s well known that the swings in investment markets are more than can be justified by moves in investment fundamentals alone – like profits, dividends, rents and interest rates. This is because investor emotion plays a huge part. This has been more than evident over the past few weeks. The next chart shows the roller coaster that investor emotion traces through the course of an investment cycle. Once a cycle turns down in a bear market, euphoria gives way to anxiety, denial, capitulation and ultimately depression at which point the asset class is under-loved and undervalued and everyone who is going to sell has – and it becomes vulnerable to good (or less bad) news. This is the point of maximum opportunity. Once the cycle turns up again, depression gives way to hope and optimism before eventually seeing euphoria again.
The roller coaster of investor emotion
click to enlarge

Source: Russell Investments, AMP Capital
Key message: investor emotion plays a huge role in magnifying the swings in investment markets. The key for investors is not to get sucked into this emotional roller coaster. Of course, doing this is easier said than done which is why many investors end up getting wrong footed by the investment cycle.
Chart #4 The wall of worry
There is always something for investors to worry about. And in a world where social media is competing intensely with old media it all seems more magnified and worrying. This is arguably evident now in relation to coronavirus uncertainty. The global economy has had plenty of worries over the last century, but it got over them with Australian shares returning 11.5% per annum since 1900, with a broad rising trend in the All Ords price index as can be seen in the next chart, and US shares returning 9.6% pa. (Note that this chart shows the All Ords share price index whereas the first chart shows the value of $1 invested in the All Ords accumulation index, which allows for changes in share prices and dividends.)
Key message: worries are normal around the economy and investments and sometimes they become intense – like now. But they eventually pass. For example, back in mid-January it seemed the bushfires, smoke shrouding our cities and regular news of homes and lives lost would never end. But when I went to regional NSW in the last week it was lovely, green and wet. And so, it is with coronavirus – this too will pass eventually.
click to enlarge
Source: ASX, AMP Capital
Chart #5 Timing is hard
The temptation to time markets is immense. With the benefit of hindsight many swings in markets like the tech boom and bust and the GFC look inevitable and hence forecastable and so it’s natural to think why not switch between say cash and shares within your super to anticipate market moves. This is particularly the case in times of emotional stress like now when all the news around coronavirus and its impact on the economy is bad. Fair enough if you have a process and put the effort in. But without a tried and tested market timing process, trying to time the market is difficult. A good way to demonstrate this is with a comparison of returns if an investor is fully invested in shares versus missing out on the best (or worst) days. The next chart shows that if you were fully invested in Australian shares from January 1995, you would have returned 8% pa (with dividends but not allowing for franking credits, tax and fees).
click to enlarge

Covers Jan 1995 to 17 March 2020. Source: Bloomberg, AMP Capital
If by trying to time the market you avoided the 10 worst days (yellow bars), you would have boosted your return to 11% pa. And if you avoided the 40 worst days, it would have been boosted to 15.8% pa! But this is very hard, and many investors only get out after the bad returns have occurred, just in time to miss some of the best days. For example, if by trying to time the market you miss the 10 best days (blue bars), the return falls to 6.1% pa. If you miss the 40 best days, it drops to just 2.2% pa.
Key message: trying to time the share market is not easy.
Source: AMP Capital 17 March 2020
Important notes: While every care has been taken in the preparation of this article, AMP Capital Investors Limited (ABN 59 001 777 591, AFSL 232497) and AMP Capital Funds Management Limited (ABN 15 159 557 721, AFSL 426455) (AMP Capital) makes no representations or warranties as to the accuracy or completeness of any statement in it including, without limitation, any forecasts. Past performance is not a reliable indicator of future performance. This article has been prepared for the purpose of providing general information, without taking account of any particular investor’s objectives, financial situation or needs. An investor should, before making any investment decisions, consider the appropriateness of the information in this article, and seek professional advice, having regard to the investor’s objectives, financial situation and needs. This article is solely for the use of the party to whom it is provided and must not be provided to any other person or entity without the express written consent of AMP Capital.
The increasing economic threat from Coronavirus – what to watch for and what should investors do
Coronavirus continues to rattle investment markets as the number of new cases outside China continues to rise posing increasing uncertainty over the impact on economic activity. And its impact has intensified following the collapse of OPEC discipline causing a further plunge in oil prices raising concerns about debt servicing for oil producers. From their highs global shares and Australian shares
Read More
Introduction
Coronavirus continues to rattle investment markets as the number of new cases outside China continues to rise posing increasing uncertainty over the impact on economic activity. And its impact has intensified following the collapse of OPEC discipline causing a further plunge in oil prices raising concerns about debt servicing for oil producers. From their highs global shares and Australian shares have had a fall of around 20%.

Source: PRC National Health Commission, Bloomberg, AMP Capital
Given the extreme uncertainty this note looks at various scenarios in relation to global and Australian economic growth and what signposts to look at in relation to how it may unfold.
Much ado about nothing or a major global catastrophe
It seems there are two extreme views on coronavirus. Some see it as just a bad flu and can’t see what the fuss is all about. Others think that it will trigger a major humanitarian and economic catastrophe killing millions and triggering a major global recession as excessive leverage is finally exposed. The optimist in me wants to lean to the former:
-
So far over 114,000 people are reported to have contracted the virus of which nearly 4000 have died. Of course, this number is still growing but in China where the number of new cases has collapsed (see the first chart) the number is 80,754 cases and 3136 deaths. In the 2017-18 US flu season alone 44.8m Americans got sick and 61,099 died.
-
The actual death rate from Covid-19 may be 1% or lower, rather than the currently reported rate of 3.5% because many of those who get the virus don’t get sick enough to seek medical help and so won’t be included in the case count. The Diamond Princess episode may provide a rough guide – all 3711 passengers and crew have been tested with 705 contracting the virus of which seven have died and most of those are believed to have been over 70. This would suggest a death rate of around 1% which is only just above that for regular flu for those over 65.
-
It appears to be less contagious than regular flu.
-
China’s experience shows it can be contained. Maybe this is due to extreme containment measures in Hubei that are not possible in other countries. But the case count in the rest of China has also been contained with less extreme measures and Singapore and Hong Kong have had some success in slowing new cases without extreme quarantining

Source: PRC National Health Commission, Bloomberg, AMP Capital
-
Alternatively, at some point authorities outside China may just conclude that containment is impossible and, as the death rate is not apocalyptic, shift from containment to just treating those who get very sick. This could enable life to return to normal, albeit with a change in behaviour – less handshaking, frequent handwashing and wearing a mask.
But I also must concede I just don’t know. There is much that is unknown about the virus itself and how long it will continue to spread. And even if there is a switch to just treating the very sick it’s unclear there will be enough hospital beds. And there is also the human or behavioural overlay which is intensifying the economic impact. Just look at the toilet paper frenzy to see that this can have a real economic effect even before the virus has really taken hold in Australia. While there may be a boom in demand for hand sanitisers, toilet paper and long-life food, this will be a temporary boost as the spread of the virus globally and the disruption that containment measures are causing is continuing to increase the risk of a longer and deeper hit to economic activity. And there is a risk of secondary effects as the short-term disruption risks leading to business failures and households defaulting on their debts if they can’t keep up their payments and so causing a deeper impact on economic activity. The secondary effects of the coronavirus outbreak and its flow on is highlighted by the 45% collapse in oil prices since mid-January. Ultimately lower petrol prices will be a good thing as this will boost consumer spending when the virus goes away but for now all the focus is on the downside of lower oil prices – debt problems and less business investment by producers.
Base case versus global recession and beyond
Given all these uncertainties it’s still too early to say that shares, commodity prices and bond yields have bottomed. The following charts present three scenarios for the global economy:
-
How we saw global growth panning out prior to the virus. Basically, we were expecting a mild pick-up in growth.
-
A sharp downturn centred around the March quarter as the Chinese economy contracts sharply but rebounds in the June quarter offsetting recessions in developed countries including in the US. This is our base case.
-
A worse case downturn that sees global growth contract in the March quarter (led by a sharp contraction in China) and the June quarter as (as developed countries get badly hit) resulting in a global recession to be then followed by a rebound as life returns to normal led by China.
Note: the scenarios show quarterly annualised growth. The key is to focus on the pattern of growth rather than the precise level.

Source: Bloomberg, AMP Capital
The next chart shows three scenarios for Australian growth:
-
How we saw global growth panning out prior to the virus.
-
Mild downturns in the March and June quarters driven initially by the lockdown in the China and then the coronavirus flow on to the rest of the world and Australia, followed by a second-half rebound. This is our base case.
-
A worse case downturn that sees deeper downturns in the March and June quarters then followed by a rebound as life returns to normal.

Source: Bloomberg, AMP Capital
Last week we moved to forecasting a recession for the Australian economy in our weekly report. We were already expecting a negative March quarter on the back of the bushfires and the hit to tourism, education exports and commodity exports from the slump in China. But the spread of coronavirus globally and in Australia has made it likely that we will also see a contraction in the June quarter too. As with the global outlook this should really be “a disruption” that will pass once the virus runs its course – hopefully at least as the Northern Hemisphere heads toward summer. The worse case scenarios would likely see a deeper decline in shares and bond yields.
What to watch?
Shares will bottom when there is confidence that the worst is over in terms of the economic impact from the virus and its largely factored in. So, the debate is largely now about how big the hit to growth will be and this relates to how long the virus will weigh on global growth and any secondary effects it may cause. In this regard the key things to watch are as follows:
-
A peak in the number of new cases – as per the first chart.
-
News of successful vaccines or anti-virals.
-
Whether governments switch from containment.
-
Timely economic indicators, eg, jobless claims and weekly consumer confidence data in the US and Australia.
-
Measures of corporate stress, eg, spreads between corporate bond yields and government bond yields.
-
Measures of household stress, eg, unemployment and non-performing loans.
-
Measures of market stress, eg, bank funding costs as measured by the gap between 3-month rates and central bank rates. These have risen but are well below GFC levels.

Source: Bloomberg, AMP Capital
-
The monetary and fiscal policy response – this will be critical in terms of minimising the impact on vulnerable businesses and households from the coronavirus disruption, ensuring financial markets remain liquid and driving a quick recovery once the threat from the virus is over. So far so good with policy makers moving in the right direction (rapidly so in Australia it seems) – but there is a fair way to go.
What does it all mean for investors?
The rapidity of the fall in share market has been scary. In our view the key things for investors to bear in mind are as follows:
-
periodic sharp falls in share markets are healthy and normal. With the long-term trend ultimately remaining up & providing higher returns than other more stable assets.
-
selling shares or switching to a more conservative investment strategy after a major fall just locks in a loss.
-
when shares fall, they are cheaper and offer higher long-term return prospects. So, the key is to look for opportunities the pullback provides. It’s impossible to time the bottom but one way to do it is to average in over time.
-
while shares have fallen, dividends from the market haven’t. Companies like to smooth their dividends over time – they never go up as much as earnings in the good times and so rarely fall as much in the bad times.
-
shares and other related assets bottom at the point of maximum bearishness, ie, just when you feel most negative towards them.
-
the best way to stick to an appropriate long-term investment strategy, let alone see the opportunities that are thrown up in rough times, is to turn down the noise.
Source: AMP Capital 10th March 2020
Important notes: While every care has been taken in the preparation of this article, AMP Capital Investors Limited (ABN 59 001 777 591, AFSL 232497) and AMP Capital Funds Management Limited (ABN 15 159 557 721, AFSL 426455) (AMP Capital) makes no representations or warranties as to the accuracy or completeness of any statement in it including, without limitation, any forecasts. Past performance is not a reliable indicator of future performance. This article has been prepared for the purpose of providing general information, without taking account of any particular investor’s objectives, financial situation or needs. An investor should, before making any investment decisions, consider the appropriateness of the information in this article, and seek professional advice, having regard to the investor’s objectives, financial situation and needs. This article is solely for the use of the party to whom it is provided and must not be provided to any other person or entity without the express written consent of AMP Capital.
The plunge in shares – seven things investors need to keep in mind
The plunge in share markets over the last week has generated much coverage and consternation. This is understandable given the rapidity of the falls – with US shares having their fastest 10% fall from an all-time high on record – and the uncertainty around the coronavirus (Covid-19) and its impact on economic activity. From their highs to recent lows US
Read MoreThe plunge in share markets over the last week has generated much coverage and consternation. This is understandable given the rapidity of the falls – with US shares having their fastest 10% fall from an all-time high on record – and the uncertainty around the coronavirus (Covid-19) and its impact on economic activity. From their highs to recent lows US shares have fallen 13%, Eurozone shares have fallen 16%, Japanese and Chinese shares have fallen 12% and Australian shares have fallen 12%. This note looks at the issues for investors and puts the falls into context.

What’s driving the latest plunge?
The plunge basically reflects two things.
-
After very strong gains from their last greater than 5% correction into August last year, share markets had become vulnerable to a correction.
-
The uncertainty around the impact of the coronavirus outbreak which is on the verge of becoming a pandemic and its impact on global growth has unnerved investors dramatically. Shares had recovered from their initial fall on the back of the virus into early February on signs that the number of new cases in China was falling (which is continuing), limited cases outside China and expectations that policy easing would limit any damage. This has been blown apart in the last week as cases have popped up en masse in Italy, South Korea and Iran, more cases have appeared elsewhere around the world and this has resulted in expectations of a deeper and longer hit to global growth.
After big falls shares have become technically oversold, measures of negative investor sentiment such as the VIX (or fear) index and demand for option protection have spiked. So, shares could have a short-term bounce. But given the uncertainties around Covid-19 – with more cases in the US and Australia likely to pop up – the situation could get worse before it gets better, so the share pullback could have further to go – notwithstanding short-term bounces.
Considerations for investors
Sharp market falls with headlines screaming that billions of dollars have been wiped off the share market are stressful for investors as no one likes to see the value of their investments decline. The current situation is doubly stressful because of fears for our own and others health – particularly for the elderly. However, several things are worth bearing in mind:
First, while they all have different triggers and unfold a bit differently to each other, periodic corrections in share markets of the order of 5%, 15% and even 20% are healthy and normal. For example, during the tech/dot-com boom from 1995 to early 2000, the US share market had seven pull backs greater than 5% ranging from 6% up to 19% with an average decline of 10%. During the same period, the Australian share market had eight pullbacks ranging from 5% to 16% with an average fall of 8%. All against a backdrop of strong returns every year. During the 2003 to 2007 bull market, the Australian share market had five 5% plus corrections ranging from 7% to 12%, again with strong positive returns every year. More recently, the Australian share market had a 10% pullback in 2012, an 11% fall in 2013 (the taper tantrum), an 8% fall in 2014, a 20% fall between April 2015 and February 2016, a 7% fall early in 2018, a 14% fall between August and December 2018 and a 7% fall into August last year. And this has all been in the context of a gradual rising trend. And it has been similar for global shares – with the last big fall in US shares being a 20% plunge into Christmas eve 2018. See the next chart. While they can be painful, share market corrections are healthy because they help limit a build-up in complacency and excessive risk taking.

Source: Bloomberg, AMP Capital
Related to this, shares climb a wall of worry over many years with numerous events dragging them down periodically, but with the long-term trend ultimately up & providing higher returns than other more stable assets. Bouts of volatility are the price we pay for the higher longer-term returns from shares.

Source: ASX, AMP Capital
Second, the main driver of whether we see a correction (a fall of 5% to 15%) or even a mild bear market (with say a 20% decline that turns around relatively quickly like we saw in 2015-2016) as opposed to a major bear market (like that seen in the global financial crisis (GFC)) is whether we see a recession or not – notably in the US as the US share markets tends to lead for most major global markets. The next table shows US share market falls greater than 10% since the 1970s. I know it’s heavy – but I like this table! The first column shows the period of the fall, the second shows the decline in months, the third shows the percentage decline from top to bottom, the fourth shows whether the decline was associated with a recession or not and the fifth shows the gains in the share market one year after the low. Falls associated with recessions are highlighted in red.

Falls associated with recessions are in red. Source: Bloomberg, AMP Capital.
Several points stand out:
-
First, share market falls associated with recession tend to be longer and deeper.
-
Second, after the low the, share markets generally rebound sharply – which invariably makes it very hard for investors to time, as by the time they realise what has happened and get back in the market is above where they sold.
-
Finally, as would be expected the share market rebound in the year after the low is much greater following falls associated with recession.
So, whether a recession is imminent or not in the US is critical in terms of whether we will see a major bear market or not. In fact, the same applies to Australian shares. Our assessment is that a US/global recession is not inevitable. We have not seen the excesses – in terms of overall debt growth (although housing debt is a source of risk in Australia), overinvestment, capacity constraints and inflation – that normally precede recessions in the US, globally or Australia. And we have not seen the sort of monetary tightening that leads into recession. In fact, monetary conditions remain very easy. However, the uncertainty around the coronavirus outbreak and the likelihood of economic shutdowns designed to contain it beyond those in China do suggest a greater than normal risk on this front. That said even if there were a recession growth would likely rebound quickly once the virus came under control as economic activity sprang back to normal helped by policy stimulus.
Third, selling shares or switching to a more conservative investment strategy or superannuation option after a major fall just locks in a loss. With all the talk of billions being wiped off the share market, it may be tempting to sell. But this just turns a paper loss into a real loss with no hope of recovering. The best way to guard against making a decision to sell on the basis of emotion after a sharp fall in markets (as many including me are tempted to do!) is to adopt a well thought out, long-term strategy and stick to it.
Fourth, when shares and growth assets fall, they are cheaper and offer higher long-term return prospects. So, the key is to look for opportunities the pullback provides – shares are cheaper and some more than others. It’s impossible to time the bottom but one way to do it is to average in over time.
Fifth, while shares have fallen, dividends from the market haven’t. They will come under some pressure as the economy and profits take a hit from a deeper and longer coronavirus outbreak. But companies like to smooth their dividends over time – they never go up as much as earnings in the good times and so rarely fall as much in the bad times. So, the income flow you are receiving from a well-diversified portfolio of shares is likely to remain attractive, particularly against bank deposits.

Source: RBA, Bloomberg, AMP Capital
Sixth, shares and other related assets often bottom at the point of maximum bearishness, ie, just when you and everyone else feel most negative towards them. So, the trick is to buck the crowd. “Be fearful when others are greedy. Be greedy when others are fearful,” as Warren Buffett has said.
Finally, turn down the noise. At times like this, negative news reaches fever pitch. Talk of billions wiped off share markets and warnings of disaster help sell copy and generate clicks & views. But we are rarely told of the billions that market rebounds and the rising long-term trend in share prices adds to the share market. Moreover, they provide no perspective and only add to the sense of panic. All of this makes it harder to stick to an appropriate long-term strategy let alone see the opportunities that are thrown up. So best to turn down the noise.
Source: AMP Capital 2 March 2020
Important notes: While every care has been taken in the preparation of this article, AMP Capital Investors Limited (ABN 59 001 777 591, AFSL 232497) and AMP Capital Funds Management Limited (ABN 15 159 557 721, AFSL 426455) (AMP Capital) makes no representations or warranties as to the accuracy or completeness of any statement in it including, without limitation, any forecasts. Past performance is not a reliable indicator of future performance. This article has been prepared for the purpose of providing general information, without taking account of any particular investor’s objectives, financial situation or needs. An investor should, before making any investment decisions, consider the appropriateness of the information in this article, and seek professional advice, having regard to the investor’s objectives, financial situation and needs. This article is solely for the use of the party to whom it is provided and must not be provided to any other person or entity without the express written consent of AMP Capital.
The increasing spread of Coronavirus – updated economic and investment market implications
The past week has seen a renewed escalation in concern that the coronavirus outbreak (Covid-19) has become or is becoming a global pandemic. This is first and foremost a human crisis and our thoughts are with all those affected and those trying to combat the outbreak. Naturally though investment markets are starting to become increasingly concerned about the disruptive impact
Read MoreThe past week has seen a renewed escalation in concern that the coronavirus outbreak (Covid-19) has become or is becoming a global pandemic. This is first and foremost a human crisis and our thoughts are with all those affected and those trying to combat the outbreak. Naturally though investment markets are starting to become increasingly concerned about the disruptive impact on economic activity. As a result, while most share markets recovered their initial decline on the back of the virus with some hitting new highs last week, we are now seeing renewed sharp falls. This note updates our initial analysis from three weeks ago (see The China Coronavirus outbreak) as to the impact of the outbreak.

Scenarios
Our assessment three weeks ago saw as our base case with 75% probability that the outbreak would be contained within the next month or two. This could still see more downside in share markets & bond yields but there would be a rebound by the June quarter as growth rebounds. The downside case saw a full-blown pandemic with delayed containment resulting in sharp drawn out slump in economic activity, the risk of recession and a 20% or so fall in share markets with the $A falling to around $US0.60. Of course, there are lots of variations around this. We thought the key things to watch are the daily number of new cases and the spread of new cases in developed countries.
Where are we with the Covid-19 outbreak so far?
-
First, while the total number of reported cases is now around 80,000 worldwide there has been some good news in that the daily number of new cases is down from its peak earlier in February. This is due to a sharp fall in the reported number of new cases in China. This has been confused by definitional changes in China – with Hubei initially reporting lab confirmed results, then including clinically tested results, then reverting to lab tested results only. However, both approaches have issues & even if it’s roughly right it’s good news if China is starting to get the outbreak under control.

Source: PRC National Health Commission, Bloomberg, AMP Capital

Source: PRC National Health Commission, Bloomberg, AMP Capital
-
Against this, the number of new cases outside China has spiked – particularly in South Korea, Japan, Italy and Iran.

-
The mortality rate has increased to 3.3% – although there is uncertainty about it. Some argue it’s higher because it’s wrong to divide deaths into all cases as there is a lag from getting the disease to dying. Others argue it’s much lower because only those who are seriously ill are showing up for help and being measured. The mortality rate does look to be below the 9% for SARS but above that for swine flu though and it’s mainly the old and sick who are most vulnerable.
-
There is still much uncertainty about how it’s spread – with leaky plumbing and aerosolising of toilet water or contaminated water possibly playing a role in the spread of the virus in the Diamond Princess cruise ship in Japan.
-
Containment measures in China have been aggressive and if the declining number of new cases in China is correct maybe they are working. Australia’s quick toughening in entry and quarantine conditions may also have helped in contrast to other countries that now have many more cases. However, some governments may not be able to implement and enforce such tough measures.
The spread of cases beyond China has raised increasing concerns that Covid-19 is become a global pandemic. While we and others have made comparisons to the SARS outbreak of 2003, the swine flu pandemic of 2009 is also relevant. Despite efforts to contain the disease it is estimated to have ultimately infected 700million to 1.4billion people but because its death rate was low at around 0.02-0.04% it doesn’t get referred to much. Partly due to this swine flu had little impact on the global economic recovery of 2009 although it did occasionally rattle share markets. Though Covid-19’s mortality rate looks to be greater than that of swine-flu its worth noting that swine-flu’s mortality was initially reported to be as high as 9.5%.
A big hit to global growth
Whether Covid-19 is soon contained, turns into a re-run of swine-flu or something a lot more deadly remains to be seen. Our base case remains one of containment by the end of March. But the risk of it taking longer is significant and in any case it’s increasingly clear that the economic impact will be quite severe as containment measures spread globally disrupting supply chains and spending.
-
Some estimates suggest that as much as 50% of China’s economy has been locked down for the last three weeks which means nearly 12% knocked off Chinese GDP this quarter. While the Chinese Government is refocussing on efforts to restore economic activity outside Hubei and high-risk areas, so far there is only mixed evidence of that. Coal consumption at power stations, migrant flows to cities, property sales and steel demand are up from their lows but remain well below normal levels for this time of year. And there has been no pickup in traffic congestion.

Source: Wind, Goldman Sachs
-
Numerous companies globally are reporting disruption to supply chains or reduced demand flowing from Covid-19.
-
Containment measures including travel restrictions in countries like Japan, Korea and Italy will spread the economic disruption globally.
-
Our rough estimate is that March quarter global GDP could now be zero or slightly negative.
-
Australian GDP is likely to go backwards this quarter (with our current estimate being -0.1%) thanks to the bushfires and the hit from coronavirus. The vulnerability of the Australian economy to China is apparent from the next chart. Exports to China make up nearly 9% of Australia’s GDP including hard commodities at nearly 5%, tourism at 0.2% and education at 0.6%. For other major countries it’s less than 3%. Chinese tourist arrivals stopped with the travel ban, education is under threat although there is a bit more time and bulk commodity shipments are showing signs of being impacted (although this has been distorted by storms). Clearly the longer it drags on and the more the outbreak and disruption spreads globally the bigger the impact on Australia including the risk of two negative quarters, ie recession. The rising threat to the Australian economy from coronavirus is adding to the likelihood that the RBA will cut rates in March or April and the pressure for more fiscal stimulus in the May budget is increasing.

Source: ABS, AMP Capital
Concluding comments
The increasing global spread of the coronavirus has increased the risk of greater economic disruption for longer resulting in say a 20% fall in share markets. However, our base case of containment is that Chinese, global and hence Australian growth will rebound in the June quarter (avoiding recession in Australia’s case) although the risk of a delay is significant. Against this background share markets, commodity prices and the $A remain at high risk of more downside in the short-term, but assuming some containment and a growth rebound in the June quarter markets should rebound by then. Easier than otherwise monetary and fiscal policies – with ever more stimulus measures announced in China and more monetary and fiscal easing globally – would add to this. The key things to watch for remain a further downtrend in the daily number of new cases globally and a peak in new cases in developed countries.
In a big picture sense, the fall in share markets should be seen as just another correction after markets ran hard and fast into record highs this year from their last decent correction into August last year.
Finally, for most investors given the obvious difficulty in trying to time any of this – whether it’s a further share market fall of 5% or 20% or no further fall at all and then when to get back in – it makes sense to turn down the noise around the virus and stick to a long-term investment strategy.
Source: AMP Capital 25 Feb 2020
Important notes: While every care has been taken in the preparation of this article, AMP Capital Investors Limited (ABN 59 001 777 591, AFSL 232497) and AMP Capital Funds Management Limited (ABN 15 159 557 721, AFSL 426455) (AMP Capital) makes no representations or warranties as to the accuracy or completeness of any statement in it including, without limitation, any forecasts. Past performance is not a reliable indicator of future performance. This article has been prepared for the purpose of providing general information, without taking account of any particular investor’s objectives, financial situation or needs. An investor should, before making any investment decisions, consider the appropriateness of the information in this article, and seek professional advice, having regard to the investor’s objectives, financial situation and needs. This article is solely for the use of the party to whom it is provided and must not be provided to any other person or entity without the express written consent of AMP Capital.

