

Olivers Insights
The break higher in the Australian dollar is likely to be limited – this is not 2007 all over again!
Contrary to our expectations, the Australian dollar has recently broken out of the $US0.72 to $US0.78 range of the last 15 months or so on the upside and spiked above $US0.80, its highest in over two years. So what gives? Why has the $A broken higher? Is it an Australian dollar or US dollar story? What will be the impact
Read More Contrary to our expectations, the Australian dollar has recently broken out of the $US0.72 to $US0.78 range of the last 15 months or so on the upside and spiked above $US0.80, its highest in over two years. So what gives? Why has the $A broken higher? Is it an Australian dollar or US dollar story? What will be the impact on the economy? Is it on its way to parity again or will the downtrend resume?
Drivers of the recent rebound
Domestic considerations for the Australian dollar have recently been contradictory. While readings for employment, business confidence and retail sales have been solid and the minutes from the Reserve Bank of Australia’s (RBA) last board meeting were seen by many as hawkish, consumer confidence remains weak, June quarter inflation data was soft and the RBA has sought to push back against expectations for higher interest rates and in fact indicated that a lower $A “would be helpful”.
Rather there have been three main drivers of the recent break higher in Australian dollar: weakness in the US dollar; a rebound in commodity prices including in the iron ore price; and technical conditions, which have seen the break of the top of the $US0.72-0.78 range attracting more buying into the $A so that the rally has taken on a bit of a life of its own.
The US dollar goes from up to down
But the big one in here has been the downwards reversal in the US dollar that we have seen this year. While the $A is up 10% against the $US so far this year, the Euro is up 12% and the $US is down 9% against a basket of currencies. At the end of 2016, there was an expectation that President Trump’s tax and infrastructure policies would deliver a boost to US growth and that this, combined with inflation around the Fed’s 2% target, would see the Fed continue its gradual process of monetary tightening and that this would all see the US dollar trend higher. It’s all turned out a little bit different though:
-
While President Trump has not been as threatening to the global economy as some had feared (eg, no trade war with China or Mexico –at least so far), his presidency has been characterised by a high degree of mayhem with so far no passage of tax reform or infrastructure spending. In fact, he has just had another bad week: Congress has failed to reform or repeal Obamacare; it has imposed new sanctions on Russia, which can’t be eased by him; several senators warned him not to fire Attorney General Jeff Session; the Boy Scouts issued an apology for a speech he gave at a Jamboree; the military baulked at implementing his policy banning transgender people in the military; and his staff turnover accelerated. Australia’s attempt at political mayhem – with “foreigners” taking Aussie politicians jobs! – arguably pales into insignificance. We remain of the view that the Republican-controlled Congress won’t impeach Trump in relation to the Mueller inquiry (into Russian links and other things) and that tax reform will still be passed (as it’s something Republicans agree on and they need a win). However, while none of the mayhem around Trump has had much lasting impact on the US share market, as it’s benefitted from a “Goldilocks”-like combination of good growth and profits but low inflation keeping the Fed friendly, it has weighed on broader sentiment towards the US.
-
Recently, core inflation in the US has fallen back to 1.4% year on year from 1.8% earlier this year and this may slow the Fed with a September rate hike now looking like it will be delayed to December and possibly early next year.
All of this – at a time when growth in the rest of the world has proven to be a bit stronger than feared at the start of the year –has clearly weighed on the value of the US dollar. Ultimately we see the $US resuming its upswing as the US economic cycle is more advanced than in most major countries and the Fed is likely to continue monetary tightening with other countries lagging.
This is not 2007 for the $A
But returning to the Australian dollar, in a big picture sense it’s not way out of whack with long-term fair value based on relative prices or what is referred to as purchasing power parity. This can be seen in the next chart, which shows where the $A should have been over time if it had moved to equilibrate relative consumer price levels between the US and Australia. Right now, fair value on this measure is around $US0.75, so at around $US0.80 it’s hard to get too excited given that purchasing power parity is only a rough guide.

Source: RBA, ABS, AMP Capital
However, the environment today is very different than a decade ago when in March 2007 the $A burst through $US0.80, having recovered from a 2001 low of $US0.48, ultimately on its way towards parity (after an interruption from the Global Financial Crisis (GFC)). Back then:
-
Australia’s export prices were surging on the back of 10% plus growth in China, with Chinese fixed asset investment growing around 25% per annum (pa) and industrial production growing at around 15% pa.
-
The supply of commodities was constrained by years of underinvestment in new mines and related infrastructure.
-
The Australian economy was growing at 5% year on year and underlying inflation was 2.8% and on its way to 5%.
-
So the RBA was raising interest rates in response at a time when US interest rates had peaked (in the very early stages of the GFC), such that the interest rate differential between Australia and the US was widening, which is normally positive for the Australian dollar.
Now the environment is very different:
-
Notwithstanding the yoyo ride in the iron ore price, the upside in commodity prices is limited by slower growth in China (with GDP growth running around 6.5-7%, fixed asset investment growing around 8.5% pa and industrial production growing around 7.5% pa).
-
The supply of commodities has surged after record levels of investment in new mines and energy projects.
-
The Australian economy is growing at less than 2% year on year. In fact, the rise in the $A is a problem for the economy and is likely contributing to the underperformance of the Australian share market this year (it’s up 1.4% year to date) compared to global shares (which are up 9.2%). With mining investment still falling, consumers under pressure and housing construction looking like it is peaking, we need a contribution to growth from trade-exposed sectors like tourism, higher education, manufacturing and farming but a rising $A will work against that. Any tourist operator who was thinking of expanding must now be fearing another run to parity is on the way, which will destroy the flow of foreign tourists and send locals back to Disneyland for their holidays. So it won’t be good for investment either.
-
Inflation is running below the RBA’s 2-3% target, and wages growth – the main driver of costs – is at record lows. And the rise in the $A at a time of already sub-par growth risks keeping inflation below target for longer.
-
As a result, the RBA is far from tightening. In fact, in its post-August meeting statement it noted that a rising $A “would be expected to result in a slower pick-up in economic activity and inflation than currently forecast”. In other words, the rising $A is a defacto monetary tightening that will mean a lower profile for the cash rate than would otherwise have been the case. And meanwhile with US economic indicators remaining solid and the Fed is likely to continue raising rates and start reversing quantitative easing next month. So a resumption of the falling interest rate differential between Australia and the US is likely. As the next chart shows, periods of a falling official interest rate differential between Australia and the US usually see a falling Australian dollar (see black arrows) – not in a straight line, but over time. By contrast surges in the value of the $A (eg 2007-2008 and 2009-2011 – both circled) are associated with rising rates in Australia relative to the US and there is no sign of that.

Source: Bloomberg, AMP Capital
The huge difference between the Australian and US economies at present can be seen in broad measures of labour market underutilisation. In Australia, the combination of unemployment and underemployment is about as high as it ever gets, whereas in the US its nearing as low as it ever gets, which is consistent with falling interest rates in Australia relative to the US. Back in 2007, when the $A was on its way towards parity, the Australian labour market was rapidly tightening with labour market underutilisation heading to a record low.
Source: Bloomberg, AMP Capital
The bottom line
In the short term, the $A could still have more upside as the break up through key points of technical resistance could still attract more buying into it. But this is not 2007 and in fact is very different. The decade-long commodity price boom is long gone and the Australian economy is underperforming. So I remain of the view that at some point in the next year the $A will fall back – probably below $US0.70 – but trying to get a handle on when that will be and from what level is not so easy.
For investors, this means there remains a strong case to maintain a decent exposure to offshore assets that are not hedged back to Australian dollars as they will go up in value if the $A falls. This has the added advantage that if we go through another global growth scare, which will invariably weigh on the $A, it will provide a useful hedge for Australia-based investors.
If you would like to discuss anything in this report, please call us on |PHONE|.
Source: AMP Capital 2 August 2017
Author
Dr Shane Oliver, Head of Investment Strategy and Economics and Chief Economist at AMP Capital is responsible for AMP Capital’s diversified investment funds. He also provides economic forecasts and analysis of key variables and issues affecting, or likely to affect, all asset markets.
Important note: While every care has been taken in the preparation of this article, AMP Capital Investors Limited (ABN 59 001 777 591, AFSL 232497) and AMP Capital Funds Management Limited (ABN 15 159 557 721, AFSL 426455) makes no representations or warranties as to the accuracy or completeness of any statement in it including, without limitation, any forecasts. Past performance is not a reliable indicator of future performance. This article has been prepared for the purpose of providing general information, without taking account of any particular investor’s objectives, financial situation or needs. An investor should, before making any investment decisions, consider the appropriateness of the information in this article, and seek professional advice, having regard to the investor’s objectives, financial situation and needs. This article is solely for the use of the party to whom it is provided.
Five great charts on investing
Investing is often seen as complicated. And this has been made worse over the years by the increasing complexity in terms of investment products and choices, regulations and rules around investing, the role of the information revolution and social media in amplifying the noise around investment markets and the expanding ways available to access various investments. But at its core,
Read More Investing is often seen as complicated. And this has been made worse over the years by the increasing complexity in terms of investment products and choices, regulations and rules around investing, the role of the information revolution and social media in amplifying the noise around investment markets and the expanding ways available to access various investments. But at its core, the basic principles of successful investing are simple. And one way to demonstrate that is in charts or pictures – after all, a picture tells a thousand words. So this note looks at five charts I find useful in understanding investing. I’ll put out part 2 – another five great charts on investing – in a few weeks’ time.
Chart 1: The power of compund interest
This chart is my absolute favourite. My good friend, the well-known economist Dr Don Stammer, has said there are six things we owe our children or grandchildren: a sense of humour; a reasonable education; an early understanding of the magic of compounding; an awareness the cycle lives on; some help when they buy their first house or apartment; and a feeling of optimism. I can’t argue with the first, second and fifth, the fourth I will deal with next, and a feeling of optimism is essential if you wish to succeed as an investor. But on compound interest – he’s right it is like magic!

Source: Global Financial Data, AMP Capital
The chart shows the value of $1 invested in various Australian assets in 1900 allowing for the reinvestment of dividends and interest along the way. That $1 would have grown to $231 if invested in cash, to $850 if invested in bonds and to $485,815 if invested in shares. While the average return since 1900 is only double that in shares relative to bonds, the huge difference between the two at the end owes to the impact of compounding or earning returns on top of returns. So any interest or return earned in one period is added to the original investment so that it all earns a return in the next period. And so on.
The “Law of 72” is a useful tool to understanding how long it takes an investment to double in value using compounding. Just divide the rate of return into 72 and that’s the answer (roughly). For example, if the rate of return is 2% per annum (eg, the interest rate on a bank term deposit), it will take 36 years to double in value (= 72 divided by 2). But if it’s, say, 8% pa (eg, the expected total return from shares including dividends), then it will take just 9 years (= 72 divided by 8). Key message: if we want to grow our wealth, we must have exposure to growth assets like shares and property.
Chart 2: The cycle
But of course shares can have lots of setbacks along the way as is particularly evident during the periods highlighted by the arrows on the share market line. In fact, the higher returns shares generate over time relative to cash and bonds is compensation for the periodic setbacks that they suffer from. But understanding those periodic setbacks – that there will always be a cycle – is important in not getting blown away from the higher returns that shares and other growth assets provide over time. The next chart shows a stylised version of the investment cycle.

Source: AMP Capital
The grey line shows the economic cycle from “boom” to “bust” to “boom” again. Prior to the low point in the economic cycle, shares invariably find a bottom thanks to attractive valuations and easy monetary policy and as smart investors look forward to an eventual economic recovery. This phase is usually characterised by scepticism as economic conditions are yet to improve. Shares then move higher, eventually supported by stronger earnings on the back of improving economic conditions, which eventually gives way to a blow off phase or euphoria as investors pile in. This is ultimately brought to an end as rising inflation flowing from strong economic conditions results in ever-tightening monetary policy, which combines with smart investors anticipating an economic downturn and results in shares coming under pressure. Usually around the top of the cycle real assets – like property and infrastructure – are a better bet than shares as they benefit from strong real economic conditions. But once the downturn hits bonds are the place to be as slowing growth eventually gives way to falling inflation allof which sees bond yields decline producing capital gains for investors. At some point, of course, easing monetary conditions and attractive valuations see shares bottom out and the whole cycle repeats.
Key message: cycles are a fact of life and while they don’t repeat precisely, it’s invariably the case that the share market leads the economic cycle (bottoming out before economic recovery is clear and topping out before an economic downturn has really hit) and that different assets perform relatively best at different phases in the cycle.
Chart 3: The roller coaster of investor emotion
The swings we see in investment markets are far greater than can be justified by movements in investment fundamentals alone – ie profits, dividends, rents, interest rates, etc. In fact, investor emotion plays a huge part. The next chart shows the roller coaster that investor emotion traces through the course of an investment cycle. A bull market runs through optimism, excitement, thrill and ultimately euphoria by which point the asset class is over loved (and usually overvalued too) – everyone who is going to buy has – and it becomes vulnerable to bad news. This is the point of maximum risk. Once the cycle starts to turn down in a bear market, euphoria gives way to anxiety, denial, fear, capitulation and ultimately depression at which point the asset class is under loved (and usually undervalued) – everyone who is going to sell has – and it becomes vulnerable to good (or less bad) news. This is the point of maximum opportunity. Once the cycle turns up again, depression gives way to hope, relief and optimism before eventually moving on to euphoria again.
The roller coaster of investor emotion

Source: Russell Investments, AMP Capital
Key message: investor emotion plays a huge roll in exaggerating the investment cycle. The key for investors is not to get sucked into this emotional roller coaster: avoid assets where the crowd is euphoric and convinced it’s a sure thing and the asset is over loved, and favour assets where the crowd is depressed and the asset is under loved.
Chart 4: The wall of worry
It seems that these days there is always something for investors to worry about. This year so far has been no exception with numerous worries about President Trump on multiple fronts (will he overstimulate the US economy? will he cause trade wars? will he deliver on his pro-business policies? will he be impeached? etc), various terrorist attacks, elections in the Netherlands and France and worries about Italy, the surprise election result in the UK, tensions between Saudi Arabia and Qatar, a new plunge in the oil price, intensifying “provocations” from North Korea, ongoing worries about the Australian property market and banks, etc. But most of this stuff is just noise. The global economy has had plenty of worries over the last century, but it got over them with Australian shares returning 11.8% per annum since 1900, with a broad rising trend in the All Ords price index as can be seen in the next chart, and US shares returning 9.8% pa. (Note that this chart shows the All Ords share price index whereas the first chart shows the value of $1 invested in the All Ords accumulation index, which allows for changes in share prices and dividends.)

Source: ASX, AMP Capital
Key message: worries are normal around the economy and investment markets but most of them are just noise.
Chart 5: Time is on your side
Investment markets bounce all over the place in the short term. As can be seen in the next chart even annual returns in the share market are highly volatile, but longer-term returns tend to be solid and relatively smooth. Since 1900 for Australian shares roughly two years out of ten have had negative returns but there are no negative returns over rolling 20-year periods. (It’s roughly three years out of ten for US shares since 1900.

Source: Global Financial Data, AMP Capital
Key message: the longer the time horizon, the greater the chance your investments will meet their goals. So in investing, time is on your side.
If you would like to discuss anything in this article, please call us on |PHONE|.
Source: AMP Capital 25 July 2017
Author
Dr Shane Oliver, Head of Investment Strategy and Economics and Chief Economist at AMP Capital is responsible for AMP Capital’s diversified investment funds. He also provides economic forecasts and analysis of key variables and issues affecting, or likely to affect, all asset markets.
Important note: While every care has been taken in the preparation of this article, AMP Capital Investors Limited (ABN 59 001 777 591, AFSL 232497) and AMP Capital Funds Management Limited (ABN 15 159 557 721, AFSL 426455) makes no representations or warranties as to the accuracy or completeness of any statement in it including, without limitation, any forecasts. Past performance is not a reliable indicator of future performance. This article has been prepared for the purpose of providing general information, without taking account of any particular investor’s objectives, financial situation or needs. An investor should, before making any investment decisions, consider the appropriateness of the information in this article, and seek professional advice, having regard to the investor’s objectives, financial situation and needs. This article is solely for the use of the party to whom it is provided.
2016-17 saw strong returns for diversified investors – here are five reasons why returns are likely to be solid in 2017-18
The past financial year turned out far better for investors than had been feared a year ago. This was despite a lengthy list of things to worry about: starting with the Brexit vote and a messy election outcome in Australia both just before the financial year started; concerns about global growth, profits and deflation a year ago; Donald Trump being
Read More The past financial year turned out far better for investors than had been feared a year ago. This was despite a lengthy list of things to worry about: starting with the Brexit vote and a messy election outcome in Australia both just before the financial year started; concerns about global growth, profits and deflation a year ago; Donald Trump being elected President in the US with some predicting a debilitating global trade war as a result; various elections across Europe feared to see populists gain power; the US Federal Reserve resuming interest rate hikes; North Korea stepping up its missile tests; China moving to put the brakes on its economy amidst ever present concern about its debt levels; and messy growth in Australia along with perennial fears of a property crash and banking crisis. Predictions of some sort of global financial crisis in 2016 were all the rage. But the last financial year provided a classic reminder to investors to turn down the noise on all the events swirling around investment markets and associated predictions of disaster, and how, when the crowd is negative, things can surprise for the better. But will returns remain reasonable? After reviewing the returns of the last financial year, this note looks at the investment outlook for the 2017-18 financial year.
A good year for diversified investors
The 2016-17 financial year provided strong returns for diversified investors. Of course cash and bank term deposits continued to provide poor returns and a backup in bond yields, as deflation and global growth fears faded, resulted in poor returns from bonds and investments that are sensitive to rising bond yields such as real estate investment trusts. But improving global growth and profits along with still easy monetary policy buoyed share markets with global shares continuing to outperform Australian shares. And real assets like unlisted (or direct) commercial property, infrastructure and Australian residential property continued to perform well, although there was a huge range across Australia in terms of the latter with Perth depressed and Sydney and Melbourne still booming.
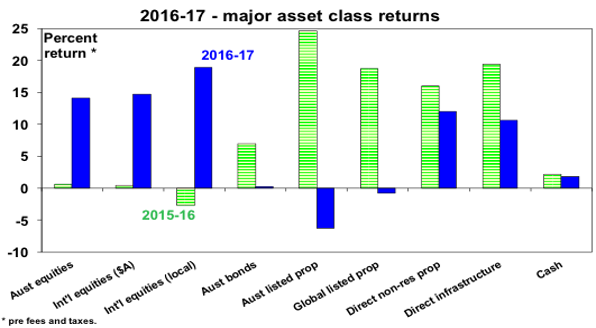
Source: Thomson Reuters, AMP Capital
As a result, balanced growth superannuation funds returned around 10% after fees and taxes over 2016-17, in contrast to depressed returns of around 2% in 2015-16. Interestingly, such funds returned around 10% pa over the last five years as well reflecting favourable asset class returns partly in response to a recovery from the 2010-12 Eurozone sovereign debt crisis.
Key lessons for investors from the last financial year
These include:
-
Turn down the noise – despite lots of worries and predictions of disaster shares did well.
-
Maintain a well-diversified portfolio – despite previous strongly-performing asset classes like bonds real estate investment trusts having a tougher time, a well-diversified portfolio benefitted from a rebound in share markets.
-
Be cautious of the crowd – a year ago the crowd was pretty negative and as is often the case it turned out to be wrong.
-
Cash is not king – while cash and bank deposits provided safe steady returns, they were also very low returns.
Five reasons why returns are likely to remain solid
Of course, there will be the usual corrections and bumps along the way. However, there are five reasons to be upbeat about the overall return outlook for the year ahead.
-
First, global growth is solid. Business conditions indicators – such as surveys of purchasing managers (Purchasing Managers Indexes or PMIs) – are strong and at levels consistent with good global growth.

Source: Bloomberg, AMP Capital
-
In Australia, growth is unlikely to be fantastic as housing slows and the consumer is constrained but it should still be okay as the big drag from falling mining investment is abating and the contribution to growth from trade is set to remain solid as resources projects complete.
-
Second, solid global growth should continue to underpin a recovery in corporate profits after a weak patch into 2016.
-
Third, there are minimal signs globally of the broad-based excess – in terms of capacity utilisation, growth in debt, investment, wages growth and inflation or asset prices – that normally presage a peak in the growth cycle. Sure, there have been pockets of excess – corporate debt growth has been arguably too strong in the US and China, and the Sydney and Melbourne property markets have been too hot – but they have not been broad based, unlike the share boom and tech related investment into say 2000.
-
Fourth, because of low inflationary pressures, global monetary tightening will likely remain very gradual and monetary policy will likely remain easy for some time to come. There is a risk that the next Fed rate hike won’t occur until 2018, the ECB’s exit from ultra easy monetary policy will likely be very slow, the RBA is still some time away from tightening and Bank of Japan tightening is likely years away.
-
Finally, share valuations are not excessive. While price to earnings ratios are a bit above long-term averages, this is not unusual for a low inflationary environment. Valuation measures that allow for low interest rates and bond yields show shares to no longer be as cheap as a year ago but they are still not expensive, particularly outside of the US.
What about the return outlook?
After the strong overall investment returns seen over last year, some slowing is likely in the year ahead. Share markets are no longer universally cheap and the crowd is not as negative as a year ago. However, putting short-term worries and uncertainties aside, with reasonable economic and profit growth, continuing relatively easy monetary policy and some asset classes still benefitting from a chase for yield, returns from a well-diversified portfolio are likely to be reasonable this financial year – but more like 7% as opposed to 10%. Looking at the major asset classes:
-
Cash and term deposit returns are likely to remain poor at around 2%. Investors are still under pressure to decide what they really want: if it’s complete capital stability then stick with cash or if it’s a decent stable income flow then consider the alternatives with Australian shares and real assets such as unlisted commercial property likely to continue to offer more attractive yields than bank deposits.

Source: RBA, AMP Capital
-
Still ultra-low sovereign bond yields and a likely gradual rising trend in yields, which will result in capital losses, are likely to result in another year of poor returns from bonds.
-
Corporate debt should provide okay returns. A drift higher in sovereign bond yields is a mild drag but with continued modest global growth the risk of default should remain low.
-
Unlisted commercial property and infrastructure are likely to benefit from the ongoing “search for yield” (although this may slow a bit) and solid economic growth.
-
Residential property returns are likely to be mixed with Sydney and Melbourne slowing, Perth and Darwin bottoming and other cities providing modest gains. Very low rental yields are not good, particularly in oversupplied units.
-
Expect a potential share market correction in the seasonally weak period out to October, but the rising trend in shares is likely to continue as shares are okay value, monetary conditions are likely to remain relatively easy (albeit becoming less so) and continuing reasonable economic growth should help profits. We continue to favour global shares (particularly outside the US) over Australian shares.
-
Finally, while the $A has proved far more resilient than I expected and may push up into the low $US0.80s in the short term, the downtrend in the $A is likely to resume at some point in the next 12 months enhancing the case for unhedged global shares.
Things to keep an eye on
The key things to keep an eye on over the year ahead are:
-
Global business conditions PMIs – these currently point to good, but not booming, growth.
-
Risks around President Trump – we see Congress passing tax reform but there’s a risk the noise around Trump will overwhelm.
-
The US Federal Reserve’s likely winding down of its balance sheet (reversing quantitative easing) along with a possible transition to a new Fed Chair could cause volatility.
-
The Italian election due by May 2018 could reinvigorate Eurozone break up fears.
-
The European Central Bank is likely to slow its monetary stimulus next year.
-
North Korean risks could escalate.
-
The Sydney and Melbourne property markets – where a sharp downturn (which is not our view) could threaten Australian growth.
Concluding comments
This financial year will likely see the usual worry list and bouts of volatility and returns may slow from 2016-17, but the combination of reasonable global growth, solid profit growth and still easy monetary conditions suggest solid returns for diversified investors.
Source: AMP Capital 18 July 2017
Author: Dr Shane Oliver, Head of Investment Strategy and Economics and Chief Economist at AMP Capital is responsible for AMP Capital’s diversified investment funds. He also provides economic forecasts and analysis of key variables and issues affecting, or likely to affect, all asset markets.
Important note: While every care has been taken in the preparation of this article, AMP Capital Investors Limited (ABN 59 001 777 591, AFSL 232497) and AMP Capital Funds Management Limited (ABN 15 159 557 721, AFSL 426455) makes no representations or warranties as to the accuracy or completeness of any statement in it including, without limitation, any forecasts. Past performance is not a reliable indicator of future performance. This article has been prepared for the purpose of providing general information, without taking account of any particular investor’s objectives, financial situation or needs. An investor should, before making any investment decisions, consider the appropriateness of the information in this article, and seek professional advice, having regard to the investor’s objectives, financial situation and needs. This article is solely for the use of the party to whom it is provided.
From goldilocks to taper tantrum 2.0 – a bit of turbulence hits markets. 3 reasons not to be fussed.
For much of this year, there has been a surprising divergence between share and bond markets with shares up in response to improving growth and bond yields down in response to weak inflation. Some feared that either bonds or equities had it wrong, but in a way it seemed like Goldilocks all over again – not too hot (ie benign
Read More For much of this year, there has been a surprising divergence between share and bond markets with shares up in response to improving growth and bond yields down in response to weak inflation. Some feared that either bonds or equities had it wrong, but in a way it seemed like Goldilocks all over again – not too hot (ie benign inflation) but not too cold (ie good growth). However, the past week or so has seen a sharp back up in bond yields – mainly in response to several central banks warning of an eventual tightening in monetary policy. Over the last week or so, 10 year bond yields rose 0.2-0.3% in the US, UK, Germany and Australia. This may not seem a lot but when bond yields are this low it actually is – German bond yields nearly doubled. This caused a bit of a wobble in share markets. The big question is: are we seeing a resumption of the rising trend in bond yields that got underway last year and what does this mean for yield sensitive investments and shares? Since central banks are critical in all of this we’ll start there.
Central banks turn a (little) bit more hawkish
The action over the last week or so was largely driven by a somewhat more hawkish tone from key central bankers:
-
Fed Chair Janet Yellen is really continuing to reiterate that it’s appropriate to raise interest rates gradually. Nothing new there but comments by Yellen and other Fed officials referring to strength in share markets indicate that they don’t see share markets as a constraint to raising rates again.
-
More importantly, ECB President Draghi noted that “the threat of deflation is gone and reflationary forces are at play” and “political winds are becoming tailwinds” (presumably a reference to President Macron’s pro-reform and pro-Europe election victory in France, in particular) and that monetary policy will need to adjust once inflation rises.
-
Bank of England Governor Mark Carney indicated that “some removal of monetary stimulus is likely to become necessary” if risks continue to diminish.
-
Bank of Canada Governor Stephen Poloz repeated that rate cuts have done their job and that “we need to be at least considering that whole situation [low interest rates] now that the excess capacity is being used up”.
The last three basically signalled that thought is being given to an exit from ultra easy monetary policy. In the face of such seemingly synchronised comments, it’s little wonder bond yields rose. Perhaps the most significant was the shift in tone by Mario Draghi – with overtones of former Fed Chair Ben Bernanke’s indication in mid-2013 that the Fed will start phasing down (or tapering) its quantitative easing (bond buying) program. This saw bond yields back up and shares fall around 8% and became known as the “taper tantrum”. So maybe the current episode is “taper tantrum 2.0”.
Bonds and shares are a bit vulnerable to a correction
The rally in bonds this year had arguably gone a bit too far and positioning had become excessively long and complacent leaving them vulnerable to a rebound in yield that we are now seeing. Similarly, we have been concerned for some time that global shares are vulnerable to a correction given solid gains in most markets for the year to date and high levels of short-term investor optimism and complacency on some measures. As we have seen over the last week, worries about central bank tightening have provided a potential trigger. And this could have further to go if bond yields continue to back up sharply.
Three reasons not to be too fussed
However, there are several reasons not to be too concerned. First, the shift in the tone of central bank commentary just matches the improvement seen in global growth and the receding risks of deflation, so it is actually good news. Global business conditions indicators (or PMIs) are strong (next chart), the OECD’s leading economic indicators have turned up, jobs markets have tightened and global trade is up.

Source: Bloomberg, AMP Capital
In particular, Eurozone economic confidence readings – both for consumers and business – are strong and at their highest in nearly a decade (see the next chart). So it makes sense for Mario Draghi to sound a bit more upbeat. If growth relapses, easy money exit talk will pause or fade too – much as we have seen in the US at various points over the last four years.

Source: Bloomberg, AMP Capital
Second, with underlying inflationary pressures remaining weak, monetary tightening is likely to remain very gradual. There are two main forces serving to keep inflation down:
-
Because of years of below-trend growth globally, spare capacity remains and this will constrain core inflation. While headline inflation bounced over the last year, this was largely due to the bounce in energy prices, which has not been sustained, whereas core inflation remains very subdued (at 1.4% year on year in the US, 1.1% in the Eurozone and zero in Japan). This partly reflects continuing spare capacity, which limits pricing power. As can be seen in the chart below whenever the capacity utilisation measure is around zero or below inflation tends to fall or remain soft. Of course this is a cyclical factor that will eventually fade.

Source: Bloomberg, AMP Capital
-
At the same time structural factors continue to bear down on inflation including technological innovation – eg, artificial intelligence and robots hollowing out the middle class and along with a rising services sector weighing on wages growth, Amazon reaping havoc on retailer margins in the US and potentially soon too in Australia, and Verizon in the US moving to unlimited mobile data plans (won’t this kill the need for the NBN for most households?).
As a result of these cyclical and structural factors, corporate pricing power and wages growth remains weak just about everywhere. The lack of significant inflation pressure will keep central banks gradual as we have seen with the Fed over the last four years since the taper tantrum of 2013:
-
The Fed – while Janet Yellen does not appear to be too concerned about inflation running below target (its currently 1.4% against the Fed’s 2% target) because she believes that the tight US labour market will eventually drive higher wages growth and inflation, others at the Fed have expressed concern about the inflation undershoot and so a slowing in Fed rate hikes is possible (eg, no hike in September, hike in December). There is certainly nothing in what Yellen has said pointing to a faster tightening.
-
The ECB – Mario Draghi is right to warn policy will need to adjust once inflation rises. But at this stage there is little evidence of much tick up in underlying inflation in Europe. The total of unemployment and underemployment in the Eurozone at 18.5% is about 4 percentage points above where it was prior to the GFC acting as a huge constraint on wages growth. And political risk around Italy will slow Draghi from moving too quickly. Our view remains that the ECB will announce a slowing (or taper) in its quantitative easing program later this year (from €60bn a month to maybe €30bn a month for 2018) but that rate hikes are a way off.
-
The Bank of Japan – with inflation stuck at zero and the BoJ committing last September to continuing quantitative easing and a zero 10 year bond yield until inflation rises above 2%, it’s likely years from any exit from easy money.
-
RBA – while the drag from plunging mining investment is fading and the RBA remains upbeat, soft consumer spending, slowing housing investment, high underemployment and record low wages growth are likely to prevent a rate hike for at least a year or more. So we have seen no hawkish tilt from the RBA.
Finally, even though global monetary policy has gradually tightened thanks to four Fed hikes over the last two years, it’s a very long way from tight levels that will bring the bull market in shares to an end. As such – barring an exogenous shock – this global growth cycle and bull market in shares will likely remain long and drawn out.
Implications for investors
At the time of the 2013 taper tantrum, there was much fear that an end to US money printing would lead to a major bear market, send bond yields sharply higher (as one source of bond buying dried up) and imperil the US and global economy. In the event it was a bit of a non-event as shares resumed their uptrend and the global economy continued to recover. The same is likely to be the case with the latest taper tantrum:
-
With inflationary pressures remaining weak and monetary tightening likely to remain gradual (and non-existent in many countries including Australia for some time) the uptrend in bond yields is likely to remain gradual too.
-
While shares remain vulnerable to a short-term correction (on easy money exit talk), with monetary tightening likely to remain gradual and dependent on a further improvement in growth it’s unlikely to become tight enough to cause a major bear market in shares any time soon.
-
The search for yield will likely continue but may fade in intensity as bond yields gradually rise. This probably means that, while listed bond proxies such as global real estate trusts and listed infrastructure may be constrained as they were initial beneficiaries of the search for yield, unlisted property and infrastructure have further to go.
Exiting from ultra easy money not the end of the world
Finally, for those who say that central banks can never exit money printing and zero interest rates – just look at the US! Over the last four years, the Fed has phased down and stopped money printing or bond buying, raised interest rates four times and announced that it will start allowing its bond holdings to run down by phasing down the rolling over of maturing bonds in its portfolio. Each of these moves have caused uncertainty but have not crashed the US bond market, shares or the economy. Other central banks are likely to follow the Fed model.
If you would like to discuss anything in this report, please call us on |PHONE|.
Source: AMP Capital 5 July 2017
Author
Dr Shane Oliver, Head of Investment Strategy and Economics and Chief Economist at AMP Capital is responsible for AMP Capital’s diversified investment funds. He also provides economic forecasts and analysis of key variables and issues affecting, or likely to affect, all asset markets.
Important note: While every care has been taken in the preparation of this article, AMP Capital Investors Limited (ABN 59 001 777 591, AFSL 232497) and AMP Capital Funds Management Limited (ABN 15 159 557 721, AFSL 426455) makes no representations or warranties as to the accuracy or completeness of any statement in it including, without limitation, any forecasts. Past performance is not a reliable indicator of future performance. This article has been prepared for the purpose of providing general information, without taking account of any particular investor’s objectives, financial situation or needs. An investor should, before making any investment decisions, consider the appropriateness of the information in this article, and seek professional advice, having regard to the investor’s objectives, financial situation and needs. This article is solely for the use of the party to whom it is provided.
It’s been a good year for investors
The end of financial year is with us, and if we take a look at how some of the major asset classes have performed, it turns out the last 12 months have been pretty good for investors.
Residential property has stolen the limelight, with figures from CoreLogic showing property values have climbed 8.3% across our state capitals over the past year. But
Read MoreThe end of financial year is with us, and if we take a look at how some of the major asset classes have performed, it turns out the last 12 months have been pretty good for investors.

Residential property has stolen the limelight, with figures from CoreLogic showing property values have climbed 8.3% across our state capitals over the past year. But as market conditions vary widely between locations it’s important to look at the picture on a state-by-state basis. Over the last 12 months for instance, the property markets in Sydney (up 11.1%) and Melbourne (11.5%) have done most of the heavy lifting for the national figure. Perth and Darwin have been far less rewarding with values falling by 3.8% and 6.4% respectively.
The thing is, while property attracts the lion’s share of attention, plenty of other investments have outperformed bricks and mortar. Figures from Morningstar show that over the current financial year to the end of May, Australian shares dished up total returns – capital growth plus dividends, of 13.89%.
A number of global sharemarkets have performed well too, and that’s been good for international shares with gains of 17.84%. Infrastructure investments also turned in a solid result, with the S&P Global Infrastructure index showing returns of 13.73%.
By contrast, cash returns remain in the doldrums. At best, you may earn 3.0% on a 12-month term deposit right now, and after tax and inflation you will be lucky to keep your purchasing power, let alone go forward.
Of course, cash still plays a role in any portfolio – just how much of a role will depend on your life stage. As I am now in my 60s I am moving from a wealth-creation to a wealth-preservation strategy. Logically, I should be taking less risk because if I lose lumps of capital it is hard for me to replace it through work as my working years are winding down. But for younger investors with time on their side, it’s worth holding a decent chunk of your portfolio in growth assets.
This can be achieved by steadily drip-feeding spare cash directly into individual shares. Or it can be done by investing in managed funds – or a combination of both.
Bear in mind, growth assets don’t always deliver the positive returns we’ve seen this financial year. They can, and do, fall into negative territory at times, which is why investors should take a long-term outlook.
No one can say for sure how investment markets will perform in the financial year ahead, but spreading your money across a variety of investments is a smart way to manage risk while benefiting from any market upswings.
For more information about investing contact us on |PHONE|.
Paul Clitheroe is a founding director of financial planning firm ipac, Chairman of the Australian Government Financial Literacy Board and chief commentator for Money Magazine.
Source: AMP 22 June 2017
Important:
This article provides general information and hasn’t taken your circumstances into account. It’s important to consider your particular circumstances before deciding what’s right for you. Although the information is from sources considered reliable, we do not guarantee that it is accurate or complete. You should not rely upon it and should seek qualified advice before making any investment decision. Except where liability under any statute cannot be excluded, we do not accept any liability (whether under contract, tort or otherwise) for any resulting loss or damage of the reader or any other person.
Global political risks one year on from Brexit – what have we learned?
It’s now 12 months since the British voted to leave the European Union, an event that some saw as setting off a domino effect of other European countries looking to do the same. This was also followed by a messy election result in Australia, Donald Trump’s surprise victory in the US presidential election, increasing concern around North Korea
Read MoreIntroduction

It’s now 12 months since the British voted to leave the European Union, an event that some saw as setting off a domino effect of other European countries looking to do the same. This was also followed by a messy election result in Australia, Donald Trump’s surprise victory in the US presidential election, increasing concern around North Korea and a steady flow of terrorist attacks. The combination of which seemed to highlight that geopolitics is now more important, and perhaps more threatening, for investors than had previously been the case. But while political developments have figured highly over the last year, the impact on markets has been benign. Since the Brexit vote, global shares are up 22% and Australian shares are up 13%. So what gives? This note looks at the main issues.
Why so little impact?
There are a number of reasons why the impact on investment markets from geopolitical events starting with Brexit has been short lived or non-existent over the last year or so:
-
Europeans have refused to play along. Brexit was only going to have a significant impact on globally if it triggered a domino effect of countries seeking to exit the Euro, threatening its demise. But there has been no evidence of this with post-Brexit elections in Spain, Austria, the Netherlands and France all seeing dominant support for centrist pro-Europe parties. So Brexit has turned out to be a storm in an English teacup from a global perspective. There are several reasons why European countries have gone in a different direction to the UK: continental Europeans identify far more with “Europe” than the British do; it’s much harder to leave the Euro than just the European Union; people in Eurozone countries like the Euro; Europe generally does not have the same issues with inequality that have driven an anti-establishment backlash in the UK and US; and staying together makes Europeans feel stronger at a time of increased global uncertainty.

Source: Eurobarometer, AMP Capital
-
“Trump the pragmatist” is dominating “Trump the populist”. He has not withdrawn the US into isolationism, there is no trade war with China, he has appeared more focussed on pro-business policies such as deregulation and tax reform than populist policies, and he appears supportive of the Federal Reserve under Janet Yellen.
-
Global growth has improved. This and rising profits has swamped geopolitical worries.
-
Uncertainty over geopolitics has led to easier for longer monetary policy, notably in the US and Europe.
-
And finally, in Australia the Government was returned and the difficulties in the Senate really just mean a continuation of the past, ie not great, but no disaster.
Where are we now with geopolitical risks?
While the events of the last year highlight the importance of not getting too excited about geopolitical events, they are likely to remain important for investors to keep an eye on. There are several drivers of increasing geopolitical tensions:
First, a backlash against economic rationalist policies (deregulation, privatisation and globalisation) because of the slow post global financial crisis (GFC) recovery, rising inequality in some countries and stress around immigration. The danger is that this results in re-regulation, nationalisation, increased taxes and protectionism and other populist responses, which could slow growth and share markets. However, it is worth noting that this backlash against free market policies is a messy theme. It’s most acute in the US and UK as this is where inequality is greatest. See next chart, which shows Gini coefficients – a measure of income distribution – for major countries.
Politics in the UK has clearly swung to the left. But in the US while Donald Trump has tapped into popular discontent it’s doubtful that his policies (eg, cutting healthcare and corporate tax cuts) will deal with rising inequality and could just set the scene for a more left wing (Bernie Sanders-like) candidate winning the 2020 presidential election. And of course in Europe inequality has been less of an issue as it has always been more to the left anyway. In fact, France appears to be heading in a more rationalist direction

Data is after taxes and welfare transfers. Source: OECD, AMP Capital
Second, the relative decline of the US is shifting us away from the unipolar world that dominated after the end of the Cold War when the US was the global cop and most countries were moving to become free market democracies. Now we are seeing the rise of China, Russia’s attempt to revisit its Soviet past and efforts by other countries to fill the gap left by the US in various parts of the world create geopolitical tensions – what some have called a multi-polar world. This is evident in increasing tension between Saudi Arabia and Iran, Russia’s intervention in Ukraine, and tensions in the South China Sea.
Finally, rogue states seeking to or getting access to nuclear weapons and terrorism remain an ongoing threat, notably North Korea in relation to the former and IS in relation to terrorism.
Global geopolitical issues to keep an eye on
The following looks at geopolitical issues worth watching.
German election (September 24) – Chancellor Merkel looks on track to win but if she doesn’t the centre-left Social Democrat Party under new leader Martin Schulz will and its more pro-Europe than Merkel. Either way the result is likely to be stepped up German support (with France) for Eurozone integration.
Italian election (due by May 2018, but possibly later this year) – Italy remains a risk as support for the Euro there is weaker and it could cause a new round of break-up fears once its election date is fixed. But the waning of populist support across Europe may have a spill over in Italy. The supposedly Eurosceptic Five Star Movement seems to be wavering a bit in its Euroscepticism. Even if it does win the most seats in parliament, it won’t get a majority and is unlikely to be able to form a coalition government. And even if it did and managed to move Italy towards an Itexit, a market panic would drive Italian bond yields sharply higher forcing a back down. In any case, the risk of a domino-like flow on from an Itexit to the rest of the Eurozone looks to be weak given recent European elections.
Greece – Greece seems to be creeping towards some form of debt forgiveness but this may have to wait until after the German election. In any case, there is no longer a populist Eurosceptic party for the Greeks to turn to.
More broadly, at some point investment markets will presumably tire of fearing each time an election comes up in Europe that there is the risk of some form of Euro exit. This issue has been going on since 2010 and all we have really seen is a progressive move to more Europe, not less.
The US – impeachment risk – The main risk for investors in relation to the US is that the noise – or should that be comedy – around the Trump/FBI/Russia issue distracts the political process to such a degree that Trump’s pro-business agenda stalls. Our view remains, though, that while the Democrats may find something to impeach Trump on when they get control of the House of Representatives (as seems likely after the November 2018 mid-terms) in the meantime the Republicans are unlikely to impeach Trump. Rather, anticipation of the likely loss of control of Congress after November next year will see Republicans pull together to pass their pro-business agenda. In this regard, note that the Senate is progressing on a health care reform, which is a precursor to tax reform.
The US – shutdown/debt ceiling risk – In September, funding will have to be renewed for the US Government to avoid a shutdown and by early October the debt ceiling will need to be raised again. Both are likely to happen – as 2013 showed, no side wants to be blamed for a shutdown or debt default.
Terrorism – The impact of terrorism on investment markets has been declining since the 9/11 attacks to the point where recent attacks in Europe have had little impact. While terrorist attacks are horrible from a human perspective most don’t really have much economic impact and, after a while, economies and markets become desensitised to them to a degree.
Iran v Saudi Arabia – Tensions between Shia Iran and Sunni Saudi Arabia are likely to remain but are very unlikely to break out into warfare between the two.
North Korea – The risk here has risen as its missile tests have increased and within a few years it may have the capability to lob a missile with a nuclear warhead into the US (or Australia). A US missile strike is possible but would risk significant loss of life in Seoul and beyond. So a diplomatic solution aimed at containment is the most likely. Time will tell if this is successful but trying to protect an investment portfolio against the uncertain timing of North Korean risk is a bit like trying to protect it against a nuclear war in the Cold War.

Source: AMP Capital
China/US relations – Trade and the South China Sea tensions are the main issues here. So far so good with Trump looking to work through the trade issue with China and cool heads prevailing regarding the South China Sea. How the renegotiation of the North American Free Trade Agreement goes will provide some guide as how Trump is proceeding on trade. But so far it’s been more rational than feared.
Implications for investors
Based on the experience of the last year around geopolitical risks, there are several implications for investors:
First, turn down the noise. Geopolitical issues create much interest and are great for dinner party conversations, but as we saw over the last year this does not mean they will necessarily have a huge negative impact on investment markets.
Second, it’s hard to quantitatively build geopolitical risks into an investment process. You really have to understand each issue separately.
Finally, the ultra short-term impact of the Brexit and Trump election shocks – with both seeing an initial fall in share markets followed by market strength – highlights the benefit in looking for the opportunities geopolitical shocks throw up.
Source: AMP Capital 20 June 2017
About the Author
Dr Shane Oliver, Head of Investment Strategy and Economics and Chief Economist at AMP Capital is responsible for AMP Capital’s diversified investment funds. He also provides economic forecasts and analysis of key variables and issues affecting, or likely to affect, all asset markets.
Important note: While every care has been taken in the preparation of this article, AMP Capital Investors Limited (ABN 59 001 777 591, AFSL 232497) and AMP Capital Funds Management Limited (ABN 15 159 557 721, AFSL 426455) makes no representations or warranties as to the accuracy or completeness of any statement in it including, without limitation, any forecasts. Past performance is not a reliable indicator of future performance. This article has been prepared for the purpose of providing general information, without taking account of any particular investor’s objectives, financial situation or needs. An investor should, before making any investment decisions, consider the appropriateness of the information in this article, and seek professional advice, having regard to the investor’s objectives, financial situation and needs. This article is solely for the use of the party to whom it is provided.

