

Olivers Insights
The good news in the plunge in markets
Dr Shane Oliver – Head of Investment Strategy and Chief Economist, AMP Capital
IntroductionThe start of this year has been painful for investors with sharp losses in shares and bonds, dragging most superannuation funds into negative returns for the last financial year. And yet despite this setback and rough patches in
Read More– higher medium term return potential (assuming inflation is tamed)
Dr Shane Oliver – Head of Investment Strategy and Chief Economist, AMP Capital

Introduction
The start of this year has been painful for investors with sharp losses in shares and bonds, dragging most superannuation funds into negative returns for the last financial year. And yet despite this setback and rough patches in 2015, 2018 and in early 2020 with pandemic lockdowns, median balanced growth superannuation funds returned 8.4% pa over the 10 years to June after fees and taxes. While dull compared to the double digit returns of the 1980s and 1990s, it’s pretty good once low average inflation of 2% pa over the last decade is allowed for.
Balanced/growth superannuation fund returns
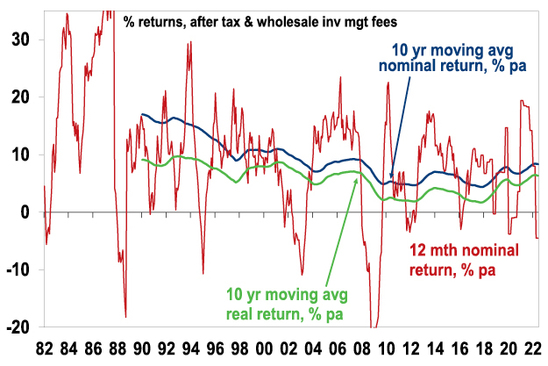
Source: Mercer Investment Consulting, Morningstar, AMP
However, returns have been boosted for decades by a “search for yield” as interest rates collapsed with falling inflation. This pushed down investment yields (bond yields, earnings yields on shares, rental yields on property, etc) and so pushed up asset values. But the sting in the tail was that ever lower yields meant an ever lower return potential for when yields eventually stopped falling. The good news in the recent fall in markets is that it’s pushed potential medium term returns back up a bit.
Lower yields = lower return potential & vice versa
Investment returns have two components: yield (or income flow) and capital growth. What gets confusing though is that the price of an asset moves inversely to its yield all other things being equal. For example, suppose an asset pays $5 a year in income and its price is $100 – this means an income flow or yield of 5%. If interest rates on bank term deposits are cut from say 3% to 1% this will likely encourage increased investor interest in the asset as investors will like its relatively high yield. Its price will then be pushed up – to say $120, which given the $5 annual income flow means that its yield will have fallen to 4.2% (ie, $5 divided by $120). This is great for investors who were already in the asset as its value has gone up by 20%. But its yield is now pointing to lower potential returns going forward (ie, 4.2% which is down from 5%), unless the yield continues to fall further boosting capital growth. But of course, there is a limit to this & it also works in reverse as maybe we are now starting to realise with the surge in inflation over the last year, which is pushing up interest rates, bond yields & yields on other assets.
The plunge in yields since the early 1980s
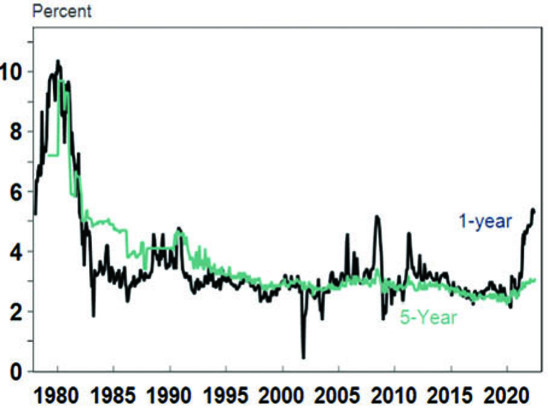
In the early 1980s, the RBA’s “cash rate” was around 14%, 1-year term deposit rates were nearly 14%, 10-year bond yields were around 13.5%, commercial and residential property yields were around 8-9% and dividend yields on shares were around 6.5% in Australia and 5% globally. This meant investments were already providing very high income so only modest capital growth was needed for growth assets to generate good returns. And then with the shift from very high inflation in the early 1980s to very low inflation up until recently, the last 40 years saw a collapse in yields. This was led by falling interest rates and then yields on other assets were pushed down too. See the next chart. Consistent with the explanation in the previous section this led to strong average returns for diversified investors through the last 30 or 40 years, despite periodic setbacks like the 1987 crash, the tech wreck and the GFC.
Australian investment yields
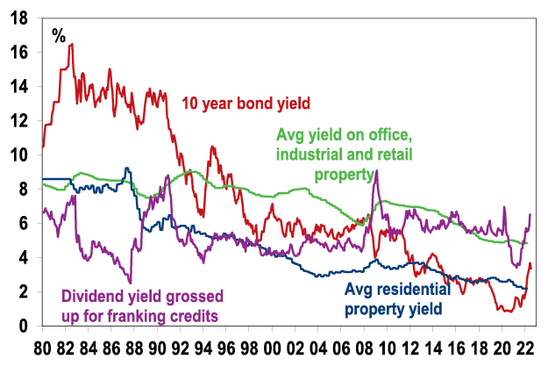
Source: Bloomberg, REIA, JLL, AMP
At their recent low point the RBA’s official cash rate fell to 0.1%, average bank 1-year term deposit rates fell to 0.25%, 10-year bond yields fell to 0.6%, gross residential property yields fell to 2.2%, commercial property yields fell below 5%, dividend yields fell below 4% for Australian shares (with franking credits) and just 2% for global shares. The problem was that with the cash rate and bond yields around zero there wasn’t much further for yields to keep falling. This saw our assessment of nominal medium term return projections for a balanced growth mix of assets fall below 5%. The good news is that with yields on cash, bonds and shares now up and asset prices down their return potential has improved.
Medium-term (ie, 5 to 10 year) return projections
Our approach to get a handle on medium-term return potential of major asset classes is to start with current yields and apply simple and consistent assumptions regarding capital growth. We also prefer to avoid forecasting and like to keep it simple.
-
For bonds, the best predictor of future medium-term returns is current bond yields – as can be seen in the next chart. If a 10-year bond is held to maturity its initial yield (3.3% right now in Australia) will be its return over 10 years. This is still low historically but well up from a low of just 0.6% in 2020.
Australian bonds – the higher the bond yield the better the return
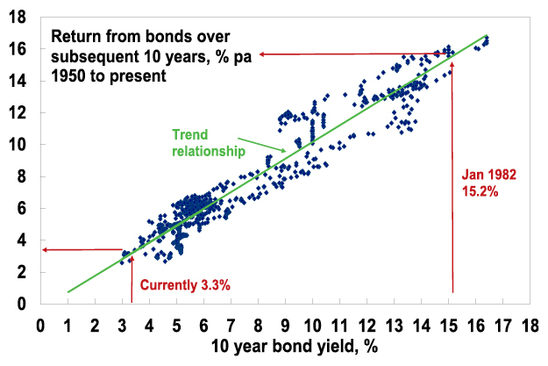
Source: RBA, Bloomberg, AMP Capital
-
For equities, current dividend yields plus trend nominal GDP growth (a proxy for capital growth) does a good job of predicting medium-term returns.i The Australian dividend yield is up by more than 1% from late last year.
-
For property, we use current rental yields and likely trend inflation as a proxy for rental and capital growth. The surge in online spending and “work from home” means greater than normal uncertainty around these returns at present.
-
For unlisted infrastructure, we use current average yields and capital growth just ahead of inflation.
-
In the case of cash, the current rate is of no value in assessing its medium-term return. So, we allow for our forecast cash rate over medium term.
Our latest return projections are shown in the next table. The second column shows each asset’s current income yield, the third shows their 5-10 year growth potential, and the final column shows their total return potential. Note that:
-
We assume inflation averages around 2.5% pa, and this has been revised up from 1.5% pa (after years of low inflation pre-pandemic). We are assuming that central banks are successful in bringing inflation back to around target and keeping it there on average over the next 5-10 years.
-
We have cautious real economic growth assumptions reflecting the: retreat from globalisation, deregulation and small government in favour of populist, less market friendly policies; rising geopolitical tensions between the West and China/Russia; and aging populations and slowing population growth – resulting in slowing labour force growth. All of which will likely constrain capital growth for growth assets.
Projected medium term returns, %pa, pre-fees and taxes
|
|
Current Yield # |
Growth |
= Return |
|
World equities |
2.8^ |
4.7 |
7.5 |
|
Asia ex Japan equities |
2.3^ |
7.4 |
9.7 |
|
Emerging equities |
0.1^ |
7.3 |
7.4 |
|
Australian equities |
5.0 (6.5*) |
3.7 |
8.7 (10.2*) |
|
Unlisted commercial property |
4.8 |
2.5 |
7.3 |
|
Australian REITS |
4.7 |
2.5 |
7.2 |
|
Global REITS |
3.9^ |
2.5 |
6.4 |
|
Unlisted infrastructure |
3.7*^ |
3.0 |
6.7 |
|
Australian bonds (fixed interest) |
3.2 |
0.0 |
3.2 |
|
Global fixed interest ^ |
3.2 |
0.0 |
3.2 |
|
Australian cash |
2.5 |
0.0 |
2.5 |
|
Diversified Growth mix * |
|
|
6.8 |
# Current dividend yield for shares, distribution/net rental yields for property and duration matched bond yield for bonds. ^ Includes forward points. * With franking credits added in. Source: AMP
Key observations
-
After falling for many years due to the fall in starting point yields for major assets the medium-term return potential using this approach fell below 5% in late 2020 but has improved this year to nearly 7%. This is partly due to a 1% higher medium term inflation assumption, but the rest is due to the rise in interest rates, bond yields and yields on assets including shares over the last year. This is the silver lining to the cloud (or rather storm) that has hit investment markets.
Projected medium term returns
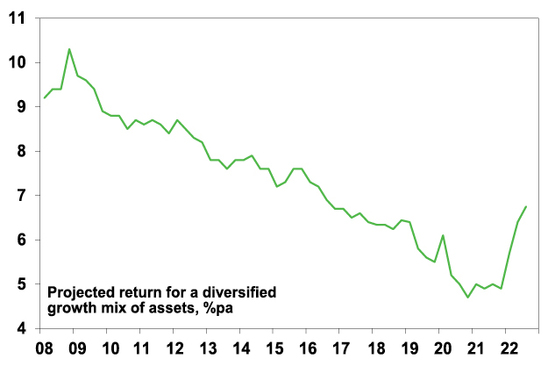
Source: AMP
-
The return potential from commercial property and infrastructure has not improved much because their yields have not risen unlike those for bonds and shares (as their valuations lag). There is also greater uncertainty in the demand for office and retail space as the full impact from working from home and on-line retail is yet to impact rents.
-
The return potential of bonds is still poor but with now higher bond yields its well up from the lows of the last two years.
-
Australian shares stack up well on the basis of yield and Asian shares stack up well for growth potential.
-
The main downside risk to our medium-term projections is that inflation trends even higher driving a further trend rise in interest rates, bond yields and yields on other assets (including property & infrastructure) resulting in an ongoing drag on capital growth (ie, further reversing the “search for yield” driven surge in values over the last 30 years or so).
Implications for investors
-
First, bear markets are painful and are hard to predict, but they do push up the medium-term return potential of shares and so provide opportunities for investors
-
Second, have reasonable return expectations. Interest rates and investment yields are still historically low so its unreasonable to expect sustained double-digit returns.
-
Finally, focus on assets with decent sustainable income flow as they provide confidence regarding future returns.
Source: AMP Capital July 2022
i Adjustments can be made for: dividend payout ratios (but history shows retained earnings often don’t lead to higher returns so the dividend yield is the best guide); the potential for PEs to move to some equilibrium level (but forecasting the equilibrium PE can be difficult and dividend yields send valuation signals anyway); and adjusting the capital growth assumption for some assessment regarding profit margins (but this is hard to get right). So, we avoid forecasting these things.
Important note: While every care has been taken in the preparation of this document, AMP Capital Investors Limited (ABN 59 001 777 591, AFSL 232497) and AMP Capital Funds Management Limited (ABN 15 159 557 721, AFSL 426455) make no representations or warranties as to the accuracy or completeness of any statement in it including, without limitation, any forecasts. Past performance is not a reliable indicator of future performance. This document has been prepared for the purpose of providing general information, without taking account of any particular investor’s objectives, financial situation or needs. An investor should, before making any investment decisions, consider the appropriateness of the information in this document, and seek professional advice, having regard to the investor’s objectives, financial situation and needs. This document is solely for the use of the party to whom it is provided.
Inflation in the 70s – baby boomer fantasy or nightmare?
Dr Shane Oliver – Head of Investment Strategy and Chief Economist, AMP Capital
IntroductionI grew up in the 1970s and it was fun – Abba, Elvis, Wings, JPY, flares, cool cars, etc. But economically it was a mess. Inflation surged and so did unemployment. And it was bad for investors too.
Read MoreWhy central banks must focus on getting inflation back down
Dr Shane Oliver – Head of Investment Strategy and Chief Economist, AMP Capital
Introduction
I grew up in the 1970s and it was fun – Abba, Elvis, Wings, JPY, flares, cool cars, etc. But economically it was a mess. Inflation surged and so did unemployment. And it was bad for investors too. After years of economic pain voters turned to economically rationalist political leaders – like Thatcher, Reagan and Hawke & Keating – to fix it up. Their policies to boost productivity ultimately culminating in independent inflation targeting central banks along with the help of globalisation, more competitive workforces and the IT revolution got inflation under control from the 1980s and 1990s. So much so that there was even talk of “the death of inflation”. The experience of the last year when inflation has surged tells us that unlike the parrot in Monty Python it really wasn’t dead but just resting. Initially its rise was seen as “transitory”. And many are still questioning why central banks need to do much – what will RBA rate hikes do to bring high lettuce prices back down? – and that central bank worries about wages growth picking up causing a wage price spiral are just a baby boomer fantasy. So just sit it out. The 1970s experience suggests otherwise.

So what happened in the 1970s?
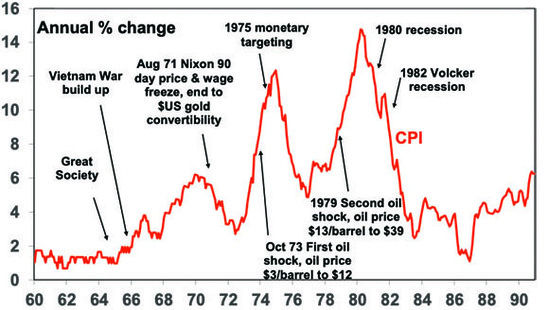
Many associated the inflation of the 1970s with the oil shocks of 1973 and 1979 but it actually got underway before that.
US inflation, 1960 to 1990
Source: Bloomberg, AMP
From around the mid-1960s inflation started moving up, notably in the US and then later in Australia reflecting a combination of:
-
A big expansion in the size of government and welfare.
-
Disruption associated with the Vietnam War.
-
Tight labour markets (with unemployment falling to 3.4% in 1969 in the US and spending most of the 1960s below 2% in Australia) led to more militant workers and surging wages.
-
Easy monetary policies which supported high inflation.
-
Social unrest & industry protection also played a role.
From 1965 to 1969 US inflation rose from below 2% to above 6%. US monetary policy was tightened driving a recession in 1969-70 which saw inflation dip. Monetary policy was then eased but before inflation came under control so it bottomed well above 1960’s lows and started up again forcing a return to monetary tightening. In 1973 inflation had already increased to 8% before the OPEC shock. The same whipsaw happened after another recession in 1974-75 which saw inflation bottom out above its previous high only to take off again. The process only ended with the deep recessions of the early 1980s.
US inflation, wages grth & unemployment, 1960-90
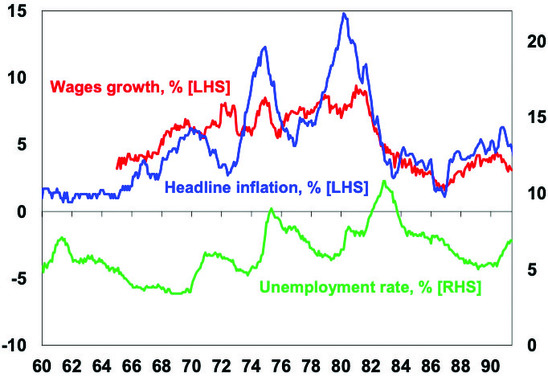
Source: ABS, AMP
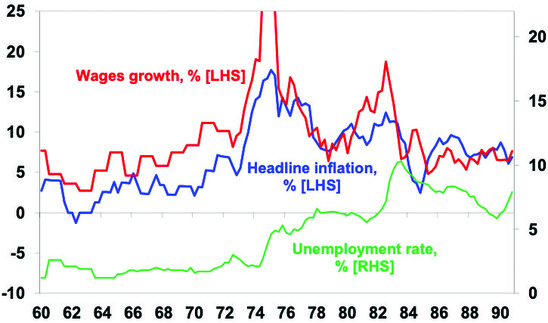
It was pretty much the same story in Australia, although here it started more in the early 1970s and was made worse by 20% plus wages growth and massive fiscal stimulus in 1974.
Australian inflation, wages grth & unemployment, 1960-90
Source: ABS, AMP
And in Australia, the automatic indexation of wages to inflation from 1975 just helped lock in high inflation (as wages add to costs) with only the 1983 Accord breaking the nexus by trading off wage increases for tax cuts and social benefits.
The end result was a decade of high inflation and high unemployment. The problem was that policy makers were too slow to realise the extent of the inflation problem initially and then were too quick to ease which enabled inflation to quickly pick up again and move higher. The longer inflation persisted the more inflation expectations rose – with wage growth rising – making it harder to get inflation back down.
Why the concern today?
There are several reasons for concern about a return to the sustained high inflation of the 1970s today:
-
Labour markets are very tight once again. Wages growth in the US has already increased to around 5%.
-
Demand has been strong suggesting that the problem is not just due to supply disruptions.
-
We are seeing a run of supply shocks – with notably the war in Ukraine, another energy crisis & repeated floods locally.
-
Government policy has swung away from the economic rationalist approaches of the 1980s – with more tolerance for bigger more interventionist government – as median voters have swung back to the left.
- The globalisation that followed the end of the USSR and trade with China is under threat and appears to be reversing, not helped by a desire to onshore supply chains.
-
This is being reinforced by geopolitical tensions which are boosting defence spending which adds to metal demand.
-
Decarbonisation will boost near term costs & metal demand.
-
The ratio of workers to consumers is falling and the entrance of millennials to the workforce replacing retiring baby boomers will depress productivity (just as the boomers did in the 1970s).
-
Policy makers were caught focussing on the last war of disinflation coming out of the pandemic just as they were in the 1960s when the big fear was a return to 1930s deflation. This saw massive fiscal stimulus and money supply growth.
-
Inflation is now very high at around 9% in the US, Europe and UK and an estimated 6% in Australia and as we saw in the 1970s the longer it remains high the more businesses and workers will expect it to remain high and they will plan accordingly. That is, inflation expectations will move up, which will make it harder to get inflation back down.
So while central banks can’t do much to boost the supply of lettuces and lower petrol prices they are right to have moved to a more aggressive strategy as it will slow demand and by stressing that they are committed to returning inflation to target will help keep inflation expectations down.
Why high inflation is bad news for investors?
The 1970s experience warns it’s in investors long term interest to get inflation under control even if it involves a bit of short term pain. For investment markets high inflation is bad as it means:
-
Higher interest rates – which makes cash more attractive and other assets relatively less attractive.
-
Higher economic volatility and uncertainty – the period from 1969 to 1982 saw four recessions in the US and three recessions in Australia. This means that investors will demand a higher risk premium to invest.
-
For shares, a reduced quality of earnings as firms tend to understate depreciation when inflation is high.
The first two mean rising bond yields which means capital losses for investors in bonds. This tends to unfold gradually.
All three mean shares tend to trade on lower price to earnings multiples when inflation is high, and real growth assets (like property) generally tend to trade on higher income yields. This was seen in the high inflation 1970s when shares struggled. It means that the boost to earnings (or say rents in the case of property or infrastructure) from inflation tends to be offset by a negative valuation effect as investors demand lower PEs/higher yields. See here for a deeper explanation.
So the bottom line is that a sustained period of high and rising inflation can be a problem for bonds, shares and other growth assets. As can be seen in the next chart, the high inflation 1970s was one of the few decades to see poor real (ie after inflation) returns from bonds and shares.
The 1970s saw poor returns from shares and bonds
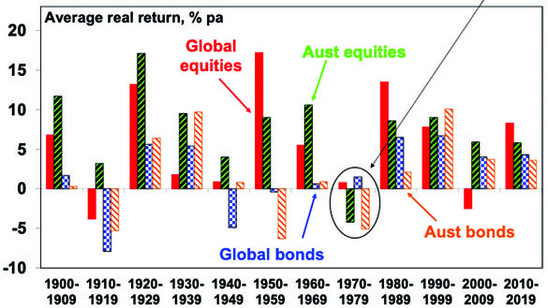
Source: Global Investment Return Yearbook ABN/AMRO, Bloomberg, AMP
So, it’s in investors’ interest that inflation is kept low and stable.
Reason for optimism a return to the 1970s is unlikely
While many of the structural forces that drove the disinflation of the last few decades are reversing and suggest higher inflation over the decade ahead than seen pre-pandemic, sustained 1970s style high inflation appears unlikely:
-
Central banks understand the problem and the need to keep inflation expectations down, and are now committed to bringing inflation back to target with Fed saying the commitment is “unconditional” (even if it means a recession) and the RBA saying it will do “what is necessary”.
-
While inflation is high, longer term inflation expectations remain low (at 3.1% in the US compared to nearly 10% in 1980) and wages growth is still relatively low suggesting it should be easier to bring inflation down than it was in 1980.
US University of Michigan Consumer Inflation Expectations
Source: Macrobond, AMP
-
Related to this labour markets are far more competitive today with much lower levels of unionisation. In Australia, only 14.3% of employees (including me) are in a union whereas in 1976 it was at 51% of employees.
-
Finally, as we noted here there are signs of easing cyclical inflation pressure in the US & its leading by about 6 months.
So, while inflation may not go back to pre-pandemic lows and the longer-term tailwind for investment markets from ever lower inflation and interest rates may be behind us, a full on return to the 1970’s malaise looks unlikely.
Source: AMP Capital July 2022
Important note: While every care has been taken in the preparation of this document, AMP Capital Investors Limited (ABN 59 001 777 591, AFSL 232497) and AMP Capital Funds Management Limited (ABN 15 159 557 721, AFSL 426455) make no representations or warranties as to the accuracy or completeness of any statement in it including, without limitation, any forecasts. Past performance is not a reliable indicator of future performance. This document has been prepared for the purpose of providing general information, without taking account of any particular investor’s objectives, financial situation or needs. An investor should, before making any investment decisions, consider the appropriateness of the information in this document, and seek professional advice, having regard to the investor’s objectives, financial situation and needs. This document is solely for the use of the party to whom it is provided.
2021-22 saw poor investment returns – the bad news and the good
Dr Shane Oliver – Head of Investment Strategy and Chief Economist, AMP Capital
Key points2021-22 was a rough year for investors as high inflation, rising interest rates and recession fears impacted.
Shares could still fall further as interest rates continue to rise and recession risks are high. However, inflation pressures are showing some signs of easing which may take pressure off
Read MoreDr Shane Oliver – Head of Investment Strategy and Chief Economist, AMP Capital
Key points
-
2021-22 was a rough year for investors as high inflation, rising interest rates and recession fears impacted.
-
Shares could still fall further as interest rates continue to rise and recession risks are high. However, inflation pressures are showing some signs of easing which may take pressure off central banks from later this year.
-
Some key things for investors to keep bearing in mind are that: share pullbacks are healthy and normal; selling shares after a fall locks in a loss; share pullbacks provide opportunities for investors to buy them more cheaply; and to avoid getting thrown off a long-term investment strategy it’s best to turn down the noise.

Introduction
The past financial year was poor for investors as inflation, rising interest rates and recession fears hit investment markets. This note reviews the past 12 months and looks at the outlook.
Inflation and recession worries
While inflation was on the rise in the six months to December pushing up bond yields the impact for share markets was swamped by economic recovery from the pandemic and surging share markets so overall returns slowed but were still positive. The last six months have been a lot tougher though:
-
The surge in shares from their pandemic lows in 2020 into late 2021 had left them vulnerable to a pullback.
-
Inflation rose to its highest levels in decades reaching 8.6% in the US and Europe and an estimated 6% in Australia, reflecting distortions to demand and supply bottlenecks due to the pandemic. This was made worse by the war in Ukraine and lockdowns in China along with the electricity crisis and floods in Australia.
-
This pushed central banks to start raising interest rates aggressively to slow demand and stop inflation expectations rising (which would make it even hard to get inflation down).
-
This in turn led to increasing concerns of a recession.
-
The war in Ukraine and tensions with China have added to uncertainty.
-
A surge in bond yields (with Australian 10 year bond yields rising from 1.55% to 3.66%) on the back of surging inflation and interest rates added to downwards pressure on share markets by pushing price to earnings multiples lower.
Poor returns
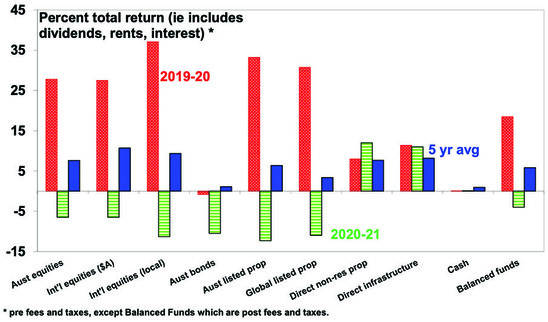
The net result has been poor investment returns over the last financial year for most listed assets as can be seen in the next chart.
2021-22 – major asset class returns
Source: Bloomberg, AMP
Bonds have had their worst 12 month return in decades as the surge in bond yields resulted in capital losses for investors. Australian bonds lost 10.5% over the last 12 months which is worse than their losses in the “bond crash” of 1994 and looks to be their worst 12 month loss since the 1973 or the 1930s. The severity of the loss reflects the low starting point yield and the speed of the rise in bond yields.
Returns from Australian bonds over rolling 12 month periods
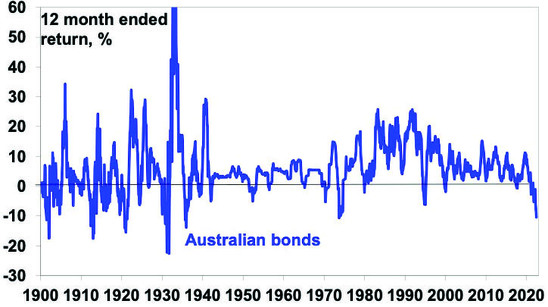
Source: Bloomberg, RBA, AMP
Global shares lost 11.1% in local currency terms. A fall in the growth sensitive Australian dollar saw this reduced to a loss of 6.5%. Bear in mind this followed gains of 37% and 28% respectively in the previous financial year.
Naturally the most speculative assets like tech stocks (with Nasdaq losing 24%) and crypto currencies (with Bitcoin down 46%) were hit the hardest. But commodities returned 22.5% in US dollars due to strong demand, supply shortages & the war.
Australian shares were also dragged down – particularly as the RBA got more aggressive in raising rates in June – with a loss in the last financial year of 6.5%.
High bond yields and falling share markets also weighed on real estate investment trusts.
Unlisted commercial property and infrastructure provided solid returns although these often lag returns from listed assets. Australian residential property prices rose 11% but price gains progressively slowed and have now started to fall as poor affordability and rising mortgage rates hit the property market.
Combined, this drove an estimated average loss on balanced growth superannuation funds of -3 to -5% after fees & taxes.
Balanced/growth superannuation fund returns
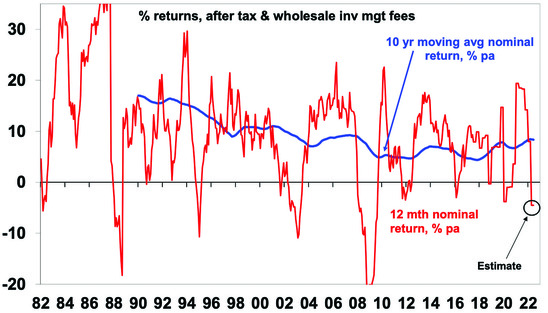
Source: AMP
It’s worth putting this in context though as in the 2020-21 financial year balanced growth super funds returned around 18.5% and over the last five years they returned 5.8% pa which is solid given that inflation averaged 2.6% pa.
Conservative superannuation funds are likely to have had a similar or worse loss in the financial year reflecting the hit to bond returns. Normally bonds are a safer less volatile asset class than shares, and so conservative funds tend to have a higher exposure to them than shares. However, every so often bonds have a rough ride at the same time as shares – usually when inflation is a big problem and central banks are raising interest rates which pushes up bond yields rapidly resulting in negative returns from both fixed income (as bonds suffer a capital loss when yields rise) & shares. The result is that both conservative and balanced growth funds can have poor returns in such environments as we have seen over the last year.
The last time we saw something similar with poor returns from conservative and balanced funds was in the bond crash of 1994 when inflation fears saw central banks including the RBA raise interest rates aggressively from emergency levels after the early 1990s recession. This time around inflation has been much higher and bond rates have increased from even lower levels and so it’s been even more severe for bonds.
The big lesson from 2021-22
The big lesson from 2021-22 was that inflation – long thought to be dead and a baby boomer nightmare from the 1970s – was just resting and can raise its ugly head when the circumstances are right. And the last year showed just how much damage it can do to assets like bonds and shares if it gets out of control. The good news is that central banks are taking the threat seriously providing confidence that permanently much higher inflation will avoided (and that bonds may go back to being a good diversifier for shares). Given the disaster the 1970s was for economies and investments I would rather endure the short-term pain of putting the inflation dragon back in its cave than let it continue to roam free torching economies and investments.
The bad news – shares may still fall further
The bad news is that inflation is still rising (and expected to rise to 7%yoy in Australia this year) and where it’s not it’s still too high for comfort (eg with core private consumption deflator inflation in the US at 4.7%yoy), inflation expectations still risk breaking higher which would make it even harder to get inflation back down and central banks “unconditional” (in the words of Fed Chair Powell) focus on keeping inflation expectations down and returning inflation to target means even higher interest rates which is resulting in a rising risk of recession. And risks remain high around the war with Ukraine particularly with Russia seemingly starting to reduce gas flow to Germany.
So the bottom line remains that until there is clear evidence inflation is falling central banks will continue tightening, keeping recession risk high. And if a recession eventuates shares likely have more downside as earnings start to fall, because the falls in markets so far mainly reflect a valuation adjustment (ie lower PEs) in response to higher bond yields. Given the uncertainties it’s still too early to say that shares have bottomed. The September quarter is traditionally weak for shares which suggests shares could still fall into September or October.
The good news
Slowing economic data globally, as highlighted by a decline in the US ISM index, signs that US core inflation and wages growth may have peaked and a continuing decline in our US Pipeline Inflation Indicator as upstream price pressures ease – with falling work backlogs, freight rates, metal prices and grain prices – are positive signs in that they suggest pressure may come off central banks later this year enabling them to ease up on the interest rate brake in time to avoid a recession.
AMP Pipeline Inflation Indicator
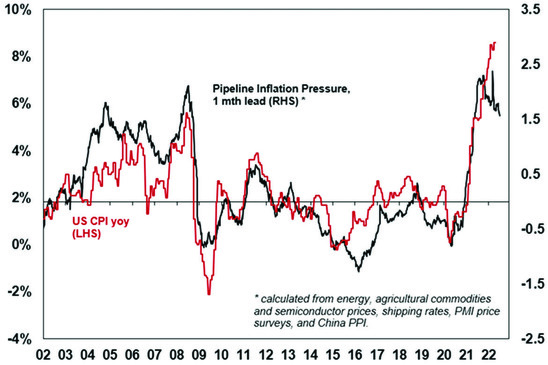
The Inflation Pipeline Indicator is based on commodity prices, shipping rates and PMI price components. Source: Macrobond, AMP
In Australia, low consumer confidence and falling home prices indicate monetary tightening is already starting to get traction reflecting higher household debt levels and that the tightening started last year with rising fixed rates as the RBA ended its yield target. This in turn is likely to limit how much the RBA needs to, and will, raise rates to well below the 3.5% plus cash rate that the futures market has factored in. We continue to see the cash rate peaking around 2.5% in the first half next year.
So while share markets could fall further in the next few months, cooling demand and reduced supply bottlenecks hence cooling inflation pressures could start to take pressure off central banks later this year thereby avoiding recession (or at least a severe recession) and enabling share markets to move higher on a 12 month view.
Things for investors to keep in mind
Of course, short term forecasting is fraught with difficulty and it’s best to stick to sound long term investment principles in times of uncertainty. Several things are worth keeping in mind at present: setbacks in shares are normal; selling shares or switching to a more conservative super strategy after falls just turns a paper loss into a real loss; when shares and other investments fall in value they are cheaper and offer higher long term return prospects; Australian shares still offer an attractive dividend yield versus bank deposits; shares and other assets often bottom with maximum bearishness; & during periods of uncertainty when negative news reaches fever pitch it makes sense to turn down the noise around investment markets in order to stick to an appropriate long term investment strategy.
Source: AMP Capital July 2022
Important note: While every care has been taken in the preparation of this document, AMP Capital Investors Limited (ABN 59 001 777 591, AFSL 232497) and AMP Capital Funds Management Limited (ABN 15 159 557 721, AFSL 426455) make no representations or warranties as to the accuracy or completeness of any statement in it including, without limitation, any forecasts. Past performance is not a reliable indicator of future performance. This document has been prepared for the purpose of providing general information, without taking account of any particular investor’s objectives, financial situation or needs. An investor should, before making any investment decisions, consider the appropriateness of the information in this document, and seek professional advice, having regard to the investor’s objectives, financial situation and needs. This document is solely for the use of the party to whom it is provided.
Australia’s Achilles’ heel – high household debt and rising interest rates
Dr Shane Oliver – Head of Investment Strategy and Chief Economist, AMP Capital
IntroductionIf Australia has an Achilles’ heel it’s the high level of household debt that has accompanied surging home prices over the last 30 years. Of course, in the absence of a major trigger for debt servicing
Read More…it’s not as bad as it looks, but it’s still an issue
Dr Shane Oliver – Head of Investment Strategy and Chief Economist, AMP Capital
Introduction
If Australia has an Achilles’ heel it’s the high level of household debt that has accompanied surging home prices over the last 30 years. Of course, in the absence of a major trigger for debt servicing problems – either from a surge in unemployment or a surge in interest rates – it hasn’t so far caused a major problem for the economy. Fears that the pandemic would deliver a trigger in the form of higher unemployment were quickly headed off by JobKeeper and record low interest rates. But a potential trigger is now upon us again with rising interest rates.

At one extreme some see rising interest rates and high household debt as setting the scene for a perfect storm of a surge in mortgage stress, forced selling and a crash in property prices causing a big hit to the economy. At the other extreme some point out that the household sector is actually in good shape given a surge in wealth including a big rise in bank deposits so there is no need for concern. The truth is probably in between these two extremes. And much depends on how high interest rates go. This note looks at the main issues.
Australia – from the bottom to the top in debt
The next chart shows the level of household debt relative to annual household disposable income for major countries.
Household debt to income ratios
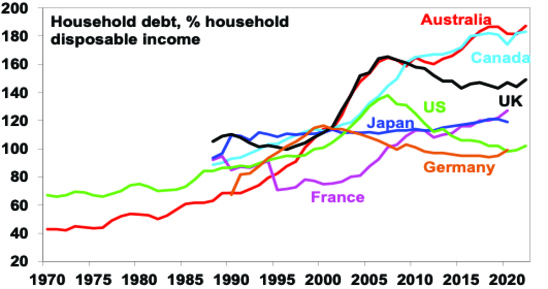
Source: OECD, ABS, RBA, AMP
While rising household debt has been a global phenomenon, debt levels in Australia have gone from the bottom of the pack to near the top. In 1990, there was on average $69 of household debt for every $100 of average household income after tax. Today, its $187 of debt for every $100 of after-tax income.
What’s driven the rise in debt?
The increase in debt reflects four things. First, increased competition amongst lenders following financial deregulation in the 1980s which made debt more available. Second, progressively lower interest rates since the late 1980s have made debt seem more affordable. Third, attitudes to debt have become more relaxed as memories of wars and severe economic downturns have faded so debt seems less risky at the same time that modern society encourages instant gratification as opposed to saving for what you want. So, each successive generation since the Baby Boomers have been progressively more relaxed about taking on debt. And finally, it’s become somewhat self-feeding in that rising debt has enabled home buyers to pay more for homes which in turn has necessitated rising debt levels to get into the property market.
The rise in household debt has gone hand in hand with higher home prices relative to incomes in Australia
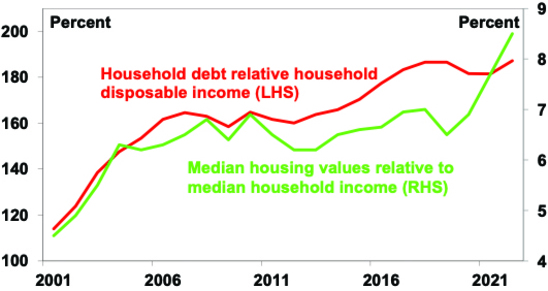
Source: ABS, CoreLogic, AMP
It’s not quite as bad as it looks
There are several reasons why it’s not quite as bad as it looks:
-
First, the rise in debt partly reflected a rational adjustment to lower rates and greater credit availability since the 1980s.
-
Second, household debt has been trending up since credit was invented. It is unclear what a “safe” level is.
-
The rise in debt has been exceeded by a rise in wealth. Thanks to a surge in the value of houses and financial wealth, we are far richer. In particular, thanks to low rates & recovery from the pandemic total household wealth rose 32% over the two years to the March quarter with the value of dwellings up 40%, super up 30% and bank deposits up 26% (as income and government payments were saved during the pandemic). The value of average household wealth has gone from 5 times average after-tax household income in 1990 to 11.4 times in the March quarter.
Aust household wealth and debt relative to income
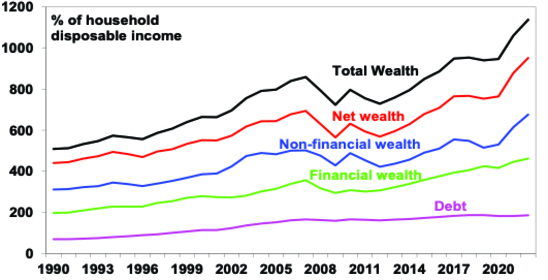
Source: ABS, RBA, AMP
So, while average household debt for each Australian has risen from $11,779 in 1990 to $107,318 now, average wealth per person has surged from $87,489 to $655,894.
Australian per capita household wealth and debt
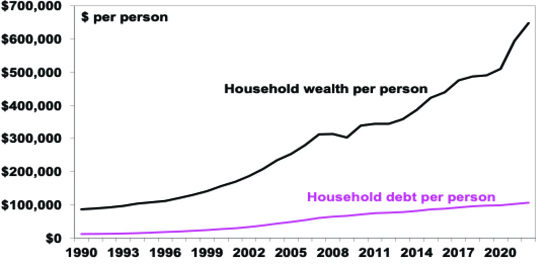
Source: ABS, RBA, AMP
As a result, Australians’ household balance sheets, as measured by net wealth (assets less debt), are healthy. Net wealth relative to income has surged over the last 30 years and is high relative to comparable countries.
Aust household balance sheet in reasonable shape
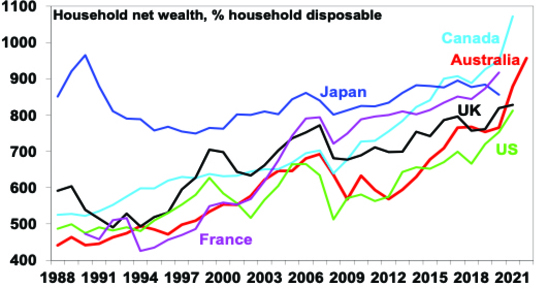
Source: OECD, ABS, RBA, AMP
-
Fourthly, Australians are not having big problems servicing their loans with low non-performing loans. This may reflect record low mortgage rates until recently.
Household interest payments relative to disposable income
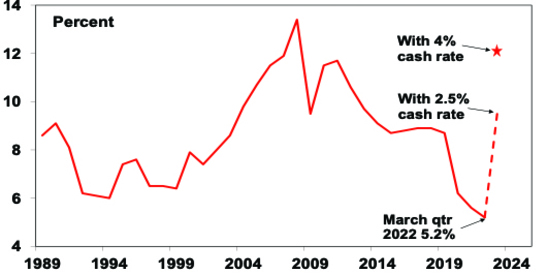
Source: RBA, AMP
-
Fifthly, the dollar value of debt is concentrated in higher income households who have a higher capacity to service it, particularly in relation to investment property loans.
-
Finally, lending standards did not deteriorate to the same degree in Australia as they did in the US prior to the GFC and were tightened from mid last decade with banks having to assess each new borrower’s ability to pay mortgage rates 2.5 percentage points above the borrowing rate up to October last year and 3 percentage points above since then.
But high debt has likely still increased the vulnerability of the household sector
While this analysis indicates that the rise in household debt in Australia is not as bad as it appears, its rise still leaves many households more vulnerable to rising interest rates (& higher unemployment) than in the past. After all, “it’s not what you own that might send you bust but what you owe.”
-
While the rise in wealth is good news it does not mean that there is no reason for concern. Debt has to be serviced out of income as opposed to out of wealth (as a colleague pointed out it’s not possible for a homeowner to sell off a bedroom to make higher interest payments). What’s more the surge in wealth, particularly for dwellings, flowed partly from low interest rates and is now coming under pressure as rates rise. We expect home prices to fall 10-15% which risks driving negative equity for recent low deposit home buyers.
-
The rise in debt means that moves in interest rates are now nearly three times as potent compared to 30 years ago. Just a rise in the cash rate to 2.5% will see a near doubling in debt interest payments as a share of household income (see last chart) and take them to where they were in 2013 (after which economic growth was relatively sluggish in Australia). A rise in the cash rate to around 4% (which is the money market’s expectation for next year) will push interest payments from around 5.2% of income to around 12%.
-
Coming at a time of falling real incomes due to cost-of-living pressures this implies a significant hit to household spending power.
-
While many households have built up cash buffers and are ahead on their mortgage payments and the household saving rate remains high, RBA analysis also indicates there is a significant group who would see a sharp rise in their mortgage payments if mortgage rates rose by 2% and most economists and the market expect more than this.
-
This group is likely to include those who bought into the property market more recently who have had less time to get ahead on their mortgages. While the dollar value of debt is concentrated amongst higher income households, its high amongst 30-40 year olds – ie, recent buyers with young families – and it’s this group who are most likely to be the marginal consumers who will likely have to cut their spending in response to rising interest rates and costs.
-
Rising unemployment should the economy fall into recession would add to debt servicing problems.
-
Poor consumer confidence and accelerating home price declines in Sydney and Melbourne (and other cities seeing a rapid slowing) far earlier in this rate hiking cycle than normal warn of the household sector’s increased vulnerability.
Concluding comment
This all sounds rather gloomy. The key though is that the RBA only needs to raise interest rates far enough to cool demand to take pressure off inflation and keep inflation expectations down. While the household sector in aggregate is stronger than a focus on household debt alone would suggest, the rise in household debt has made monetary policy more potent than it was in the past which in turn will limit how much the RBA will need to raise interest rates by. While the RBA is hiking more aggressively now to reinforce its commitment to the 2-3% inflation target, the greater sensitivity of the household sector to rising interest rates is likely to become evident fairly quickly which will mean the RBA won’t have to raise interest rates as far as the 4% or so cash rate that the money market is assuming. We continue to see the cash rate topping out at around 2.5% in the first half next year.
Source: AMP Capital June 2022
Important note: While every care has been taken in the preparation of this document, AMP Capital Investors Limited (ABN 59 001 777 591, AFSL 232497) and AMP Capital Funds Management Limited (ABN 15 159 557 721, AFSL 426455) make no representations or warranties as to the accuracy or completeness of any statement in it including, without limitation, any forecasts. Past performance is not a reliable indicator of future performance. This document has been prepared for the purpose of providing general information, without taking account of any particular investor’s objectives, financial situation or needs. An investor should, before making any investment decisions, consider the appropriateness of the information in this document, and seek professional advice, having regard to the investor’s objectives, financial situation and needs. This document is solely for the use of the party to whom it is provided.
The plunge in shares & flow on to super
Dr Shane Oliver – Head of Investment Strategy and Chief Economist, AMP Capital
IntroductionUsually share markets are relatively calm and so don’t generate a lot of attention. But periodically they tumble and generate headlines like “billions wiped off share market” & “biggest share plunge since…” Sometimes it
Read More– key things for investors to keep in mind during times of market turmoil
Dr Shane Oliver – Head of Investment Strategy and Chief Economist, AMP Capital
Introduction
Usually share markets are relatively calm and so don’t generate a lot of attention. But periodically they tumble and generate headlines like “billions wiped off share market” & “biggest share plunge since…” Sometimes it ends quickly and the market heads back up again and is forgotten about. But once every so often share markets keep falling for a while. Sometimes the falls are foreseeable (usually after a run of strong gains), but rarely are they forecastable (which requires a call as to timing and magnitude)…despite many claiming otherwise. In my career, I have seen many periodic share market tumbles.

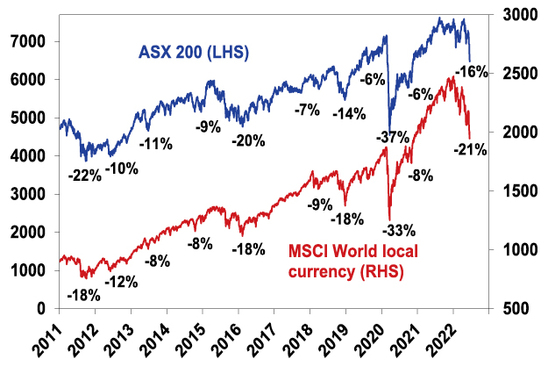
And so it is again – with share markets starting the year on a sour note and despite a few bounces along the way having several legs down with another sharp fall over the last two weeks. From their all-time highs to their lows in the past week US shares have now fallen 24%, global shares have fallen 21% and Australian shares have fallen 16%. Always the drivers are slightly different. But as Mark Twain is said to have said “history doesn’t repeat but it rhymes”, and so it is with share market falls. This means that from the point of basic investment principles, it’s hard to say anything new. Which is why this note may sound familiar with “key things for investors to keep in mind”, but at times like this they are worth reiterating.
What’s driving the plunge in share markets
The key drivers of the fall in shares remain:
-
Shares had very strong gains from their March 2020 lows and speculative froth had become evident in tech stocks, meme stocks and crypto, and this left them vulnerable.
-
High and still rising inflation flowing from pandemic distortions made worse by the war in Ukraine and Chinese lockdowns. US inflation rose further in May to 8.6%, its over 8% in Europe and looks to be on its way to 7% or so in Australia (not helped by our own electricity crisis & floods).
-
The ongoing upside surprises on inflation have seen central banks become more aggressively focussed on pulling it back down and so stepping up the pace of rate hikes with: the US hiking by 0.75% last week; Canada, NZ & the UK all continuing to raise interest rates; the ECB moving towards rate hikes from July; and the RBA hiking rates by 0.5%.
-
The increasing aggressiveness of central banks in the face of higher inflation is in turn raising the risk of triggering a recession, which could depress company profits.
-
Rising bond yields in response to rising inflation and central bank tightening is adding to the pressure on share markets by making them look relatively less attractive which is driving lower price to earnings multiples.
-
The ongoing war in Ukraine along with tensions with China are adding to the risks.
-
As always, the most speculative “assets” are getting hit the hardest including the pandemic winners of tech stocks (with Nasdaq having fallen 34%) and crypto currencies (with Bitcoin down 70% from its high last year). Crypto currencies surged with semi religious fervour around the claimed marvels of blockchain, decentralised finance, NFTs, freedom from government, an inflation hedge, etc, only to become a speculative bandwagon fuelled by easy money and low interest rates. Trying to disentangle its true fundamental value from the speculative mania became next to impossible. And now the easy money and low rates are reversing, pulling the rug out from under the mania and driving mishaps along the way (eg, Terra, Celsius Network and Babel Finance). Fortunately, the exposure of major banks and mainstream investors to crypto is still relatively low so this is unlikely to be another GFC moment.
Reflecting the sharp falls in share markets and in fixed interest investments (which suffer a capital loss as bond yields rise) balanced growth superannuation funds are down by 5% or so for this financial year to date and are on track for their first financial year loss since 2019-20 (due to the pandemic) & their worst financial year loss since the GFC. See the next chart.
Balanced/growth superannuation fund returns
Source: Morningstar, AMP
Key things for investors to bear in mind
Sharp market falls are stressful for investors as no one likes to see their investments (including their super) fall in value. But there are some key things investors should keep in mind:
First, while they unfold differently, periodic share market corrections and occasional bear markets (which are usually defined as falls greater than 20%) are a normal part of investing in shares. For example, the last decade regularly saw major pullbacks. See the next chart.
Share market pullbacks are normal
Source: Bloomberg, AMP
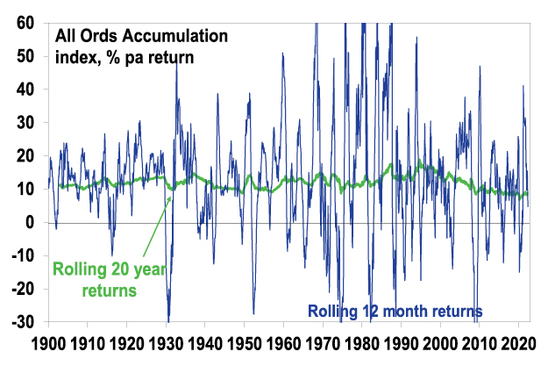
And, as can be seen in the next chart rolling 12 month returns from shares have regularly gone through negative periods.
Australian share returns over over rolling 12 mth & 20 yr periods
Source: ASX, Bloomberg, AMP
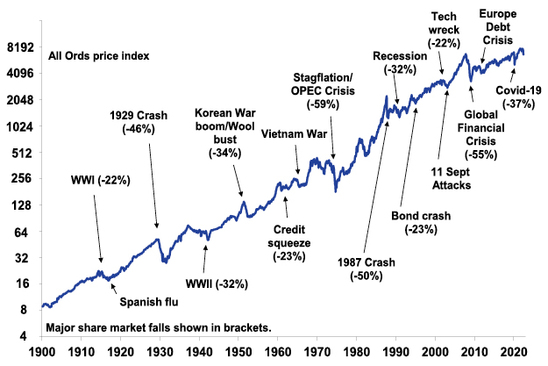
But while the falls can be painful, they are healthy as they help limit excessive risk taking. Related to this, shares climb a wall of worry over many years with numerous events dragging them down periodically (next chart), but with the long-term trend ultimately up & providing higher returns than other more stable assets. As can be seen in the previous chart, the rolling 20-year return from Australian shares has been relatively stable and solid. Which is why super funds have a relatively high exposure to shares along with other growth assets. Bouts of volatility are the price we pay for the higher longer-term returns from shares. As can be seen in the first chart in this note while this financial year has been rough for super funds longer term returns have been solid & so recent weakness has to be seen in perspective.
Australian shares have climbed a wall of worry
Source: ASX, AMP
Second, historically, the main driver of whether we see a correction (a fall of say 5% to 15%) or even a mild bear market (with say a 20% or so decline that turns around relatively quickly like we saw in 2015-2016 in Australia – which may be called a “gummy bear market”) as opposed to a major (“grizzly”) bear market (like that seen in the mid-1970s or the global financial crisis when shares fell by around 55%) is whether we see a recession or not – notably in the US, as the US share market tends to lead most major global markets. We remain of the view that a global recession can be avoided – if inflation starts to slow later this year or early next (as supply improves) taking pressure off central banks and in Australia as growth initially cools faster than expected (as the plunge in consumer confidence suggest that it will) putting a cap on how much the RBA needs to hike interest rates allowing it to avoid triggering a recession. But with inflation still surprising on the upside and central banks hiking rates aggressively the risks have increased to the point that its now a very close call. Either way it’s still too early to say that shares have bottomed.
Of course, short-term forecasting is fraught with difficulty and should not be the basis for a long-term investment strategy, so it’s better to stick to long term investment principles.
Third, selling shares or switching to a more conservative superannuation investment strategy whenever shares fall sharply just turns a paper loss into a real loss with no hope of recovering. Even if you get out and miss a further fall, the risk is that you won’t feel confident to get back in until long after the market has fully recovered. The best way to guard against deciding to sell on the basis of emotion after falls in markets is to adopt a well thought out, long-term strategy and stick to it.
Fourth, when shares fall, they’re cheaper and offer higher long-term return prospects. So, the key is to look for opportunities’ pullbacks provide. It’s impossible to time the bottom but one way to do it is to “average in” over time. Fortunately, the Australian superannuation system does just that by regularly putting money into shares for workers (via their super) effectively taking advantage of the fact they are cheaper.
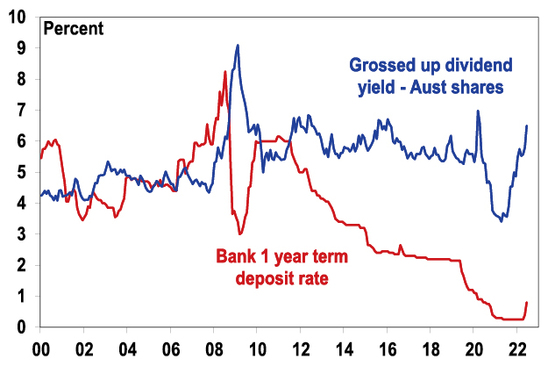
Fifth, while share prices have fallen dividends have not and so the dividend yield has increased. Australian shares are offering a very attractive dividend yield compared to bank deposits despite rising deposit rates. Companies don’t like to cut their dividends, so the income flow you are receiving from a well-diversified portfolio of shares is likely to remain attractive.
Aust shares still offer an attractive yield versus bank deposits
Source: RBA, Bloomberg, AMP
Sixth, shares and other related assets often bottom at the point of maximum bearishness, ie, just when you and everyone else feel most negative towards them. So, the trick is to buck the crowd. “Be fearful when others are greedy. Be greedy when others are fearful,” as Warren Buffett has said.
Finally, turn down the noise. At times of uncertainty like now, the flow of negative news reaches fever pitch. Talk of billions wiped off share markets and of “crashes” help sell copy and generate clicks. But less newsy are the billions that market rebounds and the rising long-term trend in share prices add to the share market. Moreover, they provide no perspective and only add to the sense of panic. All of this makes it harder to stick to an appropriate long-term strategy – which is particularly important when it comes to super as it has to be seen as a long term investment, except for many of those near to retirement. So best to turn down the noise and watch the new Elvis biopic!
Source: AMP Capital June 2022
Important note: While every care has been taken in the preparation of this document, AMP Capital Investors Limited (ABN 59 001 777 591, AFSL 232497) and AMP Capital Funds Management Limited (ABN 15 159 557 721, AFSL 426455) make no representations or warranties as to the accuracy or completeness of any statement in it including, without limitation, any forecasts. Past performance is not a reliable indicator of future performance. This document has been prepared for the purpose of providing general information, without taking account of any particular investor’s objectives, financial situation or needs. An investor should, before making any investment decisions, consider the appropriateness of the information in this document, and seek professional advice, having regard to the investor’s objectives, financial situation and needs. This document is solely for the use of the party to whom it is provided.
The RBA hikes rates again with more to go
Dr Shane Oliver – Head of Investment Strategy and Chief Economist, AMP Capital
Key pointsThe RBA has hiked the cash rate again – by 0.5% taking it to 0.85% and continues to signal more rate hikes ahead.
We expect the cash rate to rise to 1.5-2% by year-end and to peak
Read More– but falling confidence and home prices will limit RBA tightening
Dr Shane Oliver – Head of Investment Strategy and Chief Economist, AMP Capital
Key points
-
The RBA has hiked the cash rate again – by 0.5% taking it to 0.85% and continues to signal more rate hikes ahead.
-
We expect the cash rate to rise to 1.5-2% by year-end and to peak at 2-2.5% by mid next year.
-
Greater sensitivity to higher interest rates will cap how much the RBA ultimately needs to hike by well below market expectations for a cash rate of 4% or more.
-
Falling home prices and very weak consumer confidence indicate RBA monetary tightening is already getting traction earlier than in past rate hiking cycles.

Introduction
The RBA has increased its official cash rate by another 0.5% taking it to 0.85% for the second rate hike in this cycle. This was above market expectations. Our expectation was for a 0.4% hike with the risk that it would be 0.5%.
In justifying the move the RBA noted that: the economy is resilient; the labour market is strong with the unemployment rate falling to just 3.9%; the Bank’s business liaison continues to point to higher wages growth; and inflation is expected to increase even more than it expected a month ago with notably higher prices for electricity, gas and petrol.
The RBA’s move is consistent with the stepped up pace of tightening from central banks in New Zealand and Canada and likely soon in the US as they all try to get ahead of the surge in inflation and to contain inflation expectations. This and the low starting point explains why the 0.5% rate hike is the biggest in 22 years.
The RBA’s commentary remained hawkish reiterating that it will “do what is necessary” to return inflation to target and that this will likely require “further steps in the process of normalising monetary conditions” which in short means that more interest rate hikes are likely on the way.
Australian interest rates on the rise
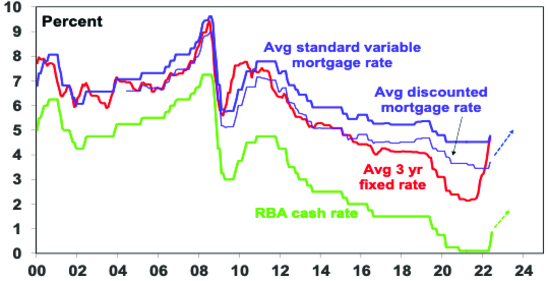
Source: RBA, Bloomberg, AMP
Banks are likely to pass the RBA’s rate hike on in full to their variable rate customers and deposit rates will rise further. Fixed mortgage rates have already moved up in line with rising bond yields in anticipation of higher cash rates – more than doubling from record lows around 2% early last year.
While the rate hike adds to the cost of living the RBA has little choice but to “normalise” interest rates
Supply constraints – reflecting the impact of the pandemic, the war in Ukraine and the floods – are the main factor behind the rise in inflation and RBA rate hikes won’t boost supply. But the RBA has little choice but to continue the process of tightening monetary policy.
-
First, strong Australian demand is also a factor with for example retail sales still running around 15% above their long-term trend. As is the very tight labour market.
Australian retail sales
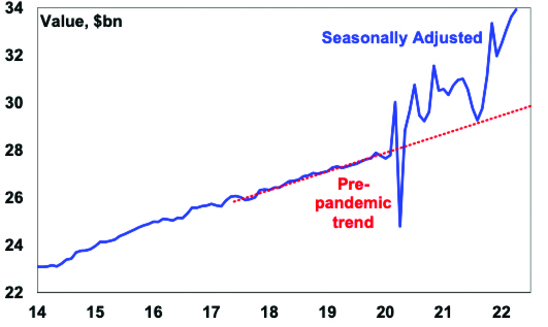
Source: ABS, AMP
-
Second, having a still near zero cash rate when unemployment is 3.85% and inflation is 5% and still rising makes no sense. So the RBA is right to be “normalising monetary conditions”.
-
Third, inflation pressures are still building with surging electricity and gas prices, petrol back above $2 a litre, rents starting to rise rapidly and supermarkets warning of more price rises and increasing wage demands. Its looking likely that inflation will now rise to 7% or so in the second half (compared to RBA expectations for a peak around 6%).
-
Fourth, the experience from the 1960s and 1970s tells us the longer high inflation persists the more inflation expectations will rise and get built into price and wage setting making it even harder to get inflation back down again without a recession. By raising rates the RBA is signalling its commitment to get inflation back down to the 2-3% target. Not doing so would call that commitment into question which would see inflation expectations rise.
-
Finally, the global backdrop now of bigger government, a long period of ultra-easy monetary policy and big budget deficits, the reversal in globalisation and the demographic decline in the proportion of workers relative to consumers, all point to a transition from the falling and low inflation world of the last 30-40 years to structurally higher inflation. This means that central banks like the RBA have to be more hawkish than has been the case for some time.
Money market expectations for a cash rate of 4% plus are too hawkish.
All of the above considerations point to more rate hikes ahead. But trying to get a handle on where they peak is always a bit of a guessing game. A build up in excess household saving of around $250bn through the pandemic – which is evident in a 25% rise in bank deposits since late 2019 and many households being well ahead on their mortgage payments – imparts a degree of resilience for households which some have argued means that the RBA may have to be a lot more aggressive taking the cash rate to 3.5% or more. This along with the hawkish nature of the RBA’s post meeting statement this month appears to underpin futures market expectations for the cash rate to rise above 3% by year end and then 4.5% by mid next year and to then stay above 4% for the subsequent two years.
However, its likely that the cash rate won’t have to go that high before the RBA achieves its aim of cooling demand enough to take pressure off inflation and keep inflation expectations down.
-
First, while the household debt situation is not as perilous as some would have it – with household wealth up more than household debt and many households well ahead on their payments – many will experience a significant amount of pain from higher rates. For example, RBA analysis indicates that about 25% of variable rate borrowers would see a 30% or more rise in mortgage payments from a 2% rise in rates. A new borrower in NSW where average new loans are around $800,000 would see monthly payments jump by more than $1000 if the cash rate rose to 2.5% compared to what they were paying back in March. This is a huge hit to the household budget.
-
Second, the RBA just wants to slow things down to take pressure off inflation and give time for supply to catch up. It does not want to crash the economy and is not on autopilot. So it will be watching indicators of spending and things like house prices very closely.
-
Third, it looks like the RBA is already getting traction. Consumer confidence has fallen sharply and is well below where it’s been at the start of past RBA rate hiking cycles. See the next chart.
Consumer confidence
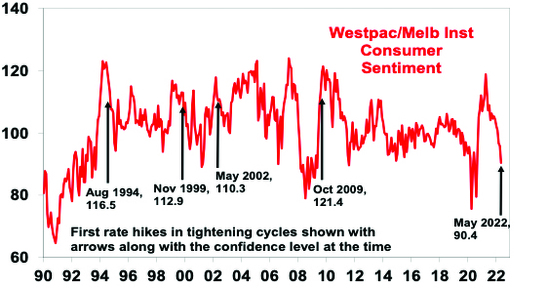
Source: Westpac/MI, AMP
National average home prices have already started to fall, whereas at the start of previous RBA rate hiking cycles they were rising solidly and did not start falling until sometime after the start of rate hikes. See the next chart
Capital city home prices
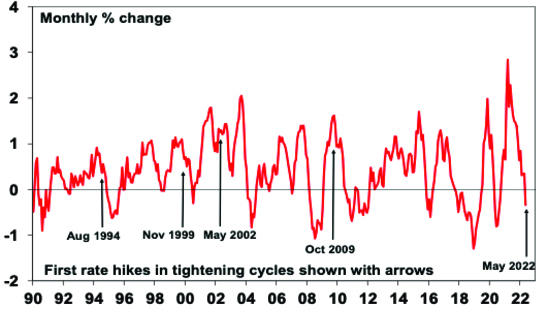
Source: Core Logic, AMP
The earlier than normal hit to confidence and home prices likely reflects a combination of things: a greater sensitivity to interest rate movements now reflecting higher levels of household debt (and high levels of debt required to get into the property market for new borrowers); the fact that the tightening cycle started before the rise in the cash rate this time around with the removal of the 0.1% bond yield target last year which helped drive a sharp rise in fixed mortgage rates and pulled the rug out from under the housing boom before the RBA started to move the cash rate; and cost of living pressures that have seen an unprecedented plunge in real wages and hence spending power in the context of the last 20 years.
Australian wages
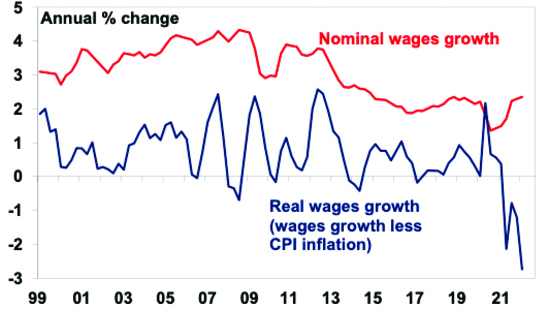
Source: ABS, AMP
But regardless of the precise drivers, the bottom line is that RBA monetary tightening appears to be getting traction earlier than would normally occur in an interest rate tightening cycle. While the RBA does not target house prices, falling home prices (where we expect a 10 to 15% top to bottom fall) will weigh on consumer spending (via negative wealth effects as we saw in 2017-18). All of which will start to take pressure off inflation and limit the amount by which the RBA ultimately will need to raise the cash rate by. So we expect that while the RBA will raise the cash rate to 1.5% to 2% by year end, the peak in the cash rate will come at around 2% to 2.5% by mid next year. This is well below money market expectations for a rise above 4%.
Given that the latest RBA hike was roughly in line with our expectations we have made no changes to our cash rate forecasts. We continue to see average home prices falling 10-15% over the next 18 months but this may now occur earlier and faster than previously expected.
Source: AMP Capital June 2022
Important note: While every care has been taken in the preparation of this document, AMP Capital Investors Limited (ABN 59 001 777 591, AFSL 232497) and AMP Capital Funds Management Limited (ABN 15 159 557 721, AFSL 426455) make no representations or warranties as to the accuracy or completeness of any statement in it including, without limitation, any forecasts. Past performance is not a reliable indicator of future performance. This document has been prepared for the purpose of providing general information, without taking account of any particular investor’s objectives, financial situation or needs. An investor should, before making any investment decisions, consider the appropriateness of the information in this document, and seek professional advice, having regard to the investor’s objectives, financial situation and needs. This document is solely for the use of the party to whom it is provided.

