

Olivers Insights
Review of 2022, outlook for 2023
Dr Shane Oliver – Head of Investment Strategy and Chief Economist, AMP Capital
2022 – from Covid to inflation & surging interest ratesThe good news is that 2022 finally saw the world shake off the grip of Coronavirus as it transitioned from a pandemic to endemic (albeit it’s still causing problems in China). However,
Read MoreExpect a rough ride, but better returns
Dr Shane Oliver – Head of Investment Strategy and Chief Economist, AMP Capital

2022 – from Covid to inflation & surging interest rates
The good news is that 2022 finally saw the world shake off the grip of Coronavirus as it transitioned from a pandemic to endemic (albeit it’s still causing problems in China). However, the past year turned out far more difficult for investors than might have been thought a year ago:
-
Inflation, which already rose in 2021 surged to levels not seen for decades, largely reflecting pandemic related distortions to supply and reopening & a stimulus driven surge in demand & floods in Australia.
-
Russia invaded Ukraine, leading to a surge in energy & food prices.
-
Central banks moved to aggressively withdraw monetary stimulus and raised interest rates at the fastest pace seen in decades to deal with inflation and rising inflation expectations.
-
Bond yields surged in response to the rise in inflation & interest rates.
-
Chinese growth fell sharply, reflecting its zero-Covid policy and a continuing property downturn despite policy stimulus.
-
Geopolitical tensions surged with war in Ukraine and worries about a Chinese invasion of Taiwan following President Xi Jinping’s power consolidation, although there were hopes of a thaw near year end.
-
As a result of all this, investors increasingly fretted about recession.
-
Tech stocks and crypto currencies, having been the biggest winners of the Covid lockdowns & easy money, were hit hard by reopening and monetary tightening, ultimately proving no hedge against inflation.
Growth was still ok – but a lot weaker than expected
Despite these problems, global GDP is still expected to have come in at around 3.2% which is weaker than the 5% or so growth expected a year ago and down from 6% in 2021, but still reasonable as reopening and stimulus helped. And in Australia, GDP is expected to have been around 3.5%, lower than expected a year ago and down from 4.8% in 2021, but still reasonable. The growth slowdown saw a slowdown in profits. But the main problem for investment markets was the rise in inflation, interest rates and bond yields.
Investment returns for major asset classes
|
Total return %, pre fees and tax |
2021 actual |
2022* actual |
2023 forecast |
|
Global shares (in Aust dollars) |
29.6 |
-7.4 |
4.0 |
|
Global shares (in local currency) |
24.3 |
-11.9 |
7.0 |
|
Asian shares (in local currency) |
-6.8 |
-18.0 |
10.0 |
|
Emerging mkt shares (local currency) |
-0.2 |
-13.8 |
10.0 |
|
Australian shares |
17.2 |
2.2 |
10.0 |
|
Global bonds (hedged into $A) |
-1.5 |
-11.1 |
3.0 |
|
Australian bonds |
-2.9 |
-7.8 |
4.0 |
|
Global real estate investment trusts |
30.9 |
-23.0 |
9.0 |
|
Aust real estate investment trusts |
26.1 |
-17.1 |
9.0 |
|
Unlisted non-res property, estimate |
12.3 |
11.5 |
4.0 |
|
Unlisted infrastructure, estimate |
12.0 |
10.0 |
5.0 |
|
Aust residential property, estimate |
23.0 |
-7.0 |
-7.0 |
|
Cash |
0.0 |
1.0 |
3.1 |
|
Avg balanced super fund, ex fees & tax |
14.3 |
-3.0 |
6.3 |
* Year to date to Nov. Source: Thomson Reuters, Morningstar, REIA, AMP
-
Global shares had a rough year with a plunge of 23% into October on inflation, interest rate and recession worries, before a rally cut losses.
-
Chinese shares led the weakness, not helped by its zero Covid policy, followed by Asian shares, given their exposure to China and cyclical sensitivity. US shares also underperformed reflecting its high-tech exposure & aggressive Fed tightening.
-
Australian shares outperformed, helped by strong commodity prices and a relatively less hawkish RBA.
-
Government bonds slumped as yields surged on high inflation & rate hikes. Australian bonds had their worst year since 1973 or the 1930s.
-
Real estate investment trusts fell with the surge in bond yields.
-
Unlisted property & infrastructure returns remained strong, being less sensitive to short-term share market and bond yield moves.
-
Home prices fell sharply reflecting poor affordability after a boom &, particularly, as mortgage rates rose, reducing home buyer capacity.
-
Cash and bank term deposit returns improved but were still low.
-
The $A fell with share markets on growth concerns and relatively aggressive Fed rate hikes into October, before a partial recovery.
-
Balanced super funds had negative returns reflecting poor share and bond returns. This followed very strong returns in 2021.
2023 – lower inflation and lower growth
First the bad news: inflation is still way too high at around 7 to 11% in many advanced countries; tight labour markets risk wage-price spirals; central banks are still warning of more rate hikes; the risk of recession is high with inverted yield curves and weak confidence largely in response to rate hikes; the US has returned to divided Government with the risk of debt ceiling and funding standoffs; war continues in Ukraine; and tensions remain with China and Iran. Even Covid continues to disrupt – but mainly in China as cases surge as it reopens. These all suggest another volatile year and possibly continuation of the bear market in global shares.
Global Composite PMI vs World GDP
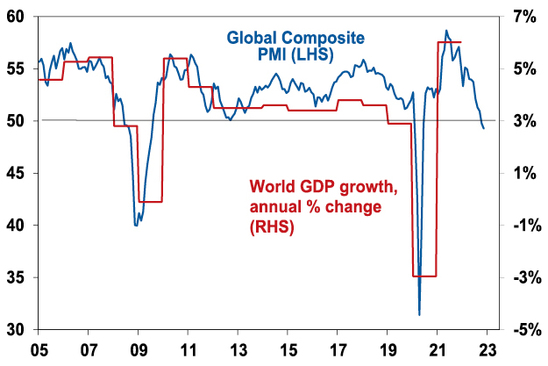
PMIs are surveys of business confidence and conditions. Source: Bloomberg, IMF, AMP
However, there is reason for optimism. First, inflationary pressures may have peaked and are slowing rapidly (as reflected in our Pipeline Inflation Indicator): supply chain pressures have eased; demand is cooling; and labour markets are showing signs of topping out. In fact, it may only require a slight pull back in demand (to push capacity utilisation back down to normal & unemployment above the NAIRU – or non-accelerating inflation rate of unemployment, with the return of immigration helping in Australia) to further depress inflationary pressure significantly. This suggests inflation could fall faster than central banks expect in 2023.
AMP Pipeline Inflation Indicator
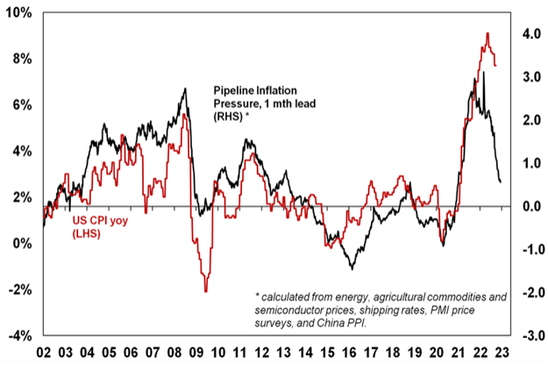
Note that this is more a guide to direction than level. Source: Bloomberg, AMP
Second, central banks are likely nearing the peak in rates. The Fed is already moving to slow hikes, but conditions are likely to be soft enough to allow it to pause from around March ahead of rate cuts later in 2023. Sure, its signalling more but just as its signals were too dovish a year ago its signals now are likely too hawkish! In Australia, we see the RBA as being at or close to the top (3.1% is our base case for the peak with 3.35% our risk case) as by February/March conditions are likely to be weak enough to allow a pause, ahead of rate cuts in late 2023/early 2024.
Third, it seems everyone is talking about recession for 2023, such that it’s a consensus call. The risk is very high (probably over 50% in the US and Europe) and this will likely keep markets volatile given the threat to earnings. But it may not turn out to be as bad as feared.
-
In the US it may just be a sharp slowdown or mild recession in 2023 – if the Fed starts to ease up on the brake soon and given the absence of other excesses that need to be unwound, eg, there has been no overinvestment in housing & capex and leverage is low.
-
Europe has moved away from Russian gas very quickly and providing its winter is mild, may continue to hold up better than feared.
-
Or lags in the way rate hikes impact may mean recession does not hit till 2024, meaning its too early for share markets to discount just yet.
-
After initial Covid related setbacks, Chinese growth is likely to rebound in 2023 as it reopens. Just like occurred in other countries upon reopening (recall Australia’s Omicron disruptions earlier in 2022) China is likely to see a surge in cases initially. But markets are likely to largely look through this to the reopening boost ahead which will provide an offset to slower growth in the US and Europe.
-
Australian growth is likely to slow but avoid recession, reflecting the less aggressive RBA, the pipeline of home building work yet to be completed and the strong business investment outlook.
Finally, geopolitics may not be so bad in 2023: there are no major elections in key countries in 2023; the war in Ukraine may not get any more threatening; and the Cold War with China may see a bit of a thaw.
Overall, global growth in 2023 is likely to be around 2.5%, well down from 6% in 2021, but not recession in aggregate. In Australia, growth is expected to slow to 1.5% in the year ahead. And inflation is likely to fall.
Implications for investors
Easing inflation pressures, central banks moving to get off the brakes, economic growth proving stronger than feared and improved valuations should make for better returns in 2023. But there are likely to be bumps on the way – particularly regarding recession risks – & this could involve a retest of 2022 lows or new lows in shares before the upswing resumes.
-
Global shares are expected to return around 7%. The post mid-term election year normally results in above average gains in US shares, but US shares are likely to remain a relative underperformer compared to non-US shares reflecting still higher price to earnings multiples (17.5 times forward earnings in the US versus 12 times forward earnings for non-US shares). The $US is also likely to weaken which should benefit emerging and Asian shares.
-
Australian shares are likely to outperform again, helped by stronger economic growth than in other developed countries and ultimately stronger growth in China supporting commodity prices and as investors continue to like the grossed-up dividend yield of around 5.5%. Expect the ASX 200 to end 2023 at around 7,600.
-
Bonds are likely to provide returns around running yield or a bit more, as inflation slows and central banks become less hawkish.
-
Unlisted commercial property and infrastructure are expected to see slower returns, reflecting the lagged impact of weaker share markets and higher bond yields (on valuations).
-
Australian home prices are likely to fall further as rate hikes continue to impact, resulting in a top to bottom fall of 15-20%, but with prices expected to bottom around the September quarter, ahead of gains late in the year as the RBA moves toward rate cuts.
-
Cash and bank deposits are expected to provide returns of around 3%, reflecting the back up in interest rates through 2022.
-
A rising trend in the $A is likely over the next 12 months, reflecting a downtrend in the now overvalued $US, the Fed moving to cut rates and solid commodity prices helped by stronger Chinese growth.
What to watch?
The main things to keep an eye on in 2023 are as follows:
-
Inflation – if it continues to rise, central banks will tighten more than we are allowing for risking deep recession.
-
US politics – the return to divided government, with GOP controlling the House, runs the high risk of a return to brinkmanship around the debt ceiling, causing volatility in markets as we saw in 2011 and 2013.
-
China issues – increased tensions around Taiwan are the main risk.
-
An escalation of the Ukraine conflict could adversely impact Europe.
-
Australian home prices – a sharper than expected fall as fixed rates reset and unemployment rises, could cause financial stability issues.
Source: AMP Capital December 2022
Important note: While every care has been taken in the preparation of this document, AMP Capital Investors Limited (ABN 59 001 777 591, AFSL 232497) and AMP Capital Funds Management Limited (ABN 15 159 557 721, AFSL 426455) make no representations or warranties as to the accuracy or completeness of any statement in it including, without limitation, any forecasts. Past performance is not a reliable indicator of future performance. This document has been prepared for the purpose of providing general information, without taking account of any particular investor’s objectives, financial situation or needs. An investor should, before making any investment decisions, consider the appropriateness of the information in this document, and seek professional advice, having regard to the investor’s objectives, financial situation and needs. This document is solely for the use of the party to whom it is provided.
The home price slump continued in November, with still more to go
Dr Shane Oliver – Head of Investment Strategy and Chief Economist, AMP Capital
The slump in home prices continuesAfter surging by 28.6% from their pandemic lows early this year to record highs on the back of record low interest rates, home prices are continuing to plunge on the back of the fastest surge in interest rates since the early 1990s.
Read MoreDr Shane Oliver – Head of Investment Strategy and Chief Economist, AMP Capital
The slump in home prices continues
After surging by 28.6% from their pandemic lows early this year to record highs on the back of record low interest rates, home prices are continuing to plunge on the back of the fastest surge in interest rates since the early 1990s. Australian capital city average dwelling prices fell another 1.1% in November according to CoreLogic, making it their seventh monthly decline in a row. Including regional dwellings, which fell another 0.9%, national dwelling prices fell 1%. Perth and Darwin remain relatively resilient as they are still getting over their post mining boom slumps. House prices are continuing to fall faster than unit prices, reflecting the much stronger boom in house prices and as unit prices are relatively supported by better affordability and tight rental markets.

Australian dwelling price growth, to November
|
|
Nov % chg |
Annual % chg |
% chg v high |
|
Sydney |
-1.3 |
-10.6 |
-11.4 |
|
Melbourne |
-0.8 |
-7.0 |
-7.1 |
|
Brisbane |
-2.0 |
3.3 |
-8.1 |
|
Adelaide |
-0.3 |
13.4 |
-0.9 |
|
Perth |
0.0 |
3.9 |
-0.7 |
|
Hobart |
-2.0 |
-4.1 |
-7.6 |
|
Darwin |
0.2 |
5.5 |
-0.7 |
|
Canberra |
-1.2 |
-1.3 |
-6.5 |
|
Capital city avg |
-1.1 |
-5.2 |
-7.5 |
|
Regional avg |
-0.9 |
3.3 |
-5.7 |
|
National avg |
-1.0 |
-3.2 |
-6.9 |
Source: CoreLogic, AMP
The key drivers of the downturn remain: poor affordability; rising mortgage rates; a rotation in spending from goods, including houses back to services; cost of living pressures, making it even harder to save for a deposit; and poor homebuyer confidence. Rising mortgage rates are the biggest driver of the slump as the surge in fixed mortgage rates, that started last year, and then variable rates has substantially reduced the amount new home buyers can borrow and hence pay for a home.
While the pace of monthly price declines has slowed in some cities, including the national average, this likely reflects the market getting used to the initial shock of rate hikes, bargain hunters taking advantage of lower prices and vendors holding off selling. Auction clearance rates also remain up from a low of around 50%, albeit in recent months they have stalled around 60% and volumes remain low.
But with the full impact of rate hikes yet to be felt, interest rates still rising and the economy set to weaken, the slowdown in price falls in some cities is unlikely to presage an imminent bottoming in home prices. Past periods of property price falls experienced a few gyrations in the pace of price declines before prices ultimately bottomed, eg in the 2017-19 down cycle. See the next chart.
Average capital city home prices
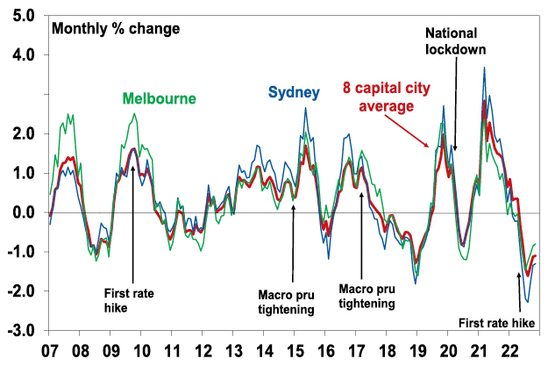
Source: CoreLogic, AMP
So far national average property prices are down 6.9% from their high and average capital city home prices are down 7.5% both over seven months. This is the fastest pace of decline on CoreLogic records going back to 1980. The rapidity of the decline likely reflects the de facto tightening that started with rising fixed mortgage rates a year ago, the speed of RBA cash rate hikes (the fastest since 1994) and heightened sensitivity to rising rates due to high debt levels, along with the extent of the prior boom.
Australian Capital City Home Price Downturns (peak in prices indexed to 100)
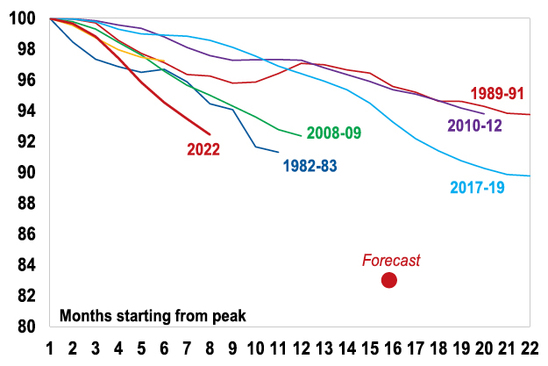
Source: CoreLogic, AMP
Of course, average home price levels have still only seen a flick off the top after a huge boom. See the next chart.
Australian property prices and interest rates
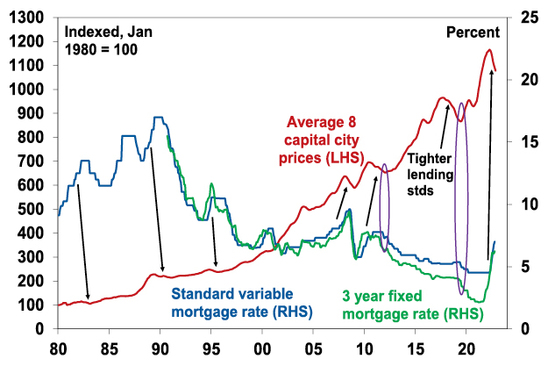
Source: CoreLogic, AMP
Outlook – we continue to expect average property prices to have a top to bottom fall of 15 to 20%
We expect average property prices to fall further into second half 2023 as rate hikes continue to flow through and economic conditions deteriorate:
-
the full impact of variable rate hikes has yet to be fully felt as it takes 2-3 months for RBA hikes to show up in actual mortgage payments;
-
we are expecting another 0.25% hike this month with the risk of another 0.25% in February and the money market is still expecting the cash rate to be raised to near 4% (from 2.85% currently);
-
two thirds of the 40% of households with a mortgage on fixed rates will see their mortgage rate reset from around 2% to around 5 or 6% by the end of next year. This is likely to result in a sharp rise in mortgage stress – this is the so called “fixed mortgage rate cliff”;
-
economic conditions are set to deteriorate next year as weaker global growth and rate hikes slow the economy & push up unemployment.
The combination will result in a further weakening in demand and a potential increase in supply as some financially stressed homeowners sell. In terms of the former, the next chart shows actual home prices compared to an estimate of what a buyer – with a 20% deposit, average full time earnings and mortgage payments assessed at 28% of their income – can afford to pay for a home. The shift in mortgage rates from 17% in 1989 to record lows in 2020 around 2-3% was the main enabler of the surge in home prices and price to income ratios. In other words, record low mortgage rates were reflected in record high home prices. While it can be seen from the chart that there are deviations and there are lots of other factors impacting home prices (supply, immigration, household size, taxation, help from “mum and dad”, home size and quality, and government incentives), over time home prices are tied to what people can afford to pay. But since April the amount an average new buyer can afford to pay has dropped by roughly 25% from around $600,000 to around $450,000. This demand side impact has been the key driver of home price falls so far, but suggests there is much more to go.
Australian Average Home Prices

Partly based on a Deutsche Bank analysis. Source: RBA, CoreLogic, AMP
Out of interest, while home prices have fallen 7% or so from their recent high, the time taken to save for a 20% deposit remains almost double what it was in the mid 1990s. The combination of the surge in interest rates and still sky high home prices relative to incomes, which necessitate very high debt levels, means affordability is almost as bad as its ever been.
Years it takes to save for a 20% deposit
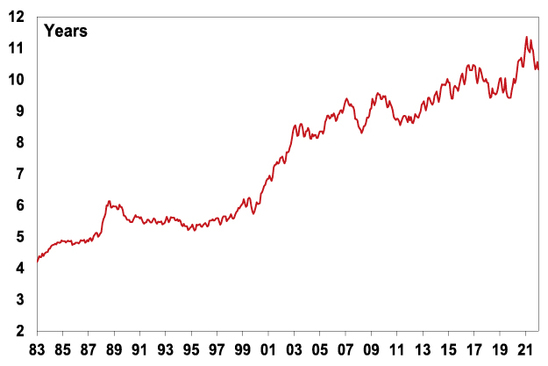
This assumes that the buyer saves 15% of their income each year. Source: RBA, CoreLogic, AMP
In terms of financial stress, with the 2.85% cash rate household interest payments as a share of income are already estimated to be at a near nine year high. Given record debt levels, further increases in mortgage rates will start to push total mortgage payments (principal and interest) to record highs relative to household income. This is likely to result in a sharp rise in mortgage stress – particularly as fixed rate loans reset next year.
Aust household interest relative to disposable income
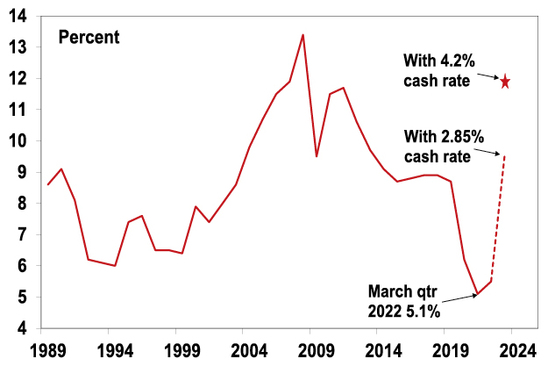
Source: ABS, RBA, AMP
As a result of these demand and supply side considerations flowing from higher interest rates, we continue to expect national home prices will have a top to bottom fall of 15 to 20% out to around September quarter next year, of which we are only about 40% of the way through.
The main risks on the downside are that the RBA raises the cash rate to around 4% (as the money market is assuming) and the economy enters recession. The RBA has already raised rates by more than the 2.5% interest rate serviceability buffer that applied up to October last year. In this scenario home prices could fall by around 30%.
On the upside several factors will help put a floor under prices and eventually drive a recovery. These include: government support programs (eg, home deposit schemes, “Help to Buy” schemes and NSW first home buyers swapping stamp duty for land tax); the tight rental market; & rapidly rising immigration. But for now, the property market will be dominated by higher rates. A pause in rate hikes on its own is unlikely to be enough to drive an upswing in prices as the capacity of buyers to pay will still be depressed. The last two major upswings in property prices that started in 2012 and 2019 required rate cuts before prices started to rise – see the purple ovals in the third chart in this note. Right now, we don’t anticipate rate cuts to start until late next year or early 2024.
Source: AMP Capital December 2022
Important note: While every care has been taken in the preparation of this document, AMP Capital Investors Limited (ABN 59 001 777 591, AFSL 232497) and AMP Capital Funds Management Limited (ABN 15 159 557 721, AFSL 426455) make no representations or warranties as to the accuracy or completeness of any statement in it including, without limitation, any forecasts. Past performance is not a reliable indicator of future performance. This document has been prepared for the purpose of providing general information, without taking account of any particular investor’s objectives, financial situation or needs. An investor should, before making any investment decisions, consider the appropriateness of the information in this document, and seek professional advice, having regard to the investor’s objectives, financial situation and needs. This document is solely for the use of the party to whom it is provided.
Five medium term inflation pressures & implications for investors
Dr Shane Oliver – Head of Investment Strategy and Chief Economist, AMP Capital
IntroductionIt’s often said you don’t realise how good something is until it’s gone. This may apply to the low inflation environment that prevailed up to the pandemic. Apart from a few nasty interruptions this saw a downtrend in interest rates, mostly low unemployment, and an upwards trend
Read MoreDr Shane Oliver – Head of Investment Strategy and Chief Economist, AMP Capital
Introduction
It’s often said you don’t realise how good something is until it’s gone. This may apply to the low inflation environment that prevailed up to the pandemic. Apart from a few nasty interruptions this saw a downtrend in interest rates, mostly low unemployment, and an upwards trend in asset values (albeit it wasn’t so good for housing affordability). The explosion in inflation over the last year and the associated surge in interest rates and slump in investment markets makes it all seem like a distant memory.
The good news is that, as we noted in our last note (here), there is reason to believe the short term surge in inflation may be peaking (led by the US) & this, along with various other factors, may result in a better cyclical outlook for shares over the next 12 months. The bad news, as we have noted in various reports (see, eg, here), is that we have likely seen the bottom in the long-term decline in inflation from the early 1980s and inflation is likely to be higher over the medium term than pre-pandemic. This note takes a look at the five key structural factors driving this. (Two of these are a subset of global trends covered by my colleague (see here).)

1. Bigger govt, less economic rationalist policies
The reaction to the inflationary malaise of the 1970s was the economic rationalist policies of Margaret Thatcher, Ronald Reagan and Bob Hawke and Paul Keating in Australia. These focussed on boosting the ability of the economy to supply goods and services by: limiting government involvement in the economy through policies such as deregulation and privatisation; policies to boost competition; measures to boost incentives by lowering tax rates; and labour market reform to make labour markets more flexible. This all helped lower inflation. Now as a result of the problems highlighted by the GFC, rising inequality, stagnant wages, aging populations, climate concerns and a collective memory loss regarding the lessons of the past there is a backlash against economic rationalist policies and more support for government intervention in the economy. It’s evident in Australia, for example, with the rising trend in government spending and revenue as a share of the economy, widespread pressure to raise taxes, together with measures to return to multi-industry bargaining within the labour market. The risk is that greater government involvement in the economy leads to lower productivity growth which will hamper the supply side of the economy and add to inflationary pressure.
Federal Government spending and revenue
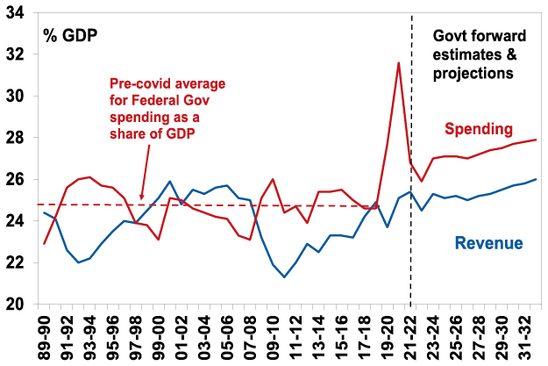
Source: Australian Treasury, AMP
2. The reversal of globalisation
The post-World War Two period saw a huge surge in global trade and financial links between countries as more countries entered the global trading system and trade barriers collapsed. This saw a huge rise in global trade as a share of global GDP since the end of WW2 and the General Agreement on Tariffs and Trade (GATT). This was given a boost from the 1990s with the integration of China and Eastern block countries into global trade along with the formation of the World Trade Organization. This saw production allocated globally according to comparative advantage and the development of highly integrated global supply chains. The cost reductions and competition helped reduce inflation.
Globalisation through time
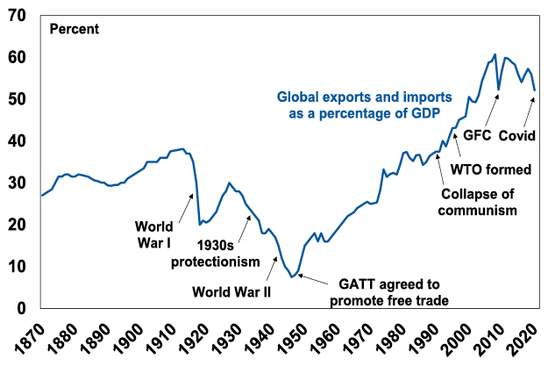
Source: World Bank, BCA, AMP
But the trend towards freer trade stalled in the 2000s, trade barriers are on the rise and trading blocks are being formed. The pandemic and rising geopolitical tensions are accelerating this reversal as countries seek to onshore production to reduce threats to supply chains spurred on by resurgent nationalist sentiment and a return to scepticism of free trade. The reversal of globalisation looks like it has a way to play out yet. Inevitably it will lead to higher costs and hence inflationary pressure.
3. Increasing defence spending
Over much of the last 60 years world military spending as a share of global GDP has been in decline. The most recent fall started in the 1980s and got a push along by the ending of the Cold War. This took pressure off metal prices (as military spending tends to be metal intensive) and it helped keep government spending down, which freed up resources for use by the private sector. Both of which were disinflationary.
World Military Expenditure (% of GDP)
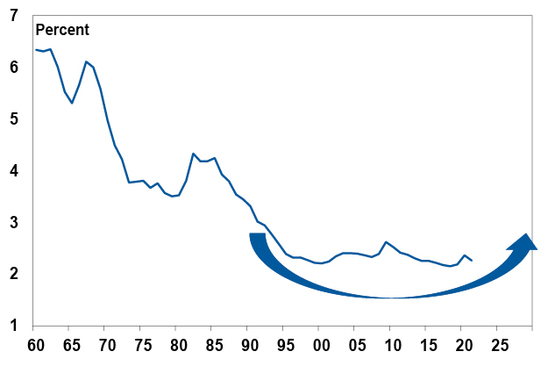
Source: World Bank, SIPRI, AMP
Now military spending is on the rise again, spurred on by the Russian invasion of Ukraine & China tensions. Even Germany & Japan are boosting military spending, as is Australia. This means more demand for metals and more government spending which will add to inflationary pressure.
4. Climate change and decarbonisation
Ultimately the shift to sustainable energy could result in lower costs as energy from sources like wind and solar is cheaper than energy from most fossil fuels & still getting cheaper as the technology evolves. But we are a long way from that yet and climate change and the transition to net zero will likely add to costs & inflation in multiple ways via: increased extreme weather damage resulting in higher and more variable food and road transport costs; associated rebuilding costs & higher insurance premiums; costs associated with mitigation; increased demand for metals as economies retool for sustainability (eg an electric car uses 6 times more copper than a petrol car); increased energy costs as we are not seeing the usual supply enhancing investment response in fossil fuels to higher energy prices; and increased pollution regulation will add to costs like the anti-pollution equipment of the 1970s added to inflation at the time.
5. Less workers, more consumers
Demographic trends are changing in a number of key ways. Global population growth is slowing, while in advanced countries and China the working age population is now in the process of peaking and starting to decline (see the top portion of the next chart). And, as is well known, populations are aging, resulting in a rise in the ratio of children and older people to working aged people, ie the dependency ratio is rising (bottom portion of the next chart). Thanks to its high immigration program Australia is in a somewhat better position (with a still rising workforce and slower rising dependency ratio). But globally, the upshot is less workers (supply) & more consumers (demand) which will likely add to inflationary pressures. Similarly, “adverse for inflation” demographic trends are flowing from the entry to the workforce of inexperienced millennials and Gen Z as highly experienced baby boomers retire (which is bad for productivity) and the pandemic refocussing workers on quality-of-life making them more demanding in terms of pay and/or retiring early.
Dependency Ratio & Working Age Population
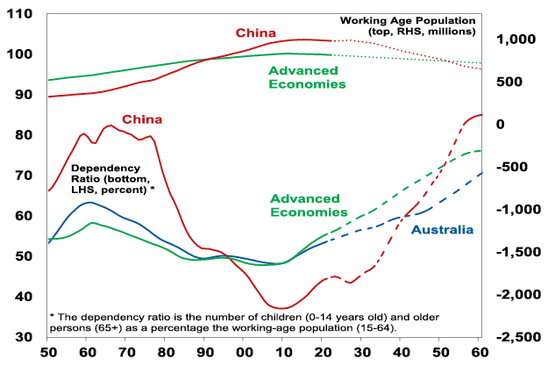
Source: UN, AMP
Implications for inflation
RBA Governor Lowe has referred to some of these structural forces as adding to inflation variability. But they are also likely to make economies more inflation prone as they imply more constrained supply & increased demand in some areas. For the technically minded this implies the supply curve shifting to the left and potentially being steeper and the demand curve (eg, for commodities) potentially shifting to the right. There is some offset with technological innovation still bearing down on prices, but the net effect will likely mean higher average inflation and possibly greater variability in it over time than pre-pandemic. The more inflation prone environment means central banks will have to work harder to keep inflation down around their 2-3% targets than pre-pandemic. Higher household debt levels in countries like Australia will aid in this as it makes monetary policy more potent than it was in the 1970s when household debt was low. It will probably still require higher & more variable interest rates than we saw pre-pandemic though.
Implications for investment returns
The collapse in inflation from the 1980s provided a tailwind for investment returns relative to what nominal growth and investment yields would normally indicate because it meant: lower interest rates; reduced economic volatility and uncertainty (and hence lower risk premiums); and a higher quality of company earnings. For growth assets it meant a valuation boost as shares traded on higher price to earnings multiples and real assets like property traded on lower income yields.
Higher inflation over the medium term than in the pre-pandemic period will remove this tailwind and threaten its reversal:
-
Higher interest rates will make cash and fixed interest relatively more attractive to investors.
-
Price to earnings ratios on shares will likely settle at lower levels and income yields on real assets at higher levels.
-
Higher mortgage rates will mean a lower capacity to borrow and hence pay for homes meaning more constrained home prices.
If inflation averages around central bank targets, which is our base case, returns will be constrained but still reasonable. If alternatively, inflation turns out much higher then returns risk being weak. Which makes it very important central banks are successful in keeping inflation down – it’s just that the structural backdrop means it will likely be harder going forward.
Source: AMP Capital November 2022
Important note: While every care has been taken in the preparation of this document, AMP Capital Investors Limited (ABN 59 001 777 591, AFSL 232497) and AMP Capital Funds Management Limited (ABN 15 159 557 721, AFSL 426455) make no representations or warranties as to the accuracy or completeness of any statement in it including, without limitation, any forecasts. Past performance is not a reliable indicator of future performance. This document has been prepared for the purpose of providing general information, without taking account of any particular investor’s objectives, financial situation or needs. An investor should, before making any investment decisions, consider the appropriateness of the information in this document, and seek professional advice, having regard to the investor’s objectives, financial situation and needs. This document is solely for the use of the party to whom it is provided.
Seven reasons why Australia should be able to avoid a recession
Dr Shane Oliver – Head of Investment Strategy and Chief Economist, AMP Capital
IntroductionEconomic and financial commentary has been particularly gloomy of late, with talk of a “dire”, “grim”, “bleak”, “perilous” and “confronting” outlook. The problems are well known: high inflation; particularly high and still rising energy prices; central banks aggressively raising interest rates; a high risk of recession globally;
Read MoreDr Shane Oliver – Head of Investment Strategy and Chief Economist, AMP Capital
Introduction
Economic and financial commentary has been particularly gloomy of late, with talk of a “dire”, “grim”, “bleak”, “perilous” and “confronting” outlook. The problems are well known: high inflation; particularly high and still rising energy prices; central banks aggressively raising interest rates; a high risk of recession globally; the war in Ukraine, along with other geopolitical risks; and the downturn in China. One could be forgiven for thinking that recession in Australia is inevitable in the next year.

Returning inflation to the 2-3% target is of utmost importance as the 1970s experience highlights that failure to do so will lead to even worse economic conditions and a continuing rough time in investment markets. And the surge in inflation is more than just supply constraints flowing from the pandemic, the war in Ukraine and floods, as demand is running well above supply in the Australian economy. This is evident in very high capacity utilisation rates and very low unemployment (see the next chart).
Australian spare capacity is low
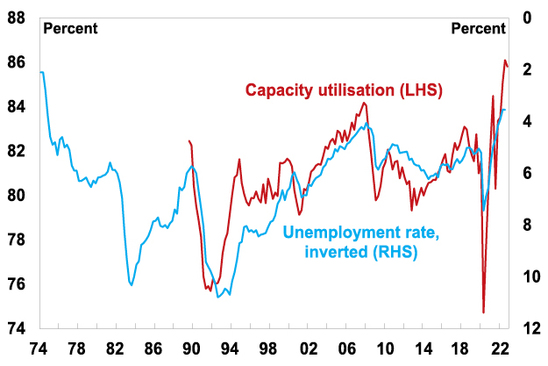
Source: ABS, NAB, AMP
For the labour market its also evident in a high ratio of job vacancies to unemployment. This has meant that the “jobs gap” in Australia (defined as labour demand (as measured by job vacancies plus employment) less labour supply (or the labour force) as a share of the labour force) which has closed to around zero for the first time in over 40 years (see the next two chart). The longer the very tight labour market remains, the greater the chance that wages growth will surge will in excess of the three point something that is consistent with inflation in the 2-3% target range.
Australian Jobs Gap*
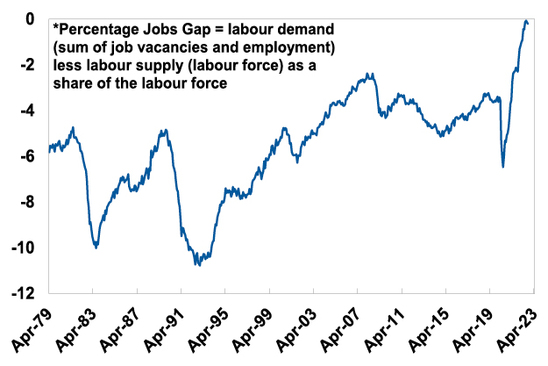
Source: ABS, AMP
To bring demand in the economy back into line with supply some economic slowdown is required to help get inflation back down. Hence the RBA has been raising interest rates.
With households most vulnerable to higher interest rates due to high levels of household debt and the double whammy from falling real wages, consumer spending is set to slow sharply. And RBA Governor Lowe has noted on several occasions that “we are travelling along a narrow path here” in terms of being able to return inflation to target and avoid a recession. However, it’s not inevitable that Australia will slide into recession. Assuming there is no further significant flare up in geopolitical problems (such as a war over Taiwan), this note looks at seven reasons why Australian should be able to avoid a recession.
#1 The business investment outlook is reasonably solid
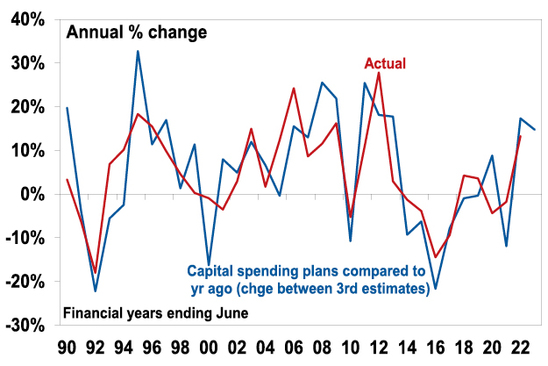
Business investment plans for the year ahead remain strong. The ABS capital spending intentions survey is up about 15% on a year ago. It’s likely this partly reflects the higher costs of investing, but it’s also consistent with high levels of capacity utilisation, reasonable business conditions and confidence, and some easing in supply chain pressures. Real business investment is expected to grow by around 5% over the year ahead.
Actual and expected capital expenditure
Source: ABS, AMP
#2 There is a large pipeline of home building work
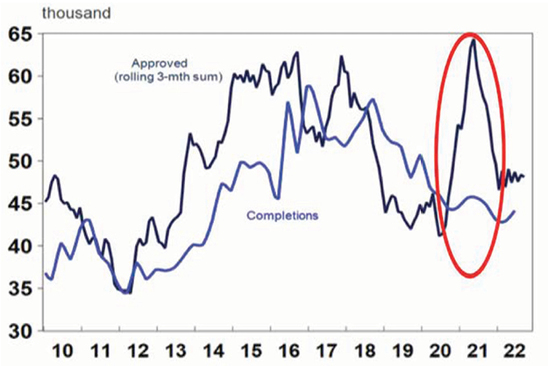
From their high last year, approvals to build new homes in Australia have fallen about 25% reflecting the end of the HomeBuilder grant and rising interest rates. While this points to a downturn in home building, its likely to be cushioned because there is a large pipeline of work yet to be completed with home completions yet to catch up to the surge in home building approvals through the pandemic (see red circled area in the next chart). This has been due to poor weather and shortages of labour and building materials. The large pipeline of work yet to be done will likely provide a floor for home building, preventing a plunge in dwelling investment that would normally flow from a 25% fall in approvals.
Residential approvals and completions
Source: Macrobond, AMP
#3 High energy prices are boosting national income
While the surge in energy prices is a huge hit to household budgets, its providing a big boost to national income via the earnings of energy companies. This is evident in strong trade surpluses and contributed to a $48bn improvement in the budget deficit last financial year and $42bn this financial year. This in turn is helping reduce the budget deficit and providing greater fiscal flexibility for the Australian Government.
#4 The $A will plunge if global recession leads to a sharp fall in commodity prices
So far this year the $A is down 11% against the $US but is unchanged on a trade weighted basis, ie against an average of currencies (as other currencies have fallen more against the $US than the $A has). But if global economic conditions collapse leading to a sharp fall in Australian commodity prices and hence our export earnings (which would push down inflation globally and in Australia) it’s likely that the $A will fall sharply. This in turn will help support the Australian economy by making our exports more competitive as it did in the Asian crisis, tech wreck and the GFC.
Alternatively, Chinese growth, after surprising on the downside this year could surprise on the upside next year. A key drag this year has been its zero Covid policy. But there are several signs that its heading towards an easing of it: with the People’s Daily running an article downplaying long Covid; a relaxation of PCR test requirements in some regions; Pfizer’s vaccine being made available to foreigners in China; and some regions building new makeshift hospitals. Its looking likely that the easing could come early next year. If so, this could result in a sharp rebound in Chinese growth as the stimulus measures of the last year would then be allowed to work. This in turn would boost global growth and benefit Australia.
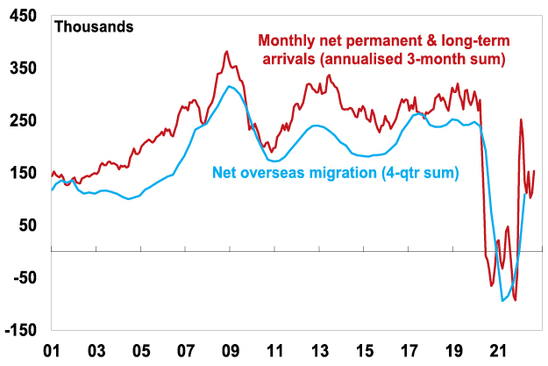
#5 Immigration is rebounding rapidly
A surge in new visas for arrivals as the backlog is worked through and in monthly data for net permanent and long-term arrivals point to a rebound in immigration levels. Consistent with this the Budget is projecting net immigration of 235,00 from this financial year consistent with pre-pandemic levels. This follows negative net immigration in 2020-21. The surge in immigration will help ease the labour shortage and tight jobs market evident in the first two charts in this note. Which in turn will help head off a surge in wages growth to levels well beyond those consistent with the inflation target.
Australian net immigration on the rise again
Source: ABS, AMP
#6 Inflation may be less of a problem in Australia
It’s all very well to say the economy is resilient, but that may just mean that the RBA will have to raise rates by more than otherwise to slow demand enough to get inflation down. In other words, the previous considerations are necessary to help avoid recession but are not sufficient. So this brings us to inflation and here there are reasons for optimism that the RBA won’t have to raise rates too much further (& not to the 4% plus that the money market is assuming but which would most likely tip us into recession):
-
First, Australian wages growth is far lower than in other countries.
-
Second, at least our energy prices have not been doubling or more, unlike in Europe.
-
Third, longer-term inflation expectations are still consistent with the inflation target which should make inflation a lot easier to bring under control than it was in the 1980s when high inflation was entrenched.
-
Fourth, while the Australian labour market is very tight, risking a wages blowout, this is in large part due to the absence of immigrants. Unlike in other countries labour force participation is above pre-pandemic levels and the return of immigrants will ease worker shortages.
-
Fifth, the simultaneous monetary tightening by central banks risks a sharp slowing in global growth and inflationary pressures that Australia will benefit from, reducing the amount the RBA will need to tighten by.
-
Finally, US upstream price pressure are slowing which should benefit Australia which is following US inflation with a six-month lag.
#7 The RBA has opted to move into the slow lane
Much will come down to how aggressive the RBA gets in raising rates. It has noted that it “will do what is necessary to” return inflation to target. But it’s also noted that its seeking to do this “while keeping the economy on an even keel.” After an initial run of rapid rate rises that returned the cash rate to more normal levels it has since slowed the pace down to better assess their lagged impact, allow for the global downturn, and hopefully strike “the right balance between doing too much and too little.” In motoring parlance “speeding kills” – the initial acceleration in rates was necessary to catch up to inflation but to continue at that pace would run the risk of a serious accident that tips us unnecessarily into recession.
Concluding comment
Some may wonder why I haven’t noted the strong jobs market as a reason why we should be able to avoid recession – the reason is because jobs are a lagging indicator. They were strong prior to the early 1990s recession too! Some may also argue that many households are protected by large mortgage and saving buffers – but many households aren’t, so I decided to not rely on that one too. But the key is that there are enough other reasons why, although economic growth is likely to slow sharply from 3% this year to around 1.5% next year, we should be able to avoid a recession.
Source: AMP Capital November 2022
Important note: While every care has been taken in the preparation of this document, AMP Capital Investors Limited (ABN 59 001 777 591, AFSL 232497) and AMP Capital Funds Management Limited (ABN 15 159 557 721, AFSL 426455) make no representations or warranties as to the accuracy or completeness of any statement in it including, without limitation, any forecasts. Past performance is not a reliable indicator of future performance. This document has been prepared for the purpose of providing general information, without taking account of any particular investor’s objectives, financial situation or needs. An investor should, before making any investment decisions, consider the appropriateness of the information in this document, and seek professional advice, having regard to the investor’s objectives, financial situation and needs. This document is solely for the use of the party to whom it is provided.
The October 2022-23 Australian Budget
Dr Shane Oliver – Head of Investment Strategy and Chief Economist, AMP CapitalDiana Mousina – Senior Economist, AMP Capital
IntroductionThe Government has implemented its election policies and expects lower budget deficits this year and next thanks to another revenue windfall and various savings. Future years show a significant
Read More– balancing a revenue windfall, election promises, structural spending demands & inflation pressures
Dr Shane Oliver – Head of Investment Strategy and Chief Economist, AMP Capital
Diana Mousina – Senior Economist, AMP Capital
Introduction
The Government has implemented its election policies and expects lower budget deficits this year and next thanks to another revenue windfall and various savings. Future years show a significant deterioration though as structural spending pressures, higher interest rates and lower productivity growth impact. As the Treasurer foreshadowed, this is largely a “bread and butter” budget though with significant reform left for next year’s budget.

Key budget measures
Key measures in the Budget mainly reflect election promises:
-
Increasing the childcare subsidy rate and expanding eligibility.
-
Extending paid parental leave to 6 months with widened eligibility.
-
More for Medicare, aged care, health, the NDIS and defence.
-
Cheaper PBS drugs by cutting the co-payment to $30 from $42.50.
-
Tax incentives for electric cars.
-
Reinvigorating workplace bargaining to lift wages in low-income jobs.
-
Increased spending on TAFE and more university places.
-
Increased infrastructure spending although this had already largely been budgeted with some funds “re-profiled”.
-
Increased aid for the Pacific and South-East Asian countries.
-
Various housing support measures – setting up a new Housing Accord to build 1 million new homes over 5 years, a Help to Buy equity scheme for 10,000 first home buyers, super concessions for downsizers over 55, the establishment of a National Housing Supply and Affordability Council, $350m in Federal Funding to help incentivise institutional (including super fund) investment in delivering an extra 10,000 affordable homes.
-
The start-up of various “off budget funds” – a $10bn fund to build 30,000 affordable homes, a $20bn fund to boost renewable electricity infrastructure and a $15bn National Reconstruction Fund.
Budget savings include the following:
-
A cut in public sector spending on consultants, travel & labour hire.
-
Cuts to regional infrastructure funds & community grants.
-
A crackdown on tax avoidance.
-
Increased tax on multinationals.
The Government has deferred any decision on the Stage 3 2024 tax cuts.
Economic assumptions
Since the March Budget there has been a significant deterioration in the outlook reflecting high price and cost pressures (not helped by the war in Ukraine and natural disasters), aggressive monetary tightening in response and falling real wages. As a result, the Government has revised up its inflation forecasts to allow for a slower decline through next year (although it still sees a peak this year at 7.75%), downgraded its GDP growth forecast for 2023-24 to just 1.5% mainly due to weaker consumer spending and revised up its unemployment forecast for mid 2024 to 4.5%. We are a bit more optimistic on the speed with which inflation will fall next year.
The Federal Government now sees net immigration rising to 235,000 this financial year and continuing at this trend, which is back to pre-pandemic levels. The Government pushed out its $US55/tonne iron ore price assumption to March quarter 2023. With iron ore now around $US95/tonne, it remains a source of revenue upside.
Economic assumptions
|
|
|
2021-22 |
2022-23 |
2023-24 |
2024-25 |
2025-26 |
|
Real GDP |
Govt |
3.9 |
3.25 |
1.5 |
2.25 |
2.5 |
|
% year |
AMP |
|
3.4 |
1.6 |
2.5 |
2.5 |
|
Inflation |
Govt |
6.1 |
5.75 |
3.5 |
2.5 |
2.5 |
|
% to June |
AMP |
|
5.6 |
2.8 |
2.7 |
2.5 |
|
Wages, |
Govt |
2.6 |
3.75 |
3.75 |
3.25 |
3.5 |
|
% to June |
AMP |
|
3.6 |
3.5 |
3.2 |
3.25 |
|
Unemp Rate |
Govt |
3.8 |
3.75 |
4.5 |
4.5 |
4.25 |
|
% June |
AMP |
|
4.0 |
4.2 |
4.2 |
4.25 |
Source: Australian Treasury, AMP
Budget deficit projections
The Government’s revised budget projections are shown in the next table. Despite increased spending, mostly associated with election promises, the deficit projections are lower for this year and next than in March. This is mostly due to another budget windfall from higher commodity prices, lower unemployment for now & higher inflation – which boosts revenue relative to spending (see the line called “parameter changes”). This was the main driver of the 2021-22 deficit coming in at $32bn rather than the $80bn back in March. It’s reduced the deficit by $42.2bn this year and $11.7bn next. Also helping are that any new spending measures are largely offset by budget savings such that “new stimulus” this year is just $1.1bn and next year there is no new stimulus. As a result, the expected deficit for this year has fallen to $36.9bn and for next year to $44bn (from $78bn and $56.5bn back in March). This lack of extra significant stimulus when inflation pressures are strongest is economically responsible.
However, from 2024-25 onwards the projections for the budget deficit have worsened relative to March reflecting a combination of an assumption that commodity prices revert to more “realistic” levels, a lower long run productivity growth assumption of 1.2%pa (down from 1.5%pa) which lowers growth in the tax base and greater allowance for structural spending pressures – on the NDIS, aged care, health, defence and interest costs, but mainly the NDIS.
Underlying cash budget balance projections
|
|
2021-22 |
2022-23 |
2023-24 |
2024-25 |
2025-26 |
|
Mar 21-22 Budget, $bn |
-79.8 |
-78.0 |
-56.5 |
-47.1 |
-43.1 |
|
Parameter chgs, $bn |
|
42.2 |
11.7 |
-2.2 |
0.8 |
|
New stimulus, $bn |
|
-1.1 |
0.7 |
-2.0 |
-7.4 |
|
Projected budget,$bn |
-32.0 |
-36.9 |
-44.0 |
-51.3 |
-49.6 |
|
% GDP |
-1.4 |
-1.5 |
-1.8 |
-2.0 |
-1.8 |
Source: Australian Treasury, AMP
As in the last few budgets, projections for spending as a share of GDP have shifted higher again & are now expected to average 27.1% of GDP over the next three years before rising to 28% of GDP by 2023-33, up from the pre-covid average of 24.8%. This reflects structural pressure from health, aged care, the NDIS, defence and interest costs. Revenue is still assumed to rise with a growing economy – even with the Stage 3 tax cuts – but is no longer assumed to be enough to close the gap with spending.
Federal Government spending and revenue
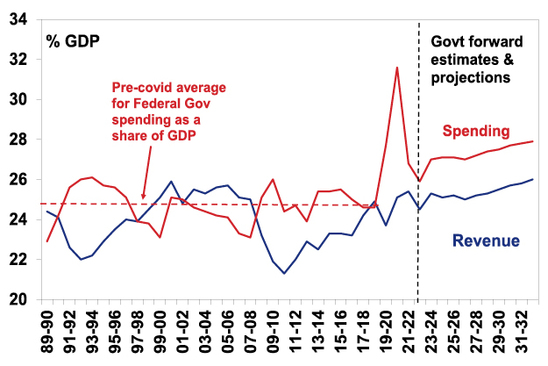
Source: Australian Treasury, AMP
So the budget deficit is now projected to be stuck at 2% into next decade.
Australian Federal budget deficit
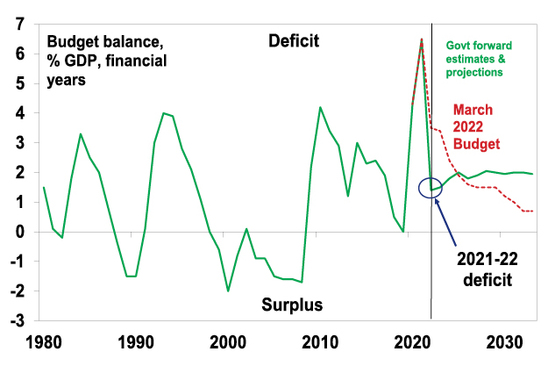
Source: Australian Treasury, AMP
Due to the lower budget deficit in the next two years and higher nominal GDP, gross public debt is now projected to be lower as a share of GDP than previously projected for the next four years. However, the $1trillion level is still expected to be reached next year. And the worse medium term deficit projections now see public debt looking worse into next decade.
Australian Federal gross debt
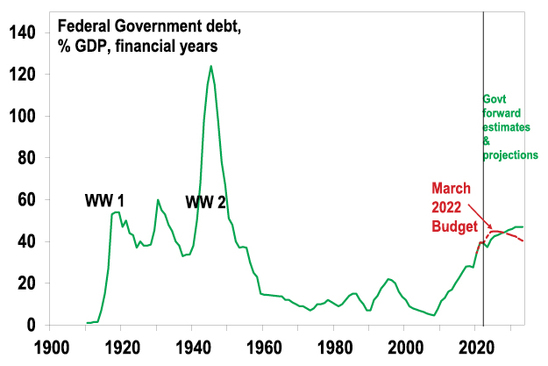
Source: RBA, Australian Treasury, AMP
Assessment
Winners include: parents; students; medicine users; patients; electric car buyers; NBN users; aged care residents; pensioners; new home buyers; skilled migrants; neighbouring countries; electric car buyers; and the environment. But unlike in the March Budget there are more losers this time including: multinationals; tax avoiders; foreign investors; Federal law breakers; and consultants, contractors & travel agents to the public sector.
The Budget has a bunch of things to commend it:
-
For this year and next it has largely saved the revenue windfall, resulting in a decline in the deficit to $36.9bn for this year and to $44bn next year (from the $78bn and $56.5bn expected in March). Because there is no significant new stimulus this year and next fiscal policy won’t add to inflation when it is highest and make the RBA’s job harder. As such there is no Trussonomics here!
-
Spending measures are aimed at boosting workforce participation (child care & parental leave) and productivity (infrastructure and skills measures) which may help boost the supply side of the economy.
-
There has been a realistic attempt to highlight the structural pressure on the budget, the economic assumptions look reasonable and public debt remains low compared to other comparable countries. This should see the Government retain its triple A credit rating.
- Commodity price assumptions remain well below current levels and so could be a source of downside surprise for the deficit.
-
The new Government is focussing more on boosting the supply of housing to help improve affordability, rather than just on demand which only makes the problem worse. The challenge is that much of the supply boost begin until from 2024 and in the meantime underlying demand for housing is already rising with immigration ramping up.
However, the Budget presents a significant long-term challenge with yet another ramp up in structural spending (reflecting increasing demands on the public sector) with a little in the way of major spending offsets and a continuing reliance on rising revenue to at least stop the situation worsening. As such it still leaves significant deficits in place for the next decade at least, leaves the budget vulnerable should anything come along to curtail the commodity boom and runs the risk that the ever expanding government share of GDP further slows productivity growth over the medium term. At some point tough decisions are required to cap spending growth or further raise tax revenue, hopefully in a way that does not crimp productivity growth. This remains an issue for the next budget.
Implications for the RBA
The good news is that the Budget, with its lower deficits this year and next, won’t add to inflationary pressure in the near term and so won’t add to RBA rate hikes. We expect another 0.25% rate hike next week and the cash rate to peak at 2.85% with a risk case of 3.1%.
Implications for Australian assets
Cash and term deposits – cash returns remain low but are improving thanks to RBA rate hikes.
Bonds – ongoing budget deficits add to upwards pressure on bond yields, but at least they have been lowered in the near term so there should be no new upwards pressure on bond yields from this source. Longer term the budget deficits present more of a challenge though.
Shares – the budget is positive for childcare and construction companies but beyond that there is not really a lot in it for the share market.
Property – the confirmation of more homebuyer schemes and more immigrants offset by long term housing supply measures are unlikely to alter the dominant negative impact of rising mortgage rates in driving a cyclical downturn in home prices.
The $A – the Budget is unlikely to change the direction for the $A.
Source: AMP Capital October 2022
Important note: While every care has been taken in the preparation of this document, AMP Capital Investors Limited (ABN 59 001 777 591, AFSL 232497) and AMP Capital Funds Management Limited (ABN 15 159 557 721, AFSL 426455) make no representations or warranties as to the accuracy or completeness of any statement in it including, without limitation, any forecasts. Past performance is not a reliable indicator of future performance. This document has been prepared for the purpose of providing general information, without taking account of any particular investor’s objectives, financial situation or needs. An investor should, before making any investment decisions, consider the appropriateness of the information in this document, and seek professional advice, having regard to the investor’s objectives, financial situation and needs. This document is solely for the use of the party to whom it is provided.
Seven things for investors to keep in mind in rough times like these
Dr Shane Oliver – Head of Investment Strategy and Chief Economist, AMP Capital
IntroductionSuccessful investing can be really hard in times like the present. Falls in share markets and other assets are stressful as no one likes to see their wealth decline and the natural inclination is to retreat to safety. From their highs last year or early this year
Read MoreDr Shane Oliver – Head of Investment Strategy and Chief Economist, AMP Capital

Introduction
Successful investing can be really hard in times like the present. Falls in share markets and other assets are stressful as no one likes to see their wealth decline and the natural inclination is to retreat to safety. From their highs last year or early this year to recent lows US and global shares have fallen about 25%. Australian shares have held up better, remaining up from their June low at which point they had had a fall of 16% from their high in August last year, but they remain vulnerable to the lead from global shares. While shares have managed to find technical support in recent days and could bounce further given high levels of negative sentiment, the near-term downside risks for shares remain high, reflecting the same array of macro risks that have been weighing on them all year, notably:
-
high inflation and ultra-hawkish global central banks;
- the $US trending up on safe haven demand and Fed rate hikes risking a financial accident – with mayhem in the UK adding to fears of crisis;
-
an escalation in the Ukraine war, along with other geopolitical risks;
-
high and still rising recession risks; and
-
downwards revisions to earnings ex
-
pectations flowing from all this.
We had a detailed look at the issues a few weeks ago along with signs of light at the end of the tunnel (see here), but I will be the first to admit my crystal ball gets even hazier at times like the present. As always, the turmoil in markets is being met with lots of prognostication. Some of which is enlightening but much is noise. But to borrow one of my favourite quotes that Mark Twain is said to have said “history doesn’t repeat but it rhymes”. While the weakness we are going through differs in detail from rough patches in the past, basic investment principles still apply. It’s hard to say anything new other than to reiterate them. So, apologies if you have seen “seven things for investors to keep in mind” from me before, but at times like this they are worth revisiting.
#1 Share market falls are normal – the key is to make the most of the power of compound interest
First, while they all have different triggers and unfold differently, periodic share market falls are healthy and normal. Sometimes they are just 5% to 20% corrections, but every so often they can be deep bear markets with falls up to around 50% as in the GFC. But while share market pullbacks can be painful, it’s the way the share market has always been, so they are nothing new. As can be seen in the next chart shares climb a wall of worry over many years but with numerous events dragging them down periodically, but with the long-term rising trend ultimately resuming.
Australian shares have climbed a wall of worry
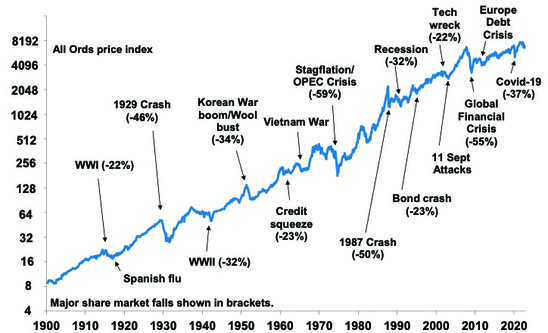
Source: ASX, AMP
Bouts of volatility are the price we pay for the higher longer-term returns from shares compared to other assets like cash and bonds. The next chart shows the value of $1 invested in various Australian assets in 1900 allowing for the reinvestment of dividends and interest along the way. That $1 would have grown to $243 if invested in cash, to $881 if invested in bonds and to $691,806 if invested in shares. While the average return since 1900 is only double that in shares relative to bonds, the huge difference between the two at the end owes to the impact of compounding returns on top of returns. So, if we want to grow our wealth we need an exposure to growth assets like shares to make the most of the power of compound interest, but with that comes rough patches every so often.
Shares versus bonds & cash over very long term – Australia
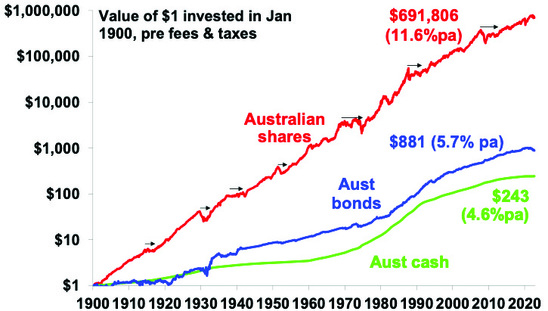
Data shown is prior to any fees and taxes. Source: Bloomberg, ASX, RBA, AMP
#2 The key is not to get thrown off by cycles – selling shares after a fall turns a paper loss into a real loss
When shares are falling sharply its naturally tempting to sell. At least it may then be easier to sleep at night. But selling shares or switching to a more conservative investment strategy whenever shares suffer a cyclical setback just turns a paper loss into a real loss with no hope of recovering.
#3 Timing is hard
Of course, you may be thinking “but I will reinvest once uncertainty is removed”. But the risk is you don’t feel confident to get back in until long after the market has fully recovered, which may be well above the level you sold out at. Trying to time the market is very difficult. A good way to demonstrate this is with a comparison of returns if an investor is fully invested in shares versus missing out on the best (or worst) days. The next chart shows that if you were fully invested in Australian shares from January 1995, you would have returned 9.2%pa (including dividends but not allowing for franking credits, tax and fees).
Missing the best days and the worst days
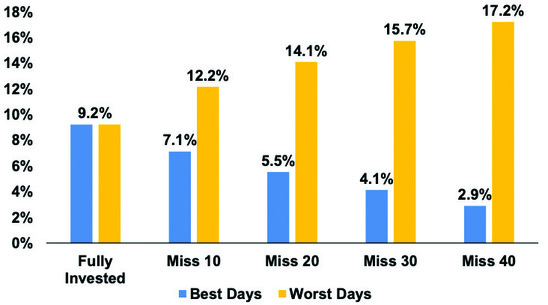
Source: Bloomberg, AMP
If by trying to time the market you avoided the 10 worst days (yellow bars), you would have boosted your return to 12.2% pa. If you avoided the 40 worst days, it would have been boosted to 17.2% pa. Fantastic! But this is very hard to do, and many investors only get out after the bad returns have occurred, just in time to miss some of the best days. For example, if by trying to time the market you miss the 10 best days (blue bars), the return falls to 7.1% pa. If you miss the 40 best days, it drops to just 2.9% pa. Hence the old cliché that “it’s time in that matters, not timing”.
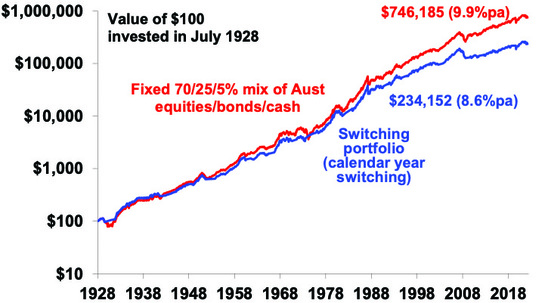
The following chart shows the difficulties of short-term timing in another way. It shows the cumulative return of two portfolios.
-
A fixed balanced mix of 70% Australian equities, 25% bonds, 5% cash;
-
A “switching portfolio” which starts off with the above but moves 100% into cash after any negative calendar year in the balanced portfolio and doesn’t move back until after the balanced portfolio has a calendar year of positive returns. We assumed a two-month lag.
Comparison of constant strategy versus switching to cash after bad times
Source: ASX, Bloomberg, AMP Capital
Over the long run the switching portfolio produces an average return of 8.6% pa versus 9.9%pa for the balanced mix. From a $100 investment in 1928 the switching portfolio would have grown to $234,152 by September but the constant mix would have increased to $746,185.
The best way to guard against selling on the basis of emotion after weakness is to adopt a well thought out, long-term strategy and stick to it.
#4 Share market pullbacks provide opportunities
When shares and all assets fall in price, they’re cheaper and offer higher long-term return prospects. As a result of the fall in share and bond prices (and the resultant decline in PEs and rise in dividends yields and bond yields) our estimated medium term return projections for a diversified growth mix of assets has improved from around 4.9%pa to around 6.7%pa. So, the key is to look for opportunities’ pullbacks provide. It’s impossible to time the bottom but one way to do it is to “average in” over time.
Projected medium term returns
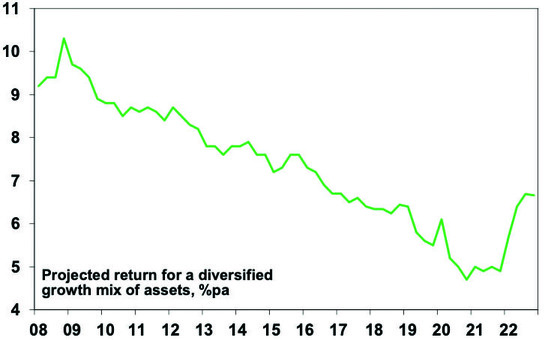
Source: AMP
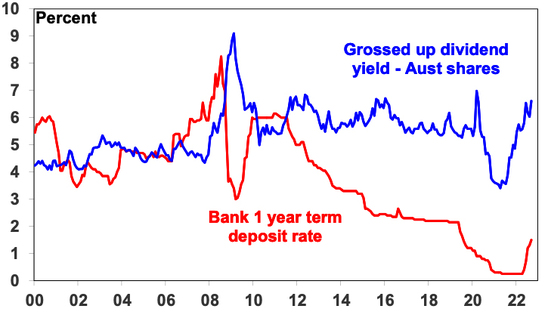
#5 Australian shares offer an attractive dividend yield
This is particularly so compared to bank deposits. Companies don’t like to cut their dividends, so the income flow you are receiving from a well-diversified portfolio of shares is likely to remain attractive, particularly against bank deposits even though deposit rates are slowing rising.
Aust shares still offer an attractive yield versus bank deposits
Source: RBA, Bloomberg, AMP
#6 Shares invariably bottom with maximum bearishness
Shares and other related assets often bottom at the point of maximum bearishness, ie, just when you and everyone else feel most negative towards them. This is when investors have lots of cash on the sidelines which provides fuel for an eventual rebound. This is the point of maximum opportunity. This is obvious in a way because shares could hardly bottom when everyone is already bullish because there would be no one to buy. The problem is that it’s hard for most people to commit to buying shares when there is so much gloom around. And, of course, investor sentiment could still get more negative in the short term before it bottoms.
#7 Turn down the noise
At times like this, negative news reaches fever pitch. Talk of billions wiped off share markets and warnings of disaster help sell copy and generate clicks & views. But we are rarely told of the billions that market rebounds and the rising long-term trend in share prices adds to the share market. Moreover, they provide no perspective and only add to the sense of panic. All of this makes it harder to stick to an appropriate long-term strategy let alone see the opportunities that are thrown up. So best to turn down the noise on all the negative news flow (and watch Elvis films).
Source: AMP Capital October 2022
Important note: While every care has been taken in the preparation of this document, AMP Capital Investors Limited (ABN 59 001 777 591, AFSL 232497) and AMP Capital Funds Management Limited (ABN 15 159 557 721, AFSL 426455) make no representations or warranties as to the accuracy or completeness of any statement in it including, without limitation, any forecasts. Past performance is not a reliable indicator of future performance. This document has been prepared for the purpose of providing general information, without taking account of any particular investor’s objectives, financial situation or needs. An investor should, before making any investment decisions, consider the appropriateness of the information in this document, and seek professional advice, having regard to the investor’s objectives, financial situation and needs. This document is solely for the use of the party to whom it is provided.

