Provision Newsletter
Commercial property returns under threat
Dr Shane Oliver – Head of Investment Strategy and Chief Economist, AMP Capital
IntroductionOver the last 10 and 20 years, returns from Australian unlisted commercial property have averaged 9% pa. This in part reflected the search for decent income bearing investments by investors in response to falling interest rates & bond yields that pushed up property values faster than justified by
Read MoreDr Shane Oliver – Head of Investment Strategy and Chief Economist, AMP Capital
Introduction
Over the last 10 and 20 years, returns from Australian unlisted commercial property have averaged 9% pa. This in part reflected the search for decent income bearing investments by investors in response to falling interest rates & bond yields that pushed up property values faster than justified by rents. However, it’s now vulnerable from the rise in bond yields over the last two years and reduced space demand flowing from “work from home” for office property and online retail for retail property.

Commercial property and the investment cycle
Just as shares lead in the investment cycle, unlisted assets like commercial property, being more connected to the real economy, tend to lag. The next chart is a stylised version of the investment cycle – the thick grey line is the economic cycle. (Note that residential property has become more interest sensitive and now tends to move ahead of commercial property.)
The investment cycle
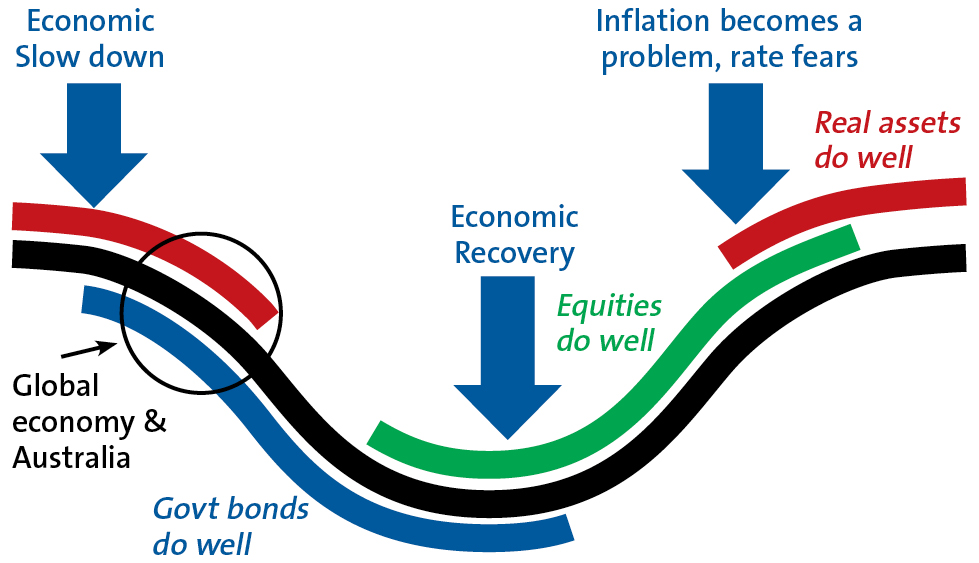
Source: AMP
Bonds do well in the economic downturn phase as interest rates fall and when inflation is still falling. Shares tend to lead the economic recovery as they respond first to easy money and as far-sighted investors sniff out recovery and continue doing well as profits rise before coming under pressure from eventual interest rate hikes & fears of a new downturn. Real assets tend to do relatively well later in the cycle as: it takes longer for easy money to flow into them; the valuation process results in a lag; & they tend to move more with current economic conditions which drives rents. This benefitted unlisted commercial property returns in 2021-22. However, the investment cycle is now turning against commercial property with interest rates up sharply and economic growth slowing. The slump last year and ongoing volatility in share markets has at least partly anticipated this with commercial property starting to follow with a lag.
A-REITs show the way… with a lot of noise!
This cyclical relationship can also be seen by comparing the returns from Australian Real Estate Investment Trusts (A-REITs) and directly held (ie, unlisted) non-residential property returns. The former are correlated with the share market. This makes them highly volatile but means they often provide a good lead for unlisted commercial property. Their weakness since January last year signals rougher times ahead for unlisted commercial property and returns have started to slow to reflect this.
Listed v unlisted property returns
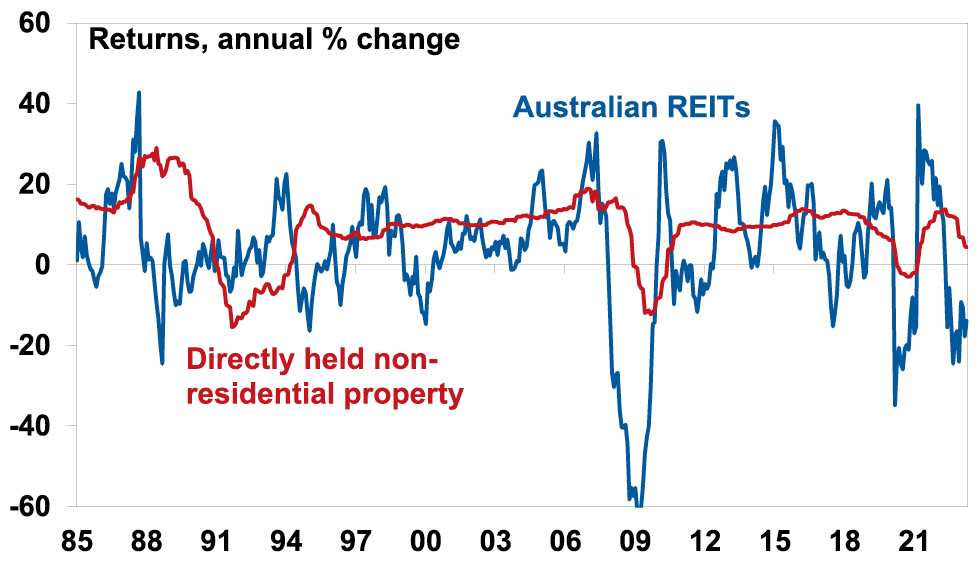
Source: Bloomberg, Mercer/IPD, AMP
The “search for yield”
Commercial property is arguably more vulnerable now because it benefitted from the decades long downtrend in interest rates and bond yields that may now have come to an end or be reversing. As interest rates and bond yields fell it drove a search by investors for decent income bearing investments – the “search for yield” – that pushed property values up faster than growth in rents and hence pushed property yields to record lows. The next chart shows yields for unlisted commercial property. With each 0.25% fall in property yields translating to a roughly 4% capital gain and with average commercial property yields having fallen from 7.3% to 4.89% between December 2009 to December 2019 this provided a huge boost to returns, averaging roughly 4.3% pa and pushing values nearly 50% higher over ten years. This is now starting to go in reverse.
Commercial property yields
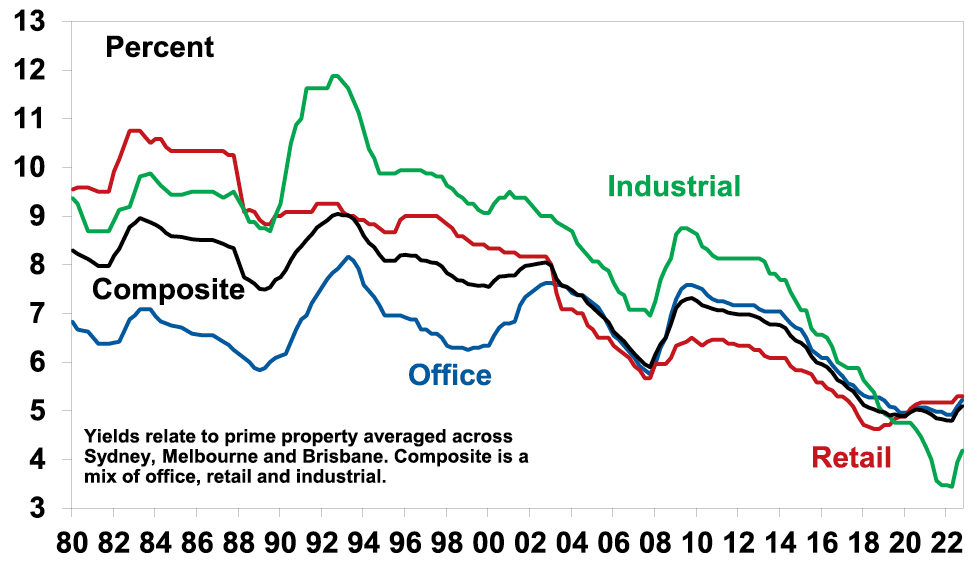
Source: JLL, AMP
Of course, while the decline in yields since the 1980s was big, unlisted non-residential property was not alone. In fact, while the grossed-up dividend yield from shares has been range bound over the last 40 years, yields on bonds, residential property and listed property have fallen more than unlisted commercial property yields. See the next chart. 10-year bond yields have fallen from well above commercial property yields in the 1980s to well below. And in the 1980s the rental yield on residential and commercial property was similar, but today the former is far lower.
Australian investment yields
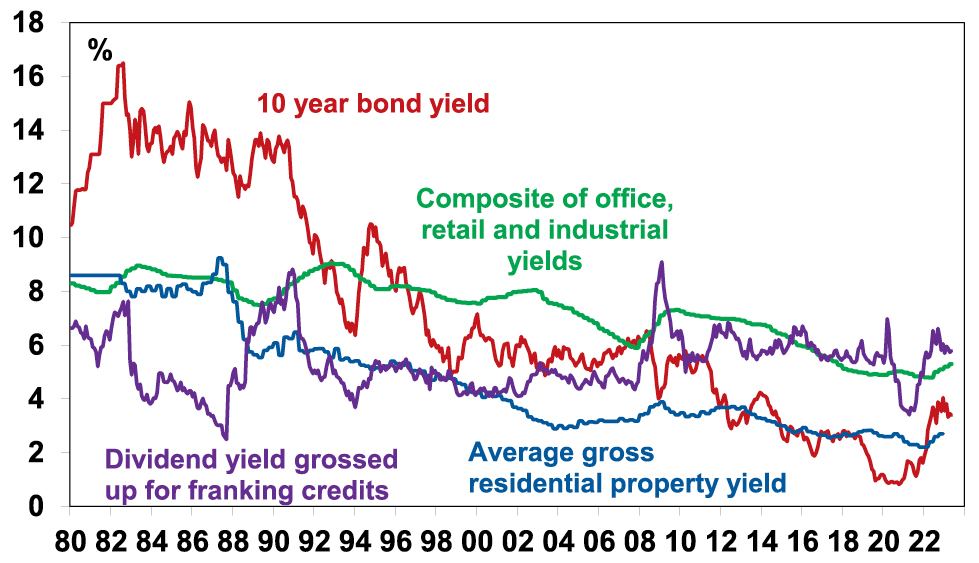
Source: JLL, REIA, Bloomberg, AMP
The commercial property risk premium – is it enough?
This suggests that while unlisted commercial property is vulnerable to an ongoing back up in yields other assets are arguably even more vulnerable. But there is a catch as commercial property is facing an oversupply problem in office and retail whereas the other asset classes are not, eg, Australian housing is facing chronic shortages as immigration surges.
But first to get a better handle on the relative attractiveness of unlisted commercial property compared to bonds we calculate a property risk premium. Comparing the bond yield with the average property yield is not strictly correct as the former is a nominal yield while the latter is a real yield. So, a better comparison is to look at the risk premium offered by commercial property over bonds. The next chart shows a proxy for this.
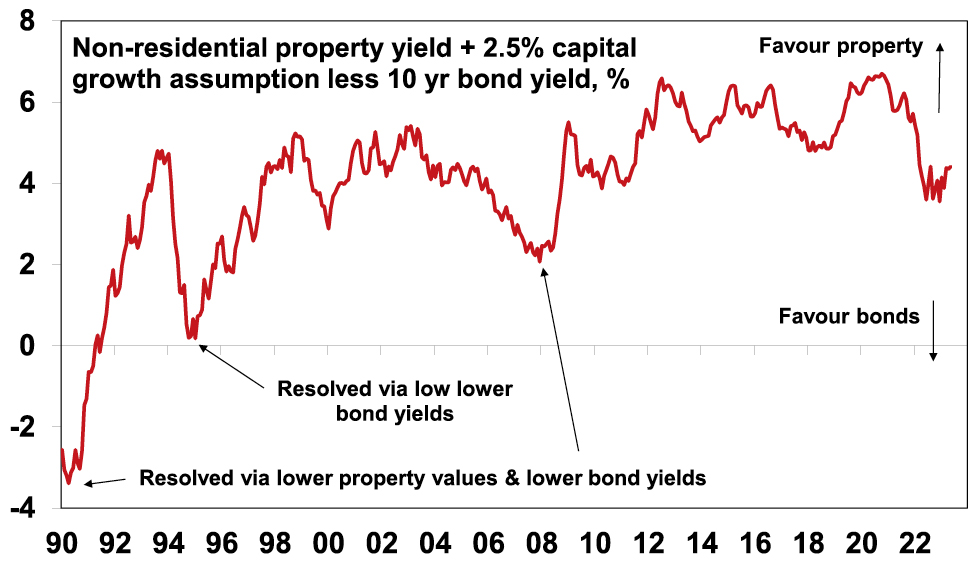
Commercial property risk premium is well down from its high
Source: JLL, Bloomberg, AMP
It assumes that rental and capital growth will average 2.5% pa over time (ie, in line with targeted inflation) and adds this to the average unlisted non-residential property yield to give a guide to potential total returns. The 10-year bond yield has been subtracted to show a property risk premium. Despite the collapse in property yields in late 2020 it reached a record high of more than 6.7% thanks to plunging bond yields at the time below 1%. Since then, the rise in bond yields has seen the risk premium plunge to levels not seen since the 2000s, but at around 4% it’s still relatively high. But there are two threats here. The first is if bond yields continue to rise reversing the yield chasing investor flows that commercial property has benefitted from over many years. And even if bond yields don’t rise further there is a risk that the reduced property risk premium may not be enough to keep investors happy given the outlook for deteriorating leasing conditions ahead.
Work from home and space demand
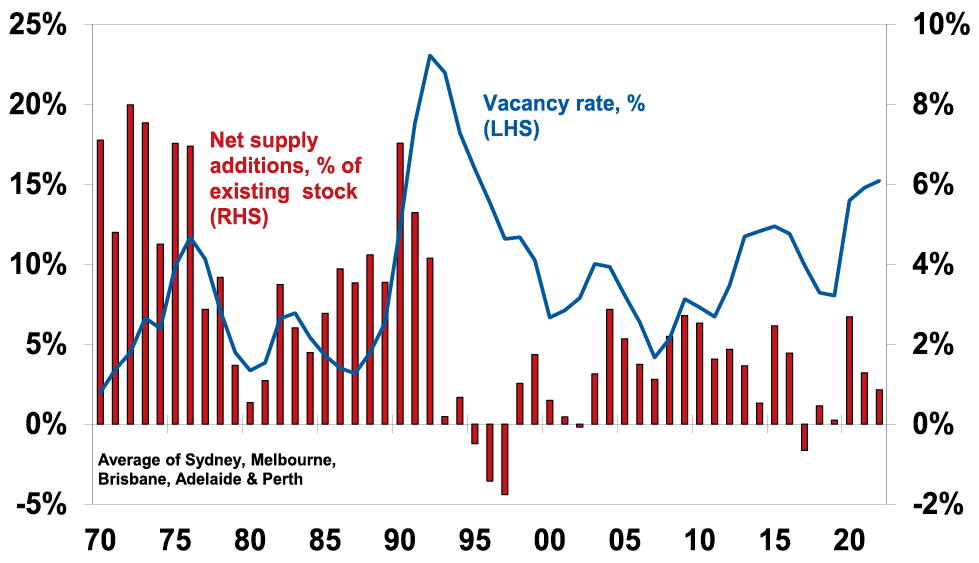
Leasing conditions typically deteriorate when the economic cycle turns down as companies lay off workers & cut hiring, retail spending slows and economic activity slows generally impacting industrial property. This time around it could be made worse by structural considerations in the case of retail and particularly office property. Retail property has been adjusting for years to the rising proportion of activity which is transacted online. The share of retail sales online has gone from around 7% pre-pandemic to around 11% now and this is acting to constrain retail space demand and rents. While there has been a return to the office post the pandemic lockdowns, many office employees are averaging two days a week in the office with Mondays and Fridays often near deserted. There are huge benefits to working together physically around culture, collaboration, idea generation and learning from others but there are also benefits to working from home in terms of no wasted commute time, more focussed work, less damage to the environment, better family flexibility and life balance. Once the pandemic revealed these benefits, they can’t then be unseen. And cost focussed companies with hot desking, laptops and work anywhere IT have pushed their staff in that direction anyway. The ideal for most is probably somewhere in between the extremes at say 2-3 days a week in the office but a return to the pre-pandemic norm of 4-5 days is most unlikely. This means that many companies will likely give up space when their leases expire, as they accept that balanced work from home is here to stay and they use it as a way to save rental costs. Over time this could mean a 30-40% reduction in leased office space demand. Average Australian capital city office vacancy rates are at 15% – their highest since the mid-1990s. But because this measures leased space, significant upside is possible if companies bite the bullet and cut leasing requirements. And rising vacancy rates mean lower office rents and falling values.
Average Australian CBD office vacancy rates and new supply
Source: AMP
Return outlook and what to watch?
The combination of the back up in bond yields resulting in a stalling if not reversal of “search for yield” demand for commercial property, slowing economic activity and structural threats to office and retail space demand leaves unlisted commercial property at risk of significant capital loss (15% plus) ahead. Industrial property has benefitted more from the plunge in bond yields but not does face the same structural threats to space demand as office and retail do so is better placed.
This risks a flow on to banks. Particularly in the US where commercial property loans make up about 40% of smaller banks lending and 13% of bigger banks lending at a time when property owners will be finding it harder to borrow with recent banking stress. In Australia, commercial property loans are only 6% of bank assets and lending is far more prudent suggesting less risk of a re-r un of the damage to banks seen in the early 1990s property collapse. Key to watch will be bond yields, whether the economy avoids recession and where “work from home” settles.
Source: AMP Capital May 2023
Important note: While every care has been taken in the preparation of this document, AMP Capital Investors Limited (ABN 59 001 777 591, AFSL 232497) and AMP Capital Funds Management Limited (ABN 15 159 557 721, AFSL 426455) make no representations or warranties as to the accuracy or completeness of any statement in it including, without limitation, any forecasts. Past performance is not a reliable indicator of future performance. This document has been prepared for the purpose of providing general information, without taking account of any particular investor’s objectives, financial situation or needs. An investor should, before making any investment decisions, consider the appropriateness of the information in this document, and seek professional advice, having regard to the investor’s objectives, financial situation and needs. This document is solely for the use of the party to whom it is provided.
The 2023-24 Budget
Dr Shane Oliver – Head of Investment Strategy and Chief Economist, AMPDiana Mousina – Deputy Chief Economist, AMP
IntroductionThis Budget yet again benefits from a huge revenue windfall allowing a surplus this year for the first time in 15 years and
Read More– return to surplus with fastest improvement since end of WW2, cost of living help but structural deficits remain (albeit smaller)
Dr Shane Oliver – Head of Investment Strategy and Chief Economist, AMP
Diana Mousina – Deputy Chief Economist, AMP
Introduction
This Budget yet again benefits from a huge revenue windfall allowing a surplus this year for the first time in 15 years and cost-of-living relief. At the same time, medium term deficits, while lower, remain leaving the budget vulnerable to anything that upsets the “rivers of gold” flowing to Canberra.

Key budget measures
Key measures, many of which were announced prior, include:
-
$14.6bn over four years in cost-of-living support for mostly low to middle income households, including $3bn (shared with states) in one off energy bill relief for 5mn low-middle income households and 1mn small businesses, an additional $3.5bn to Medicare over 5 years to allow better access to GP’s through a lift in the bulk billing incentive, cheaper medicines, a boost to rent assistance, subsidies to move from gas to electric appliances, increased support for single parents costing $1.9bn over 5 years and a modest increase in Jobseeker with more for over 55s;
-
increased spending on aged care partly flowing from a 15% pay rise for aged care workers which will cost $14.1bn over four years;
-
a $20,000 instant asset write-off for small businesses;
-
a ramp up in defence spending on missiles and submarines, offset by a reallocation of defence spending;
-
some measures to help boost housing affordability – with tax changes to boost build-to-rent housing and wider access to the Home Guarantee Schemes;
-
a lift in renewables investment through $2bn for the Hydrogen industry and incentives for developers to build “greener” houses;
-
measures to support impact investing to tackle social problems;
-
$498mn to crack down on vaping and reduce smoking.
Budget savings include:
-
reform of the Petroleum Resource Rent Tax to raise $2.4bn over 4 yrs;
-
extension of the GST compliance program, saving $3.8bn over 4 years;
-
a 5% rise in tobacco excise raising $3.3bn;
-
measures to slow NDIS growth to 8% pa from 13.8% currently;
-
the 30% tax on super fund earnings where balances exceed $3mn;
-
increasing the payment frequency of super and lifting compliance.
Economic assumptions
Changes to the Government’s forecasts have been modest with higher inflation and lower unemployment this financial year, but no changes to its forecasts for economic growth. It has revised up its wages forecasts for the next financial year and now sees the return of real wages growth in mid-2024. Unemployment is still seen as rising to 4.5% but doesn’t get there until mid-2025. We are a bit less optimistic on growth in the year ahead and hence see higher unemployment earlier. Either way Australia is set to enter a per capita recession. The Government now sees net immigration of 400,000 this year up from a forecast of 235,000 in October, taking population growth to 2% for the first time in 14 years, slowing to 315,000 in 2023-24. The Government revised up its medium-term iron ore price assumption but only to $US60/tonne. With the iron ore price now about $US105/tonne, it’s still a potential source of revenue upside.
Economic assumptions
|
|
|
2022-23 |
2023-24 |
2024-25 |
2025-26 |
2026-27 |
|
Real GDP |
Govt |
3.25 |
1.5 |
2.25 |
2.75 |
2.75 |
|
% year |
AMP |
3.0 |
1.3 |
2.5 |
2.5 |
2.5 |
|
Inflation |
Govt |
6 |
3.25 |
2.75 |
2.5 |
2.5 |
|
% to June |
AMP |
6.2 |
3.0 |
2.7 |
2.5 |
2.5 |
|
Wages, |
Govt |
3.75 |
4.0 |
3.25 |
3.25 |
3.5 |
|
% to June |
AMP |
3.7 |
3.5 |
3.2 |
3.25 |
3.5 |
|
Unemp Rate |
Govt |
3.5 |
4.25 |
4.5 |
4.5 |
4.25 |
|
% June |
AMP |
3.6 |
4.4 |
4.2 |
4.25 |
4.25 |
Source: Australian Treasury, AMP
Budget projections – fastest improvement since WW2
This Budget like all of those since 2020 has benefitted from huge revenue flows coming from a combination of higher personal tax collections due to stronger jobs and wages growth, higher commodity prices and higher non-mining profits than assumed. It looks like “rivers of gold” flowing to Canberra, but it’s really good luck flowing from conservative forecasts regarding jobs, wages, inflation and commodity prices. This windfall (see the line called “parameter changes” in the next table) is estimated to reduce the deficit this financial year by $42bn compared to last October’s forecast, with carry over to next year before slowing as unemployment rises. Some of the windfall has been spent (see the line called “new stimulus”) but 86% of it out to 2026-27 has been saved. As a result, the budget is now projected to be in surplus for this year – its first since 2007-08, a massive turnaround from the $99bn deficit projected less than 18 months ago and the fastest improvement as a share of GDP since the end of WW2 when the deficit went from 10.5% of GDP in 1944-45 to 0.8% in 1946-47. While there is net new stimulus going forward (mainly in 2024-25) due to the cost-of-living measures it turns negative by 2026-27 (as Budget savings kick in) and over the next four years is swamped by the revenue windfall resulting in lower budget deficits going forward.
Underlying cash budget balance projections
|
|
2022-23 |
2023-24 |
2024-25 |
2025-26 |
2026-27 |
|
Dec 2021 MYEFO, $bn |
-98.9 |
-84.5 |
-57.5 |
|
|
|
Oct 22-23 Budget, $bn |
-36.9 |
-44.0 |
-51.3 |
-49.6 |
-53.9 |
|
Parameter chgs, $bn |
42.1 |
42.2 |
21.7 |
15.5 |
25.0 |
|
New stimulus, $bn |
-1.1 |
-12.0 |
-5.4 |
-2.5 |
0.5 |
|
Projected budget,$bn |
4.2 |
-13.9 |
-35.1 |
-36.6 |
-28.5 |
|
% GDP |
0.2 |
-0.5 |
-1.3 |
-1.3 |
-1.0 |
Source: Australian Treasury, AMP
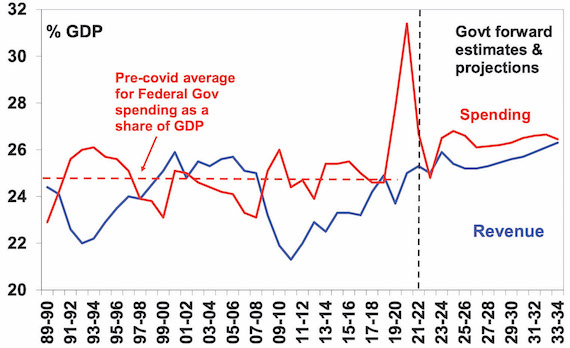
Projections for spending as a share of GDP remain above the pre-Covid average of 24.8% but are lower than previously with Budget measures restricting spending growth to 0.6%pa out to 2026-27. Revenue trends higher (partly due to tax measures in the Budget) as a share of GDP reaching its 1986-87 record of 26.2% in a decade.
Federal Government spending and revenue
Source: Australian Treasury, AMP
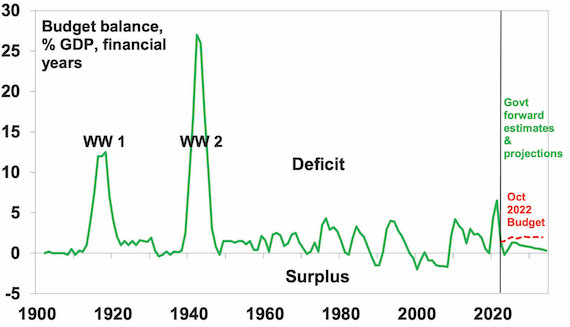
While the Budget has seen a rapid turnaround from deficit to surplus this year and has made better progress in reducing the medium term structural deficit, it still persists through the next decade only gradually falling.
Australian Federal budget deficit
Source: Australian Treasury, AMP
Thanks to lower deficits, gross public debt is now projected to be far lower as a share of GDP, with the $1trn level now pushed out two years to 2026.
Australian Federal gross debt
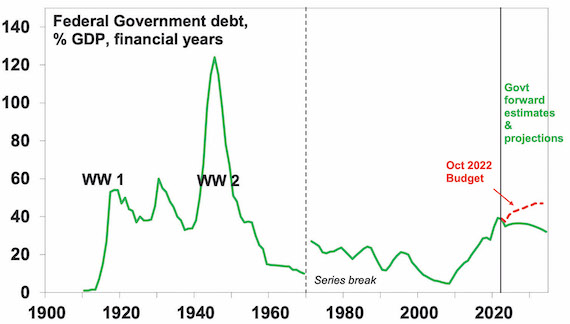
Source: RBA, Australian Treasury, AMP
Assessment
Winners include: low and middle income households; pensioners; single parents; medicine users; GPs; aged care workers; low income renters; JobSeeker recipients; small businesses; the build to rent sector; skilled migrants; & the environment. Losers include: gas producers; vapers & smokers; some prospective NDIS recipients; consultants to the public sector; high balance super members; & travellers ($10 more to leave Aust).
The Budget has a lot commend it: the cost-of-living measures will help ease pressure on the most vulnerable and some (energy, medicine and rent relief) will lower measured inflation; the budget is now back in surplus for this financial year; by “saving” the bulk of the revenue upgrade budget deficits are lower and this cuts interest costs; the Government has slowed structural spending growth (eg in the NDIS) and raised extra revenue; and there is still scope for revenue surprise with commodity price assumptions.
However, the Budget has several weaknesses:
-
While some of the cost-of-living measures will directly help lower measured inflation (by around 0.4%), the new fiscal stimulus next financial year of $12bn risks boosting demand and adding to inflation – but it’s hard to be adamant as overall the Budget is taking more out of the economy compared to the projections last October.
-
While the medium-term structural budget deficits have been sharply reduced they are still large – despite this being the Budget in the political cycle to address this issue as next year’s budget will be in the run up to the next election. It’s a bit of a lost opportunity and leaves the budget vulnerable should economic conditions prove weaker than expected and doesn’t provide much hope for actually paying down debt to put money aside for a rainy day.
-
In particular, after several years of upside surprise to revenue, the risk is that this reverses in the year ahead if the economy slows more.
-
While the rise in Government spending as a share of GDP has been capped it’s still projected to settle at a level well above that seen pre pandemic thereby locking in a bigger government sector which risks further slowing productivity growth over the medium term.
-
More broadly, there is not much new here to turnaround Australia’s deteriorating productivity performance. This is the key to growth in living standards but needs urgent reform in terms of tax reform, competition, the non-market services sector, industrial relations, education and training and energy generation. Fortunately, the Government is moving on the last two but not much on the rest.
-
While the housing measures are welcome, they are unlikely to make much of a difference in the next few years to housing affordability with the supply shortfall intensifying with very high immigration levels.
Implications for the RBA
With the Budget overall taking more out of the economy than it’s putting back in compared to what was projected last October, its hard to see significant implications for the RBA but it will be wary of the boost to households from the cost-of-living measures which could boost spending.
Implications for Australian assets
Cash and term deposits – cash and bank deposit returns have improved substantially with RBA rate hikes but are still relatively low.
Bonds – budget deficits add to upwards pressure on bond yields, but at least they have been lowered near term so there should be no new pressure.
Shares – the Budget is a small positive for household spending but not enough to offset the negatives impacting the sector and overall there is not really a lot in it for the share market.
Property – the housing measures are unlikely to alter the property price outlook which is dominated by supply shortages and surging immigration versus the impact of rate hikes. We see roughly flat home prices this year.
The $A – the Budget is unlikely to change the direction for the $A.
Source: AMP Capital May 2023
Important note: While every care has been taken in the preparation of this document, AMP Capital Investors Limited (ABN 59 001 777 591, AFSL 232497) and AMP Capital Funds Management Limited (ABN 15 159 557 721, AFSL 426455) make no representations or warranties as to the accuracy or completeness of any statement in it including, without limitation, any forecasts. Past performance is not a reliable indicator of future performance. This document has been prepared for the purpose of providing general information, without taking account of any particular investor’s objectives, financial situation or needs. An investor should, before making any investment decisions, consider the appropriateness of the information in this document, and seek professional advice, having regard to the investor’s objectives, financial situation and needs. This document is solely for the use of the party to whom it is provided.
Australian home prices – here we go again!
Dr Shane Oliver – Head of Investment Strategy and Chief Economist, AMP Capital
IntroductionYet again the Australian residential property market is surprising with its resilience and defying forecasts for sharp falls. After falling 9.1% from their high in April last year to their low in February, national
Read MorePrices look to have bottomed as the supply shortfall dominates, but watch rates and unemployment
Dr Shane Oliver – Head of Investment Strategy and Chief Economist, AMP Capital

Introduction
Yet again the Australian residential property market is surprising with its resilience and defying forecasts for sharp falls. After falling 9.1% from their high in April last year to their low in February, national average home prices rose another 0.5% in April after a 0.6% gain in March and are up by 1.2% from their February low. Sydney has led the charge with a 1.3% rise in April and is up 3% since January.
Australian dwelling price growth, to April
|
|
Apr % chg |
Annual % chg |
% recent peak to low |
% recent low to now |
|
Sydney |
1.3 |
-10.7 |
-13.8 |
3.0 |
|
Melbourne |
0.1 |
-8.9 |
-9.6 |
0.7 |
|
Brisbane |
0.3 |
-9.8 |
-11.0 |
0.4 |
|
Adelaide |
0.2 |
1.3 |
-2.4 |
0.2 |
|
Perth |
0.6 |
1.3 |
-0.9 |
1.1 |
|
Hobart |
0.0 |
-12.7 |
-13.0 |
NA |
|
Darwin |
-1.2 |
-0.5 |
-3.3 |
NA |
|
Canberra |
0.0 |
-9.3 |
-9.5 |
NA |
|
Capital city avg |
0.7 |
-8.4 |
-9.7 |
1.4 |
|
National avg |
0.5 |
-8.0 |
-9.1 |
1.2 |
Source: CoreLogic, AMP
Average capital city home prices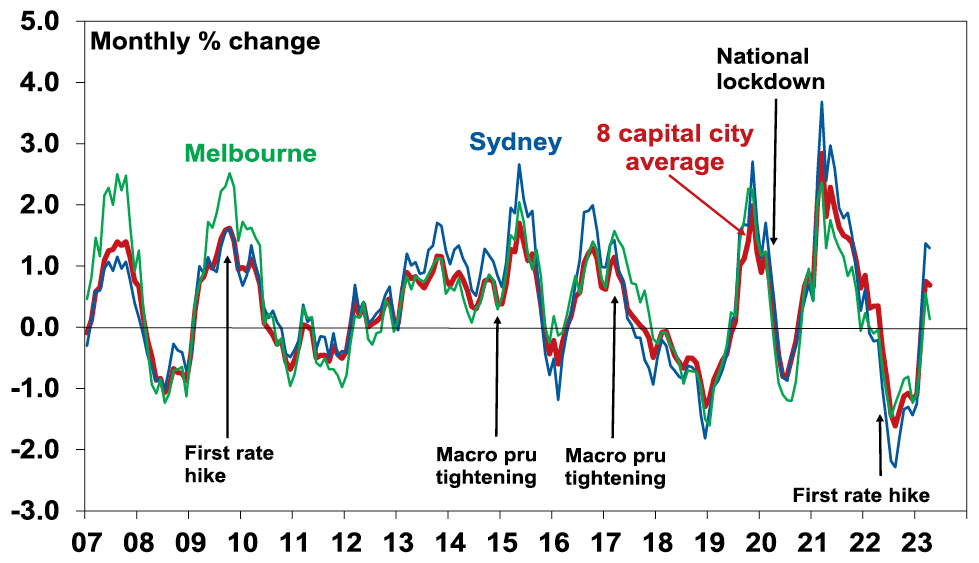
Source: CoreLogic, AMP
Solid auction clearance rates, signs of a turn up in housing finance & a pickup in upper end property prices provide confirmation of the upswing.
We had thought that after a brief bounce, prices would resume their downswing as higher interest rates continue to impact, but its looking increasingly likely that prices have bottomed as a deteriorating demand/supply imbalance dominates. As such, our forecast for a top to bottom fall of 15-20% fall out to late this year is looking too pessimistic and we have revised up our property forecasts. However, the current property market dynamics of a sharp rise in interest rates and slowing economic growth but strong underlying demand and constrained supply are very unusual, so the risk of another down leg remains high. This note looks at these conflicting dynamics.
A far worse property demand/supply imbalance
The worsening demand/supply imbalance reflects a mix of factors.
-
Immigration has returned far quicker than expected and is now likely to be around 400,000 this financial year, which is well up from 5940 in lockdown impacted 2021 and well above the 235,000 forecast in last October’s Budget. The rapid rebound in immigration over the last 18 months roughly equates to demand for an extra 200,000 dwellings.
-
At the same time the supply of new dwellings has slowed with labour shortages, cost increases and falling building approvals.
-
As such we are seeing a renewed surge in the undersupply of housing.
Home construction versus population growth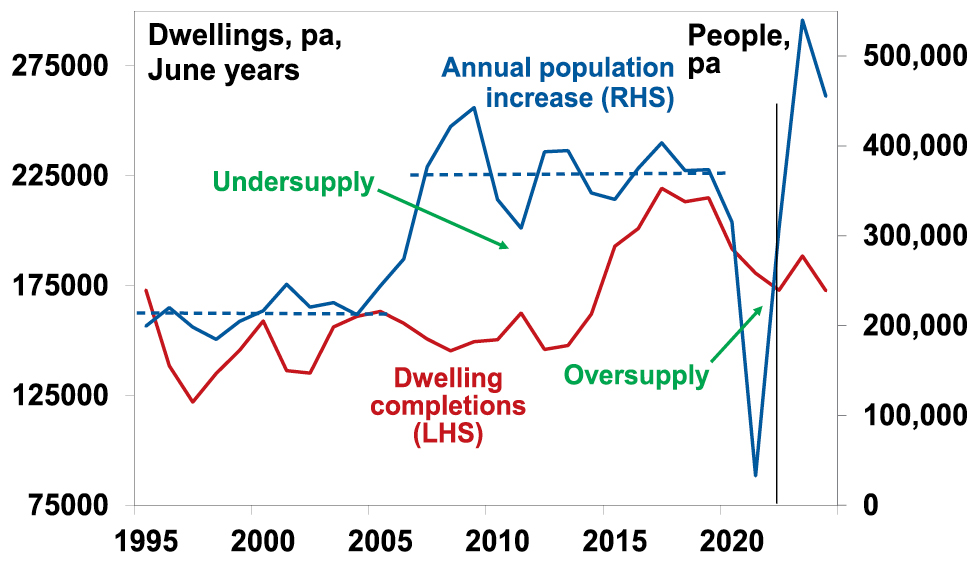
Source: ABS, AMP
-
This has occurred against the background of a decline in average household size to less than 2.5 people per dwelling through the pandemic, which the RBA estimates has added around 120,000 households to underlying dwelling demand. This largely offset the negative impact on demand from the hit to immigration through the pandemic lockdown. It could reverse again with rising housing costs but so far this is unknown.
-
The very tight housing supply situation is reflected in capital city rental vacancy rates being at a record low of around 1% and this is leading to a surge in rents. This in turn is likely driving some to seek to buy a property as its harder to find rental property.
-
Foreign demand for property is reportedly returning – led by China.
-
First home buyer exemptions from stamp duty in NSW and other government support programs will be boosting demand.
-
Despite the rise in interest rates, listings remain low tracking down around 22% from their five-year average according to CoreLogic.
-
There’s a growing expectation that the RBA cash rate is at or close to peaking.
Outlook – revising up our home price forecasts
The combination of surging underlying demand driven by immigration, tight supply, low listings and home buyers motivated by expectations rates may be peaking & the historical record showing prices rebounding quickly after falls, tight rental markets and a fear of missing out appear to be dominating the drag from high interest rates and the slowdown in the economy. As such, our forecast for a top to bottom fall of 15-20% out to late this year is looking too pessimistic and we have revised our national average home price forecast for this year from a fall of 7% to flat to up slightly & expect roughly 5% growth next year. This assumes the RBA cuts rates through next year and the economy has a soft landing.
But the risk of another leg down remains high
However, the headwinds facing the property market are significant and likely at least to provide a constrained ride versus past recoveries with the high risk of a resumption of the downswing (putting us back on track for our original forecast of a 15-20% top to bottom fall in property prices).
-
The first point to note is that this property cycle has been a bit unusual. Normally it’s taken several interest rate hikes to knock property prices down because it takes time to cool demand, for unemployment to rise and for distressed sales to increase. However, in this cycle property prices started to fall immediately when rates started to go up and at a time when the underlying property demand/supply situation was tightening. And the last three property price upswings (from 2009, 2012 and 2019) required an easing in monetary policy to get underway (see the ovals in the next chart).
Australian property prices and interest rates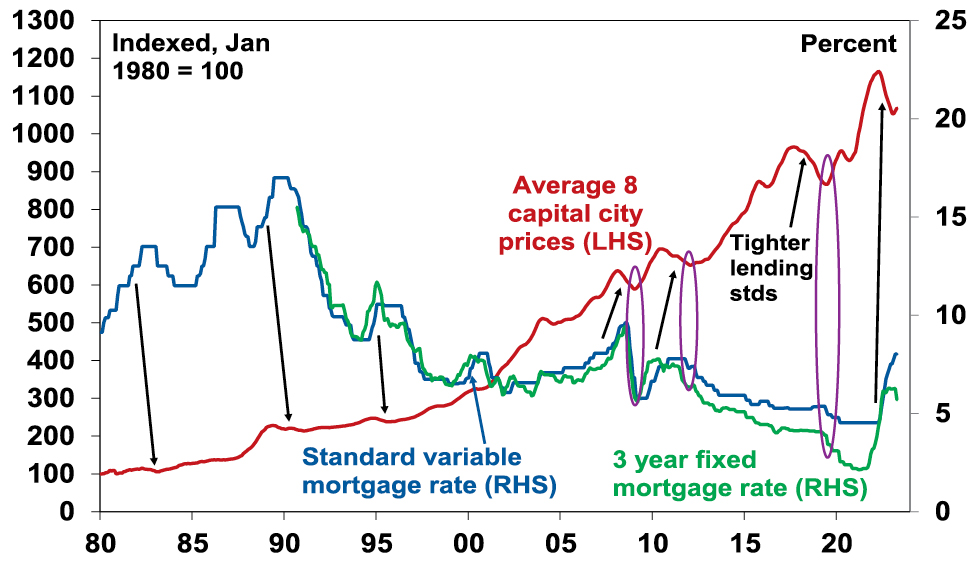
Arrows who the normally lagged lead from rate hikes to price falls. Source: CoreLogic, RBA, AMP
-
So maybe the price slump last year ran ahead of itself and what we are seeing now is just a correction leaving open the risk of another down leg as the full dampening impact of higher interest rates flows through to property demand and listings and until the RBA cuts rates.
-
In this regard, there is likely still significant pain to come from higher rates. Household debt servicing payments as a share of income have already risen to their highest in more than a decade and a rise in the cash rate to 4.1% would see them pushed to record levels. The RBA estimates that 40% of home borrowers have less than 3 months of prepayment buffers, 15% of variable rate borrowers will have negative cash flow by year end if the cash rate rises to 3.75% and nearly 900,000 fixed rate mortgages are due to reset to interest rates that are more than double their initial level, with much of this due to occur this quarter and next. At the same time unemployment is likely to rise and household size may rise due to the surge in rents. This all runs the risk of another hit to buyer demand & more distressed sales.
-
While we think that rates are at or close to peaking rate, cuts are unlikely until late this year at the earliest and the risk of more rate hikes remains high given still high inflation, upside risks to wages and RBA concern that very strong population growth will add to inflation.
-
The hit to home buying capacity from rate hikes – of 27% for a buyer with a 20% deposit and average full-time earnings – remains, even if rates have stopped rising. See the next chart. There was a divergence versus prices in 2003-2008 when buyer capacity fell as rates rose but prices rose due to a surge in demand from high immigration levels associated with the mining boom with the divergence ultimately eliminated with the rapid rate cuts in the GFC. This time around we are seeing a similar supply shortfall, but rapid rate cuts are unlikely. So, this is likely to remain on ongoing constraint on buyer demand.
Australian Average Home Prices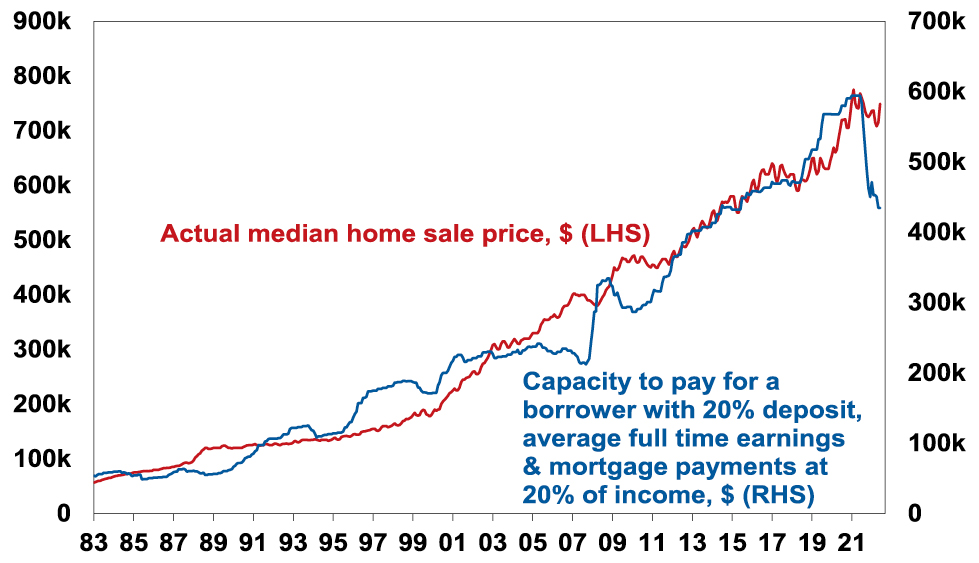
Source: RBA, CoreLogic, AMP
-
All measures of housing affordability are poor. Despite the fall in prices from their highs it takes over 10 years for someone on average full-time earnings to save for a deposit, versus 5 years 30 years ago.
Years it takes to save for a 20% deposit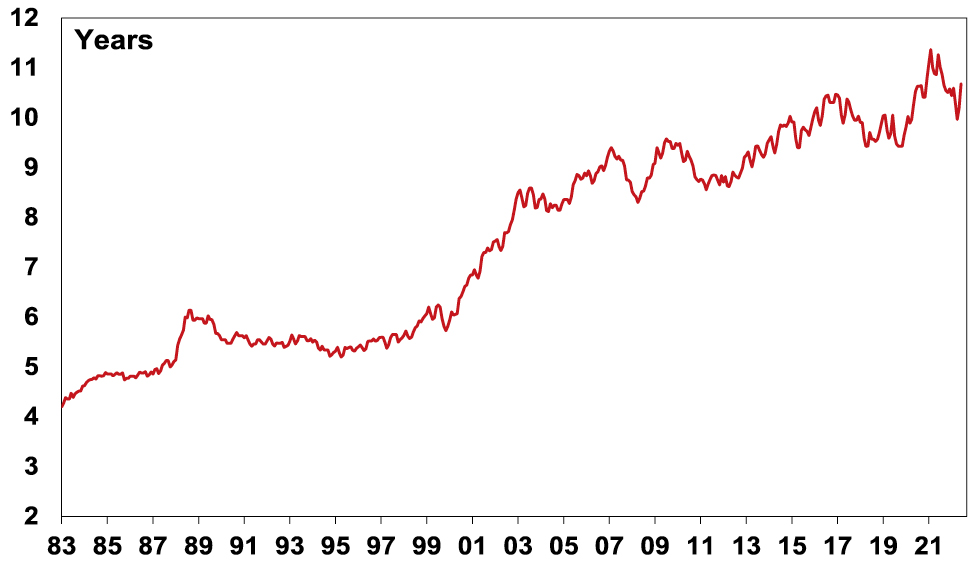
Source: CoreLogic, AMP
Concluding comment
Given the resurgence in underlying demand on the back of very high immigration levels and constrained supply we have revised up our home price forecasts – which is not something I feel entirely comfortable with (given the risks from higher interest rates) or like (given horrible housing affordability). Our base case is now for flat to slightly up prices this year followed by a 5% rise next year. Sydney (benefitting from the surge in immigration) and Perth (with better affordability) are likely to lead the way. However, the headwinds of higher interest rates and poor affordability will likely constrain the upswing at the very least but also mean there remains a still very high risk (which I would put at 45%) of another down leg as rate hikes fully impact and unemployment starts to rise. The conflicting forces of higher rates and a slowing economy, but a chronic demand/supply imbalance make the property market very hard to read with greater than normal uncertainty. Interest rates, unemployment and auction clearance rates are key indicators to watch.
Source: AMP Capital May 2023
Important note: While every care has been taken in the preparation of this document, AMP Capital Investors Limited (ABN 59 001 777 591, AFSL 232497) and AMP Capital Funds Management Limited (ABN 15 159 557 721, AFSL 426455) make no representations or warranties as to the accuracy or completeness of any statement in it including, without limitation, any forecasts. Past performance is not a reliable indicator of future performance. This document has been prepared for the purpose of providing general information, without taking account of any particular investor’s objectives, financial situation or needs. An investor should, before making any investment decisions, consider the appropriateness of the information in this document, and seek professional advice, having regard to the investor’s objectives, financial situation and needs. This document is solely for the use of the party to whom it is provided.
RBA Review
Dr Shane Oliver – Head of Investment Strategy and Chief Economist, AMP Capital
IntroductionThe unveiling of the independent Review of the RBA – “An RBA fit the future” – has received much attention with talk of a radical overhaul of the RBA. However, there is
Read More– it’s not clear the proposed reforms will lead to a better outcome for the Australian economy
Dr Shane Oliver – Head of Investment Strategy and Chief Economist, AMP Capital
Introduction
The unveiling of the independent Review of the RBA – “An RBA fit the future” – has received much attention with talk of a radical overhaul of the RBA. However, there is a real risk in grossly exaggerating the problem and undertaking a big change at the RBA with unclear benefits. In particularly there is a danger in assuming the approach employed by some foreign central banks must be better than our own.

RBA “mistakes”
Since the middle of last decade its often thought that the RBA made three key “mistakes” and these are covered as “episodes” of concern in the Review.
-
Arguably running monetary policy too tight in the years ahead of the pandemic such that inflation was below target at the same time that underemployment was high and wages growth very low.
-
Arguably providing too much stimulus to the economy through the pandemic. This included the 0.1% target for the three-year bond yield and forward guidance that it did not expect conditions to be met to raise interest rates until 2024 at the earliest.
-
And arguably being initially too slow to start removing monetary stimulus in the face of rising inflation from 2021.
Some may add another two.
-
Boosting home prices by running overly easy monetary policy – although this would be inconsistent with the first “mistake” above.
-
Raising interest too aggressively over the last year and in the process not allowing for the threat to indebted households and unemployment and or enough time to assess the lagged impact of rate hikes. While I too have concerns on this front its too early to say who is right, particularly with inflation still high and unemployment still very low (and below most estimates of full employment). And by raising rates a bit less (so far) than many other major central banks the RBA has arguably been more balanced in hiking that others have been.
The first led to initial calls for a review of the RBA, and then understandable community angst around the perceived “no rate hikes to 2024” guidance and the rapid pace of hikes has arguably reinforced it.
Key Review recommendations
The Review came up with 51 recommendations to reinforce the monetary policy framework, decision making, culture and governance of the RBA. Putting aside the issues around RBA culture, the key recommendations are as follows:
-
Affirmation of the flexible 2-3% inflation target which “has generally worked well”, although it recommended the RBA’s objectives should be more clearly and equally defined around price stability and full employment.
-
Removal of the “on average, over time” reference to the achievement of the inflation target, which should be replaced with the RBA explaining “how it is using its flexibility”, including “how quickly it is aiming to return inflation to around the midpoint of the target”.
-
Affirmation of RBA independence and that it be strengthened with removal of the power of the Treasurer to overrule it.
-
The separation of the RBA Board from 1 July next year into a Governance Board (with an external chair) to support and oversee the management of the RBA and a dedicated Monetary Policy Board to determine monetary policy.
-
The Monetary Policy Board to be comprised of the RBA Governor as chair, Deputy Governor and Treasury Secretary with 6 external members with expertise in macroeconomics, the financial system, labour markets and the supply side of the economy.
-
The Monetary Policy Board would have formal votes with the 6 external members having the potential to override RBA recommendations.
-
The Monetary Policy Board would move to 8 meetings a year (from 11) to allow for better deliberation.
-
Press conferences after each monetary policy meeting with an increased amount of information to be released.
-
External Monetary Policy Board members to publicly discuss decisions and have access to RBA staff.
The basic central banking model proposed by the Review – of a separate Monetary Policy Board or committee, 8 meetings a year, press conferences after each meeting with all members speaking on monetary policy – is essentially what is undertaken to varying degrees in the UK, US, Canada and New Zealand.
But its not clear that the case for radical change to adopt the proposed foreign model has been made
Looking at the key recommendations of the Review:
-
The RBA has already been targeting both price stability and full employment under Governor Lowe – which partly explains why it’s been less aggressive in raising rates than other central banks in raising rates – see the next chart. So, it’s not clear that equalising the objectives of price stability and full employment would really make much difference to the way the RBA does things. Given the debilitating impact of high inflation on the economy, low and stable inflation is a pre-condition for sustained full employment.
Changes in global policy rates since 2021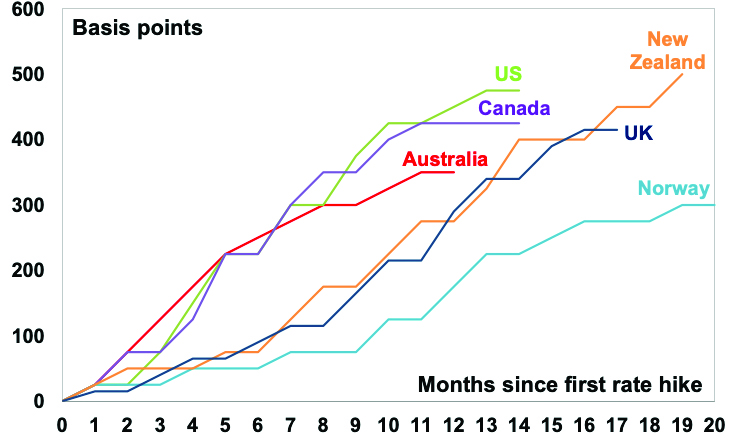
Source: Bloomberg, AMP
-
It’s not clear that switching to regular press conferences and commentary from external Monetary Policy Board members will add much except more noise and potentially confusion around RBA decisions (as seen in other countries like the US where there are often several Fed speakers commenting on interest rates every day with often differing views) and the RBA already supplies a lot of information (arguably too much).
-
Removal of the “on average, over time” reference to the inflation target with the RBA explaining “how it is using its flexibility” may make the RBA less tolerant of short-term deviations from the inflation target and so could result in more aggressive and volatile moves in interest rates posing a greater threat to full employment.
-
Switching to less meetings may contribute to better quality decisions, but it may also make the RBA less agile, reduce “announcement effects” and necessitate bigger moves as seen by other central banks.
-
Having more monetary policy experts involved in the determination of monetary policy at the Board level is potentially a move in the right direction in that such a Board may be better able to challenge the RBA and add to its views. But it’s not entirely clear that the current Board has been remiss in this regard – Governor Lowe and some Board members don’t seem to see it this way.
-
Yes, the RBA has made some mistakes in recent times. But these have mostly only been clear in hindsight and also partly reflect other factors through a period of extreme economic shocks that wrong footed governments and many economists at times as well. The inflation undershoot prior to the pandemic partly reflected RBA concerns to avoid adding to high levels of household debt with already record low interest rates, along with a Federal Government focussed on fiscal austerity at the time such that monetary and fiscal policy were pushing in opposite directions. The RBA’s excessive stimulus through the pandemic reflected the massive threat at the time, with share markets plunging 35% in a month and talk of deep recession (and in some cases depression) and double-digit unemployment. And its cautious initial response to rising inflation arguably reflected concerns about the fragility of the recovery and a fear that we would simply go back to the chronic low inflation seen in the pre-pandemic period if it moved too quickly to raise interest rates.
-
Having more macroeconomic experts on the Board may at the margin help avert a rerun of some of the RBA’s missteps in relation to yield targeting and communication – particularly the “no rate hike till 2024” guidance, but the RBA has already learned from those experiences and is unlikely to repeat them again anyway.
-
The potential for external members to outvote the RBA members on the Monetary Policy Board (with 6 votes to 2 or 3 depending on whether the Treasury Secretary is included) could create confusion and actually reduce formal internal RBA accountability.
Overall, the recommended changes if fully implemented are unlikely to have a significant impact on the outlook for monetary policy as flexible 2-3% inflation targeting will sensibly remain in place. In particular, there is nothing in the recommendations pointing to a less hawkish RBA that some may have been hoping for. If anything, professional economists on the Monetary Policy Board could be more hawkish. Don’t forget that there are plenty of other central banks – in the UK, NZ, Canada and the US – that have separate monetary policy committees, less meetings and press conferences after each meeting, but which have actually been more aggressive and arguably less balanced in raising interest rates than the RBA has!
A key concern is that it’s questionable whether moving to the separate Monetary Policy Board, less meetings, more press conferences and more speakers on monetary policy model employed in several other countries (the UK, Canada, the US and NZ to varying degrees) is justified when those countries have not necessarily achieved better economic outcomes than the RBA. As the Review itself notes “Australia’s economic performance has been very good since flexible inflation targeting was introduced in the early 1990s” and “at least on a par with other comparable countries” and “there is a broad consensus among those that the Review consulted that the Reserve Bank Board’s actions and the current monetary policy arrangements have contributed significantly to these outcomes”. So if the proposed model is not demonstrably superior, why make the change to it.
Concluding comment
The shift to flexible inflation targeting of 2-3% and RBA independence three decades ago was a monumental shift and since then, in the words of the Review, “Australia’s economic performance has been very good”. Some of what is proposed by the Review has merit but it’s not clear that the basic foreign central banking model proposed is superior to what we have now. We risk throwing out the baby with the bathwater.
Source: AMP Capital April 2023
Important note: While every care has been taken in the preparation of this document, AMP Capital Investors Limited (ABN 59 001 777 591, AFSL 232497) and AMP Capital Funds Management Limited (ABN 15 159 557 721, AFSL 426455) make no representations or warranties as to the accuracy or completeness of any statement in it including, without limitation, any forecasts. Past performance is not a reliable indicator of future performance. This document has been prepared for the purpose of providing general information, without taking account of any particular investor’s objectives, financial situation or needs. An investor should, before making any investment decisions, consider the appropriateness of the information in this document, and seek professional advice, having regard to the investor’s objectives, financial situation and needs. This document is solely for the use of the party to whom it is provided.
Investment outlook Q&A
Dr Shane Oliver – Head of Investment Strategy and Chief Economist, AMP Capital
IntroductionInvestment markets continue to be buffeted by multiple uncertainties, but so far returns this year have been okay as shares have climbed the “wall of worry”. This note takes a look at the main
Read More– Inflation, interest rates, recession, the US debt ceiling, geopolitics, house prices and other issues
Dr Shane Oliver – Head of Investment Strategy and Chief Economist, AMP Capital
Introduction
Investment markets continue to be buffeted by multiple uncertainties, but so far returns this year have been okay as shares have climbed the “wall of worry”. This note takes a look at the main questions investors commonly have in a simple Q & A format.

Have we seen the peak in inflation?
Inflation is still too high but it looks to have peaked. US inflation led on the way up and it looks to be leading on the way down. It has fallen to 5%yoy from a high of 9.1% in mid last year. Supply bottlenecks have improved, freight costs have fallen and slowing demand is reducing demand side inflation. While core services inflation excluding shelter remains sticky it is starting to slow, shelter (or rent) inflation also looks to have peaked and our US Pipeline Inflation Indicator continues to point to lower inflation.
AMP Pipeline Inflation Indicator
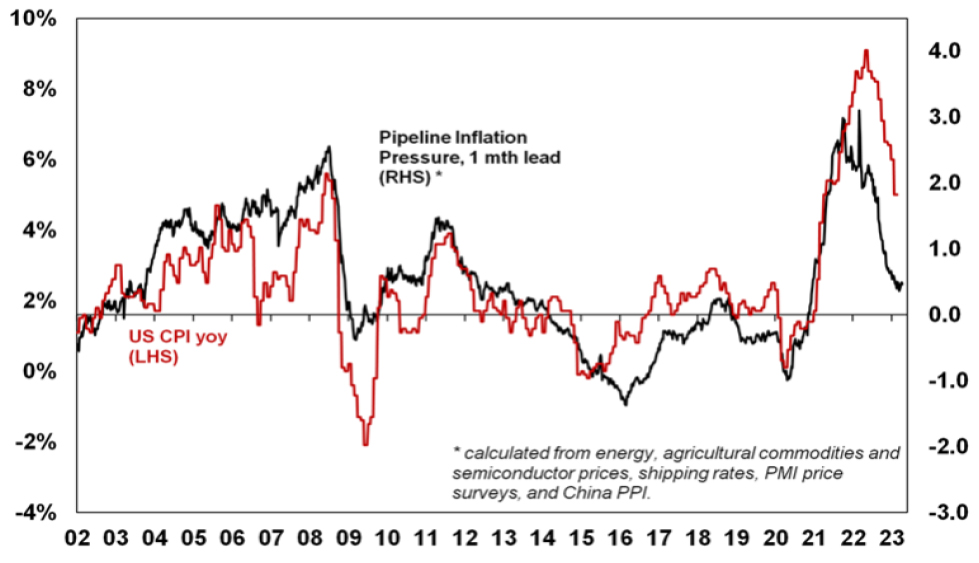
Source: Bloomberg, AMP
In Australia, inflation is lagging the US by about six months and looks to have peaked in the December quarter. There is likely more upside in electricity prices and rents, and based on the US experience underlying measures of inflation may take a bit longer to peak. However, the ABS’ Monthly CPI Indicator fell back to 6.8%yoy in February from a high of 8.4% in December and our Australian Pipeline Inflation indicator points to a further fall in inflation ahead.
Australia Pipeline Inflation Indicator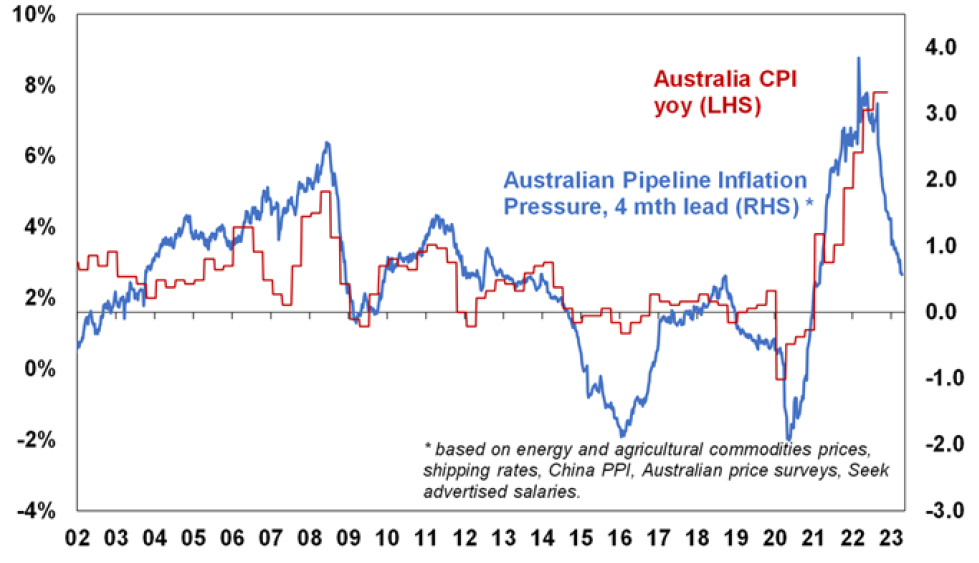
Source: Bloomberg, AMP
What impact will US banking strains have?
Quick action by US and Swiss authorities have settled the banking problems seen in March. However, the banking strains likely have further to run as tighter monetary policy impacts borrowers & hence the quality of loans and the banking strains look to have increased bank funding costs and pressure on margins and appears to be resulting in tighter lending standards. Estimates of its impact by the Fed range from being equivalent to 0.25%-1.5% of Fed rate hikes. So it should take pressure off the Fed.
Are central banks nearly done?
The combination of easing inflation pressures, the defacto monetary tightening flowing from banking strains in the US and Europe and increasing evidence of cooling economies and labour markets suggests that major central banks are at or close to the top on interest rates:
-
Several central banks have paused monetary policy tightening in the last month or so – including the RBA, Bank of Canada, Bank of Korea and the Singapore Monetary Authority.
-
The ECB has continued to tighten but has softened its tightening bias.
-
The sticky core US inflation evident in March likely leans the Fed towards one last 0.25% rate hike at its May meeting. But with falling job openings, a mixed jobs report for March, rising jobless claims the minutes from the last Fed meeting indicating that the Fed’s staff expect bank stress to contribute to a “mild recession” it’s a close call.
-
In Australia, with the labour market being a lagging indicator and economic growth and inflation likely to continue to slow our view is that we are either at or very close to the peak in rates ahead of cuts later this year or early next. Another hike in May is still a very high risk though – as still strong jobs data has added to the risk of a wages breakout and the upswing in the property market if sustained could reverse the negative wealth effect from lower home prices. March quarter inflation data will be watched closely.
What is the risk of recession?
While the risk of recession has receded in Europe (with lower gas prices) it remains high in the US with various leading indicators – including inverted yield curves (where short term interest rates are above longer term yields) – warning of a high risk of US recession in the next 6-12 months. Over the last 50 years all US recessions have been preceded by inverted yield curves as is the case now – but the lag can be up to 18 months and it can give false signals. However, if the Fed soon stops tightening a US recession could still be averted or it could be mild which would limit further downside in US shares. In Australia, the risk of recession is high. But our base case is that it will be avoided thanks to strong business investment, Chinese reopening and providing the RBA soon stops hiking. Economic growth will still slow to a crawl this year though.
Have geopolitical threats faded?
These have increased in recent years with the loss of global faith in liberal democracy and relative decline of US giving rise to a multipolar world. So far this year geopolitical issues have not had a major impact on markets, helped by the absence of significant elections in major countries and the stalemate in Ukraine. But risks remain around China and Taiwan, Iran’s progress towards nuclear weapons, Russia/Ukraine and the possible return of Trump in next year’s US election.
How big a problem is the US debt ceiling?
The US Congress imposes a ceiling on Government debt that needs to be raised every so often given its ongoing budget deficit. If it’s not raised once reached spending would have to be slashed back to the level of revenue – leading to a 5% or so hit to GDP and talk of default on its commitments. As we saw in 2011 and 2013 raising it can lead to brinkmanship as fiscally conservative Republicans seek to reduce the budget deficit and as always Washington leaves things to the last minute to resolve. Back then it was resolved but only in the nick of time and after investment markets fell sharply. The process then caused damage to Republican’s political standing so in subsequent years it was resolved relatively smoothly. However, with Republican’s regaining control of the House of Representatives and demanding a commitment to spending cuts it looks like it will be an issue again this year. The US has already hit its debt ceiling but cash balances mean it can probably hold out to mid-year or the third quarter without needing to raise it. Raising it will be a long process where the House passes a bill with spending cuts that’s rejected by the Senate and Biden ahead of inevitable negotiations at some point. But any resolution will again be last minute, and markets will fret at the prospect of no deal and a default causing the potential for share markets falls at the time. The odds are a deal will be reached enabling shares to rebound or Republican’s will get the blame for any default and big cuts to spending which won’t look good for them ahead of next year’s election.
Are bonds dead as a portfolio diversifier?
Last year saw both shares and bonds sell off leading many to question the role of bonds as a portfolio diversifier to equity volatility. However, last year’s poor performance from bonds and shares together was driven by a common driver of inflation. This is not that unusual historically when the surge in inflation in the 1970s and then its collapse in the 1980s into the early 1990s boosted the correlation between them. However, with bond yields now higher and inflation falling bonds are likely now to provide a better diversifier to equities should equities be hit by recession risks.
Will high levels of global debt de-rail things?
This is now estimated to be up around $US300trn or nearly 350% of GDP globally and clearly poses a risk with interest rates rising, particularly in emerging countries with $US debt. However, much of the rise in debt since the pandemic has been in the public sector where the risk of major problems is less (as governments can raise taxes) and high debt levels may make central banks jobs easier as they won’t have to raise rates as much as otherwise to slow down spending and hence inflation.
Have Australian house prices already bottomed?
From their low in February, average dwelling prices in the five biggest capital cities are up 1.3% led by Sydney which is up 2.6%. This appears to reflect bargain hunters, first home buyers and investors stepping in after sharp falls, expectations that mortgage rates have peaked, the return of immigrants and low listings. Our base case remains for Australian home prices to fall further out to later this year as interest rate hikes impact and slower economic growth impact. The RBA estimates that 40% of home borrowers have less than 3 months prepayment buffers, 15% of variable rate borrowers will have negative cash flow by year end if the cash rate rises to 3.75% and nearly 900,000 fixed rate mortgages are due to reset to interest rates that are more than double their initial level. This all runs the risk of increased distressed sales, particularly as growth slows. But the rapid return of immigration, very low rental vacancy rates & constrained supply mean that our expectation for a top to bottom fall of 15-20% may be too pessimistic and we may have already seen the low. So given the conflicting forces at present the property market has become hard to call.
How can we improve housing affordability?
The resurgence of immigration, record low rental vacancy rates, still very high home price to income and debt to income ratios and surging rents have all refocussed attention on poor housing affordability in Australia. Fixing this requires a multifaceted solution across all levels of government with targets to be achieved over say a five-year period. My list of policies to improve affordability includes:
-
Measures to boost new supply – relaxing land use rules within reason, releasing land faster and speeding up approval processes.
-
Matching the level of immigration to the ability to supply housing. The pandemic driven pause in immigration provided a perfect opportunity to get this right upon reopening but we botched it yet again.
-
Encouraging greater decentralisation – the “work from home” phenomenon shows this is possible, but it should be helped along with infrastructure and measures to boost regional housing supply. Excess CBD office space should be converted to residential.
-
Tax reform – to replace stamp duty with land tax (to make it easier for empty nesters to downsize & cutting the upfront burden for first home buyers), cut the capital gains tax discount (to end a distortion favouring speculation) and to encourage build to rent property.
What is the risk of commercial property slump?
Commercial property benefitted like other assets from the search for yield as bond yields plunged in the decades into the pandemic providing a positive valuation effect. Some saw the asset class as a replacement for bonds in portfolios. However, its now vulnerable from the double whammy of the rise in bond yields driving a negative valuation effect at the same time as reduced space demand flowing from “work from home” in the case of office property and online retail in the case of retail property. Of these threats, the first looks more manageable as commercial property still offers a reasonable (but lower) risk premium over bonds but the second is more significant. An economic downturn would add to the threat. The experience of the early 1990s where office valuations fell for 3 years as oversupply & recession pushed vacancy rates to 20-30% warns that commercial property slumps can be drawn out.
Source: AMP Capital April 2023
Important note: While every care has been taken in the preparation of this document, AMP Capital Investors Limited (ABN 59 001 777 591, AFSL 232497) and AMP Capital Funds Management Limited (ABN 15 159 557 721, AFSL 426455) make no representations or warranties as to the accuracy or completeness of any statement in it including, without limitation, any forecasts. Past performance is not a reliable indicator of future performance. This document has been prepared for the purpose of providing general information, without taking account of any particular investor’s objectives, financial situation or needs. An investor should, before making any investment decisions, consider the appropriateness of the information in this document, and seek professional advice, having regard to the investor’s objectives, financial situation and needs. This document is solely for the use of the party to whom it is provided.
Five charts on investing to keep in mind in rough times like now
Dr Shane Oliver – Head of Investment Strategy and Chief Economist, AMP Capital
IntroductionEvery so often the degree of uncertainty around investment markets surges and that’s been the case for more than a year now reflecting the combination of high inflation, rapid interest rate hikes, the high and rising risk of recession which has been added to in the last few
Read MoreDr Shane Oliver – Head of Investment Strategy and Chief Economist, AMP Capital
Introduction
Every so often the degree of uncertainty around investment markets surges and that’s been the case for more than a year now reflecting the combination of high inflation, rapid interest rate hikes, the high and rising risk of recession which has been added to in the last few weeks by problems in US and European banks. And all of this has been against the background of increased geopolitical uncertainties. Falls in the value of share markets and other investments can be stressful as no one wants to see their wealth decline. And so when uncertainty is high a natural inclination is to retreat to perceived safety. As always, turmoil around investment markets is being met with much prognostication, some of which is enlightening but much is just noise. I will be the first to admit that my crystal ball is even hazier than normal in times like the present. As the US economist JK Galbraith once said “there are two types of economists – those that don’t know and those that don’t know they don’t know.” And this is certainly an environment where we need to be humble.

But while history does not repeat as each cycle is different, it does rhyme, in that each cycle has many common characteristics. So, while each cycle is different the basic principles of investing still apply. This note revisits once again five charts I find particularly useful in times of economic and investment market stress.
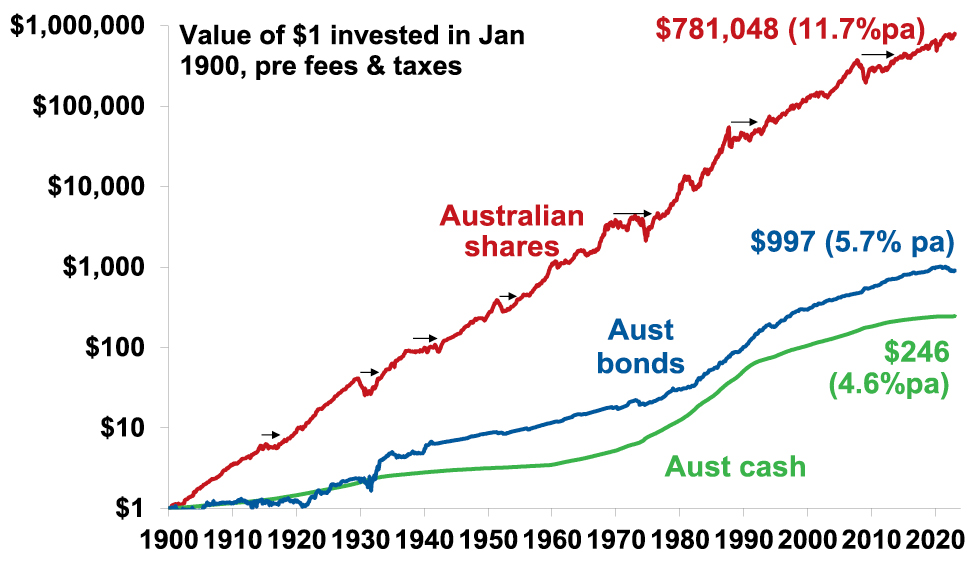
Chart #1 The power of compound interest
This is my favourite chart. It shows the value of $1 invested in various Australian assets in 1900 allowing for the reinvestment of dividends and interest along the way. That $1 would have grown to $246 if invested in cash, to $997 if invested in bonds and to $781,048 if invested in shares up until the end of February. While the average return since 1900 is only double that in shares relative to bonds, the huge difference between the two at the end owes to the impact of compounding – or earning returns on top of returns. So, any interest or return earned in one period is added to the original investment so that it all earns a return in the next period. And so on. I only have Australian residential property data back to 1926 but out of interest it shows (on average!) similar long term compounded returns to shares.
Shares versus bonds & cash over very long term – Australia
Source: Bloomberg, AMP
Key message: to grow our wealth, we must have exposure to growth assets like shares and property. While shares and property have had a rough ride over the last year as interest rates surged, history shows that both will likely do well over the long-term.
Chart #2 Don’t get blown off by cyclical swings
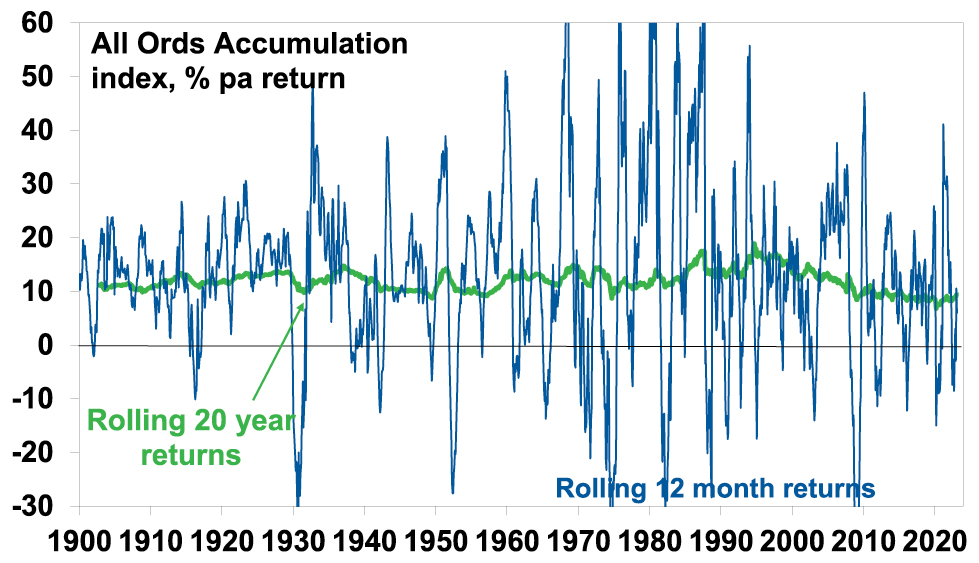
The trouble is that shares can have lots of (often severe) setbacks along the way as is evident during the periods highlighted by the arrows on the previous chart. Even annual returns in the share market are highly volatile, but longer-term returns tend to be solid and relatively smooth, as can be seen in the next chart. Since 1900, for Australian shares roughly two years out of ten have had negative returns but there are no negative returns over rolling 20-year periods.
Australian share returns over rolling 12 mth & 20 yr periods
Source: Bloomberg, AMP
The higher returns that shares produce over time relative to cash and bonds is compensation for the periodic setbacks they have. But understanding that these periodic setbacks are just an inevitable part of investing is important in being able to stay the course and get the benefit of the higher long-term returns shares and other growth assets provide over time.
Key message: short-term, sometimes violent swings in share markets are a fact of life but the longer the time horizon, the greater the chance your investments will meet their goals. So, in investing, time is on your side and it’s best to invest for the long-term when you can.
Chart #3 The roller coaster of investor emotion
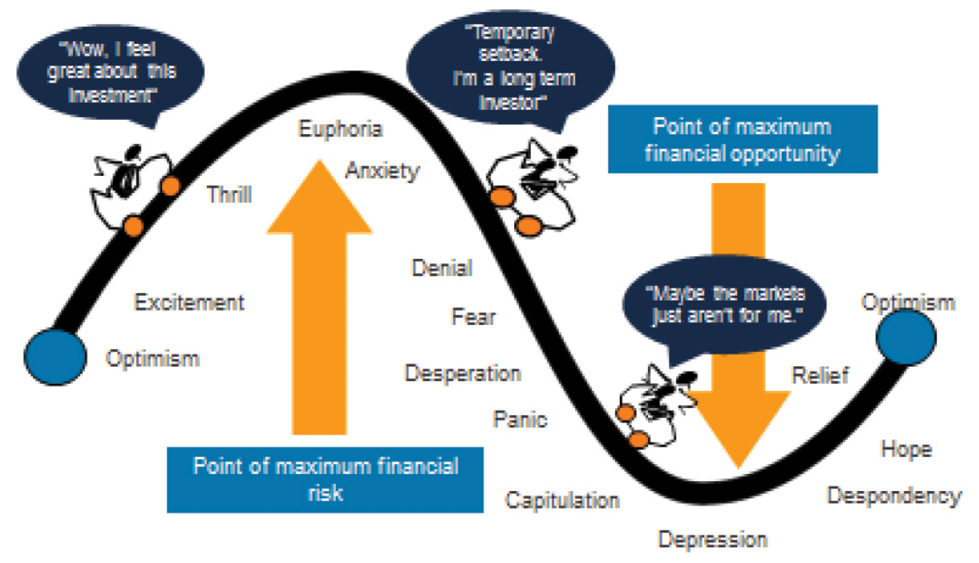
It’s well known that the swings in investment markets are more than can be justified by moves in investment fundamentals alone – like profits, dividends, rents and interest rates. This is because investor emotion plays a huge part. This has been more than evident over the last year with all the swings in markets. The next chart shows the roller coaster that investor emotion traces through the course of an investment cycle. Once a cycle turns down in a bear market, euphoria gives way to anxiety, denial, capitulation and ultimately depression at which point the asset class is under loved and undervalued and everyone who is going to sell has – and it becomes vulnerable to good (or less bad) news. This is the point of maximum opportunity. Once the cycle turns up again, depression gives way to hope and optimism before eventually seeing euphoria again.
The roller coaster of investor emotion
Source: Russell Investments, AMP
Key message: investor emotion plays a huge role in magnifying the swings in investment markets. The key for investors is not to get sucked into this emotional roller coaster. Of course, doing this is easier said than done, which is why many investors end up getting wrong footed by the investment cycle.
Chart #4 The wall of worry
There is always something for investors to worry about it seems. And in a world where social media is competing intensely with old media it all seems more magnified and worrying. This is arguably evident again now in relation to uncertainty about inflation, interest rates and associated recessions risks. The global economy has had plenty of worries over the last century, but it got over them with Australian shares returning 11.7% per annum since 1900, with a broad rising trend in the All Ords price index as can be seen in the next chart, and US shares returning 9.9% pa. (Note that this chart shows the All Ords share price index whereas the first chart shows the value of $1 invested in the All Ords accumulation index, which allows for changes in share prices and dividends.)
Key message: worries are normal around the economy and investments and sometimes they become intense – like now. But they eventually pass.
Australian shares have climbed a wall of worry

Source: ASX, AMP
Chart #5 Timing is hard
The temptation to time markets is immense. With the benefit of hindsight many swings in markets like the tech boom and bust and the GFC look inevitable and hence forecastable and so it’s natural to think why not switch between say cash and shares within your super fund to anticipate market moves. This is particularly the case in times of emotional stress like now when much of the news around inflation, interest rates and recession risks seem bad. Fair enough if you have a process and put the effort in. But without a tried and tested market timing process, trying to time the market is difficult. A good way to demonstrate this is with a comparison of returns if an investor is fully invested in shares versus missing out on the best (or worst) days. The next chart shows that if you were fully invested in Australian shares from January 1995, you would have returned 9.3% pa (with dividends but not allowing for franking credits, tax and fees).
Missing the best days and the worst days
Return on Australian shares, % pa (All Ords Accumulation Index, 1995-2023)
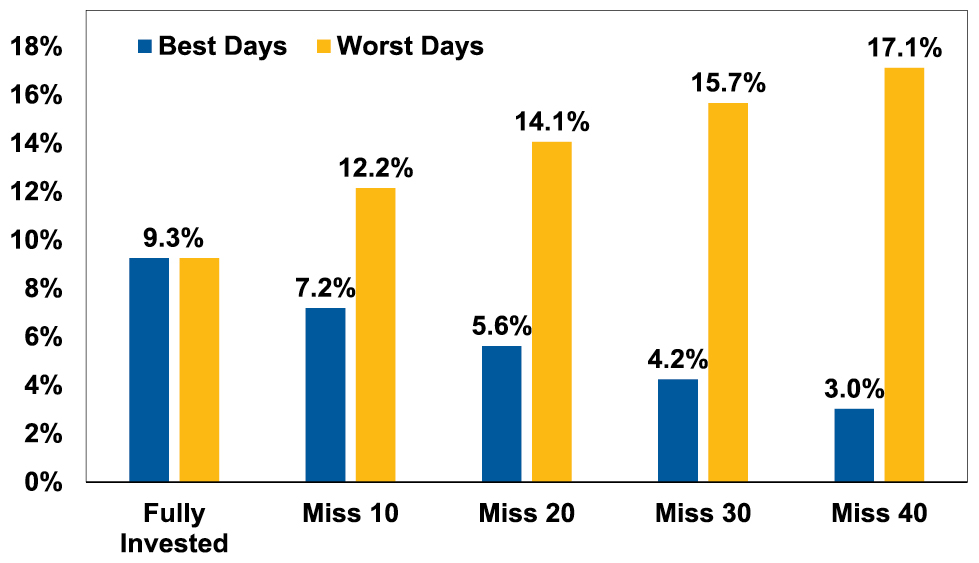
Covers Jan 1995 to 17 March 2020. Source: Bloomberg, AMP
If by trying to time the market you avoided the 10 worst days (yellow bars), you would have boosted your return to 12.2% pa. And if you avoided the 40 worst days, it would have been boosted to 17.1% pa! But this is very hard, and many investors only get out after the bad returns have occurred, just in time to miss some of the best days. For example, if by trying to time the market you miss the 10 best days (blue bars), the return falls to 7.2% pa. If you miss the 40 best days, it drops to just 3% pa.
Key message: trying to time the share market is not easy. For most its best to stick to an appropriate well thought out long term investment strategy.
Source: AMP Capital March 2023
Important note: While every care has been taken in the preparation of this document, AMP Capital Investors Limited (ABN 59 001 777 591, AFSL 232497) and AMP Capital Funds Management Limited (ABN 15 159 557 721, AFSL 426455) make no representations or warranties as to the accuracy or completeness of any statement in it including, without limitation, any forecasts. Past performance is not a reliable indicator of future performance. This document has been prepared for the purpose of providing general information, without taking account of any particular investor’s objectives, financial situation or needs. An investor should, before making any investment decisions, consider the appropriateness of the information in this document, and seek professional advice, having regard to the investor’s objectives, financial situation and needs. This document is solely for the use of the party to whom it is provided.